SMO Insights Mon 2026-11-02: Phase +1 Bullish New +36.7% MSS (+4.5%) (10 days Bullish)
See About for more detailed background to this analysis. TLDR: objectively measure strength at multiple market levels to logically guide portfolio exposure.
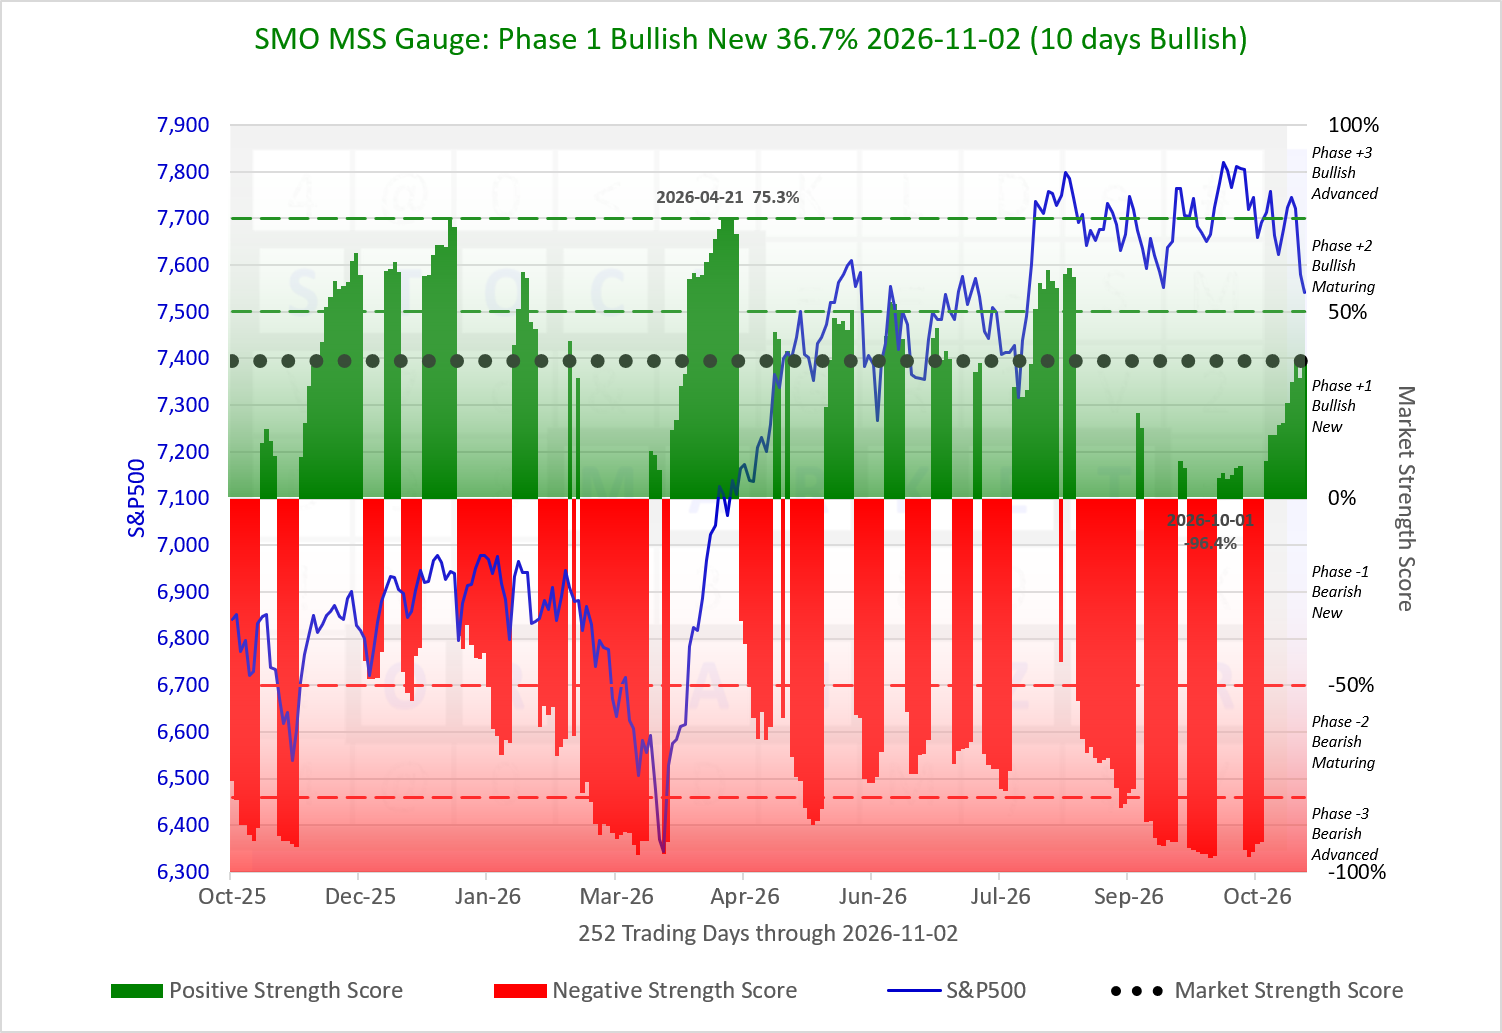
SMO Market Strength Score Gauge
Provides 12 month context against prior scores and the S&P 500 for today's MSS.
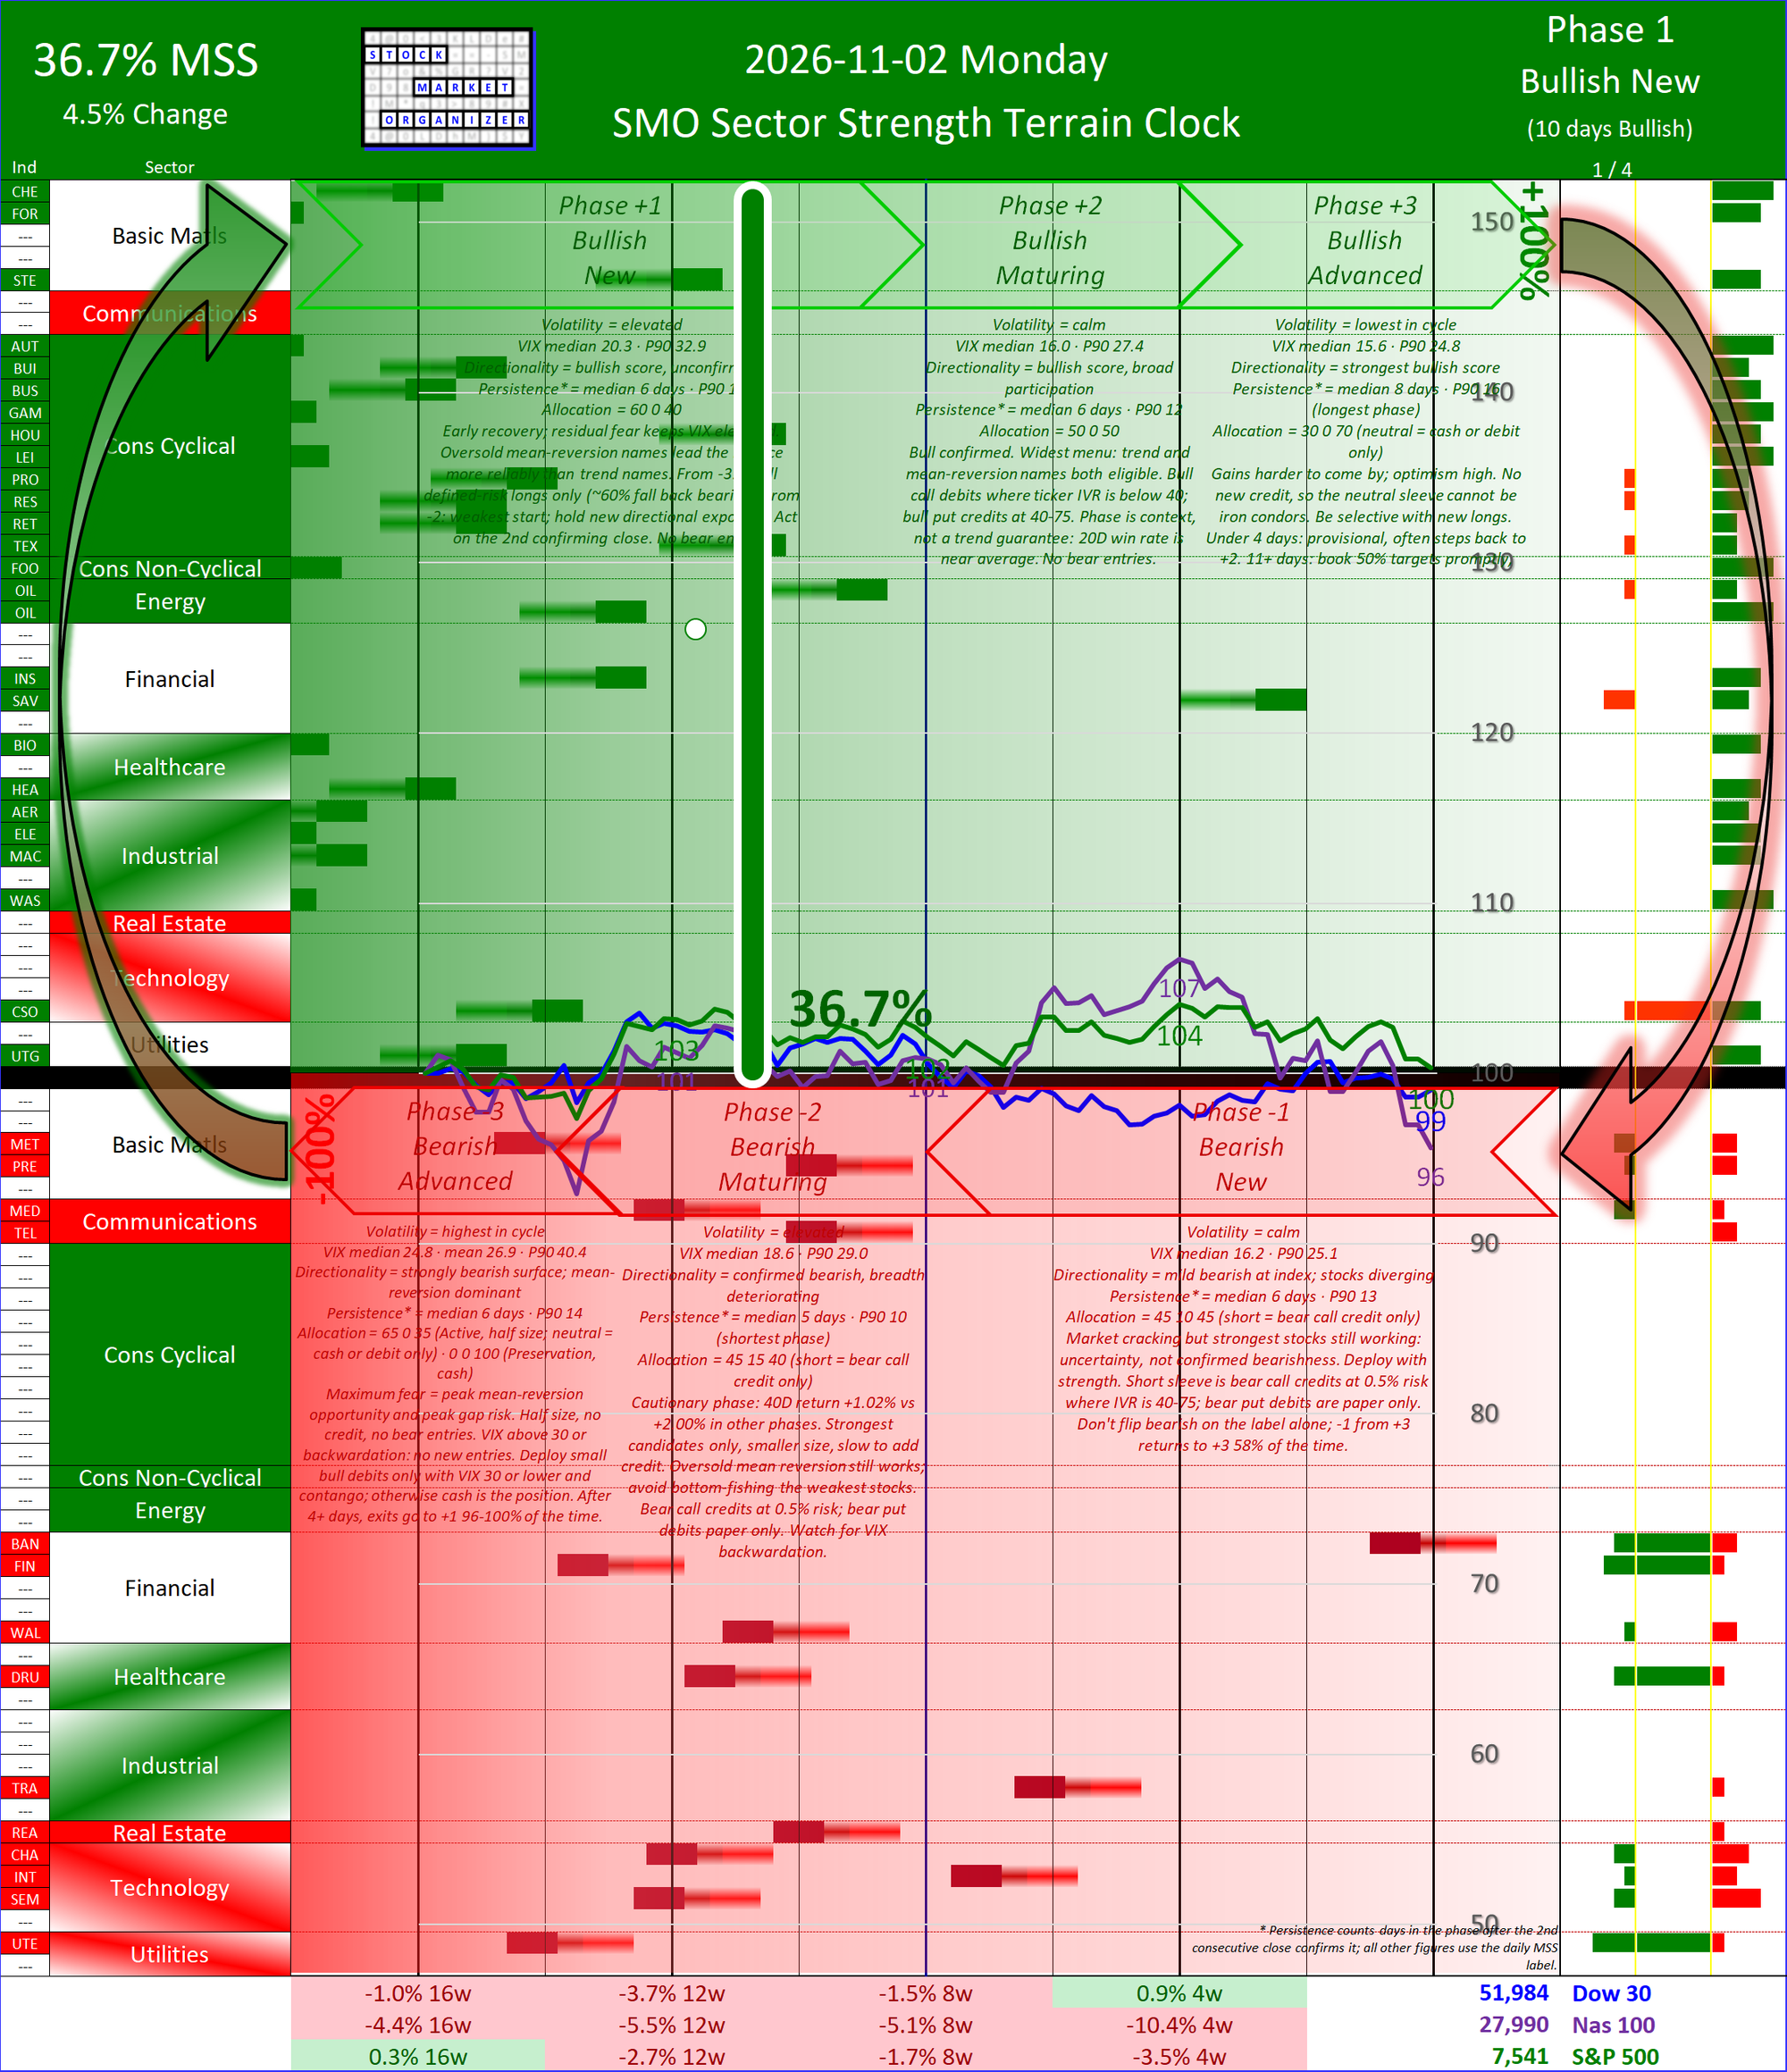
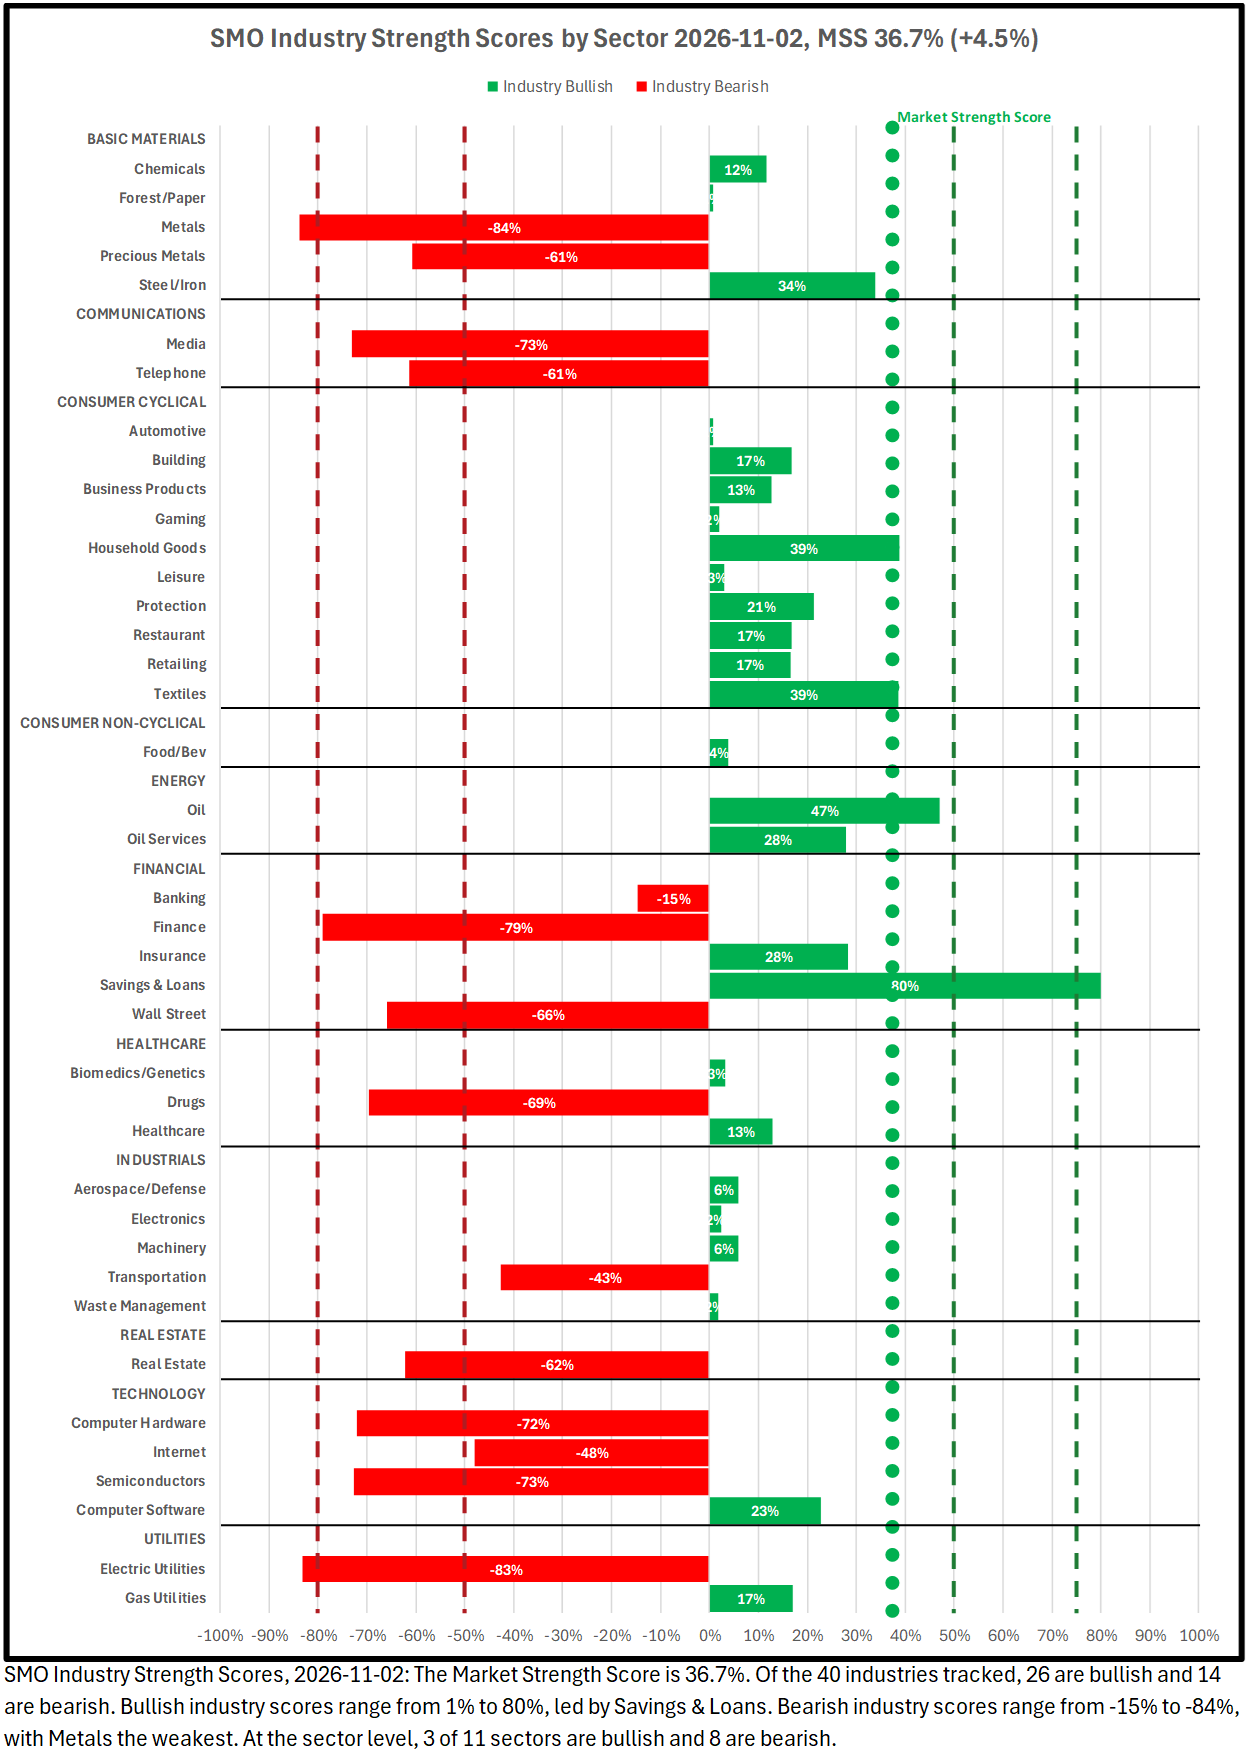
SMO Industry Strength Scores by Sector
The sectors are listed alphabetically and below each are their component industries listed alphabetically. The Six Phase thresholds are labeled along with the current Market Strength Score. This reveals sector strength breadth and depth.
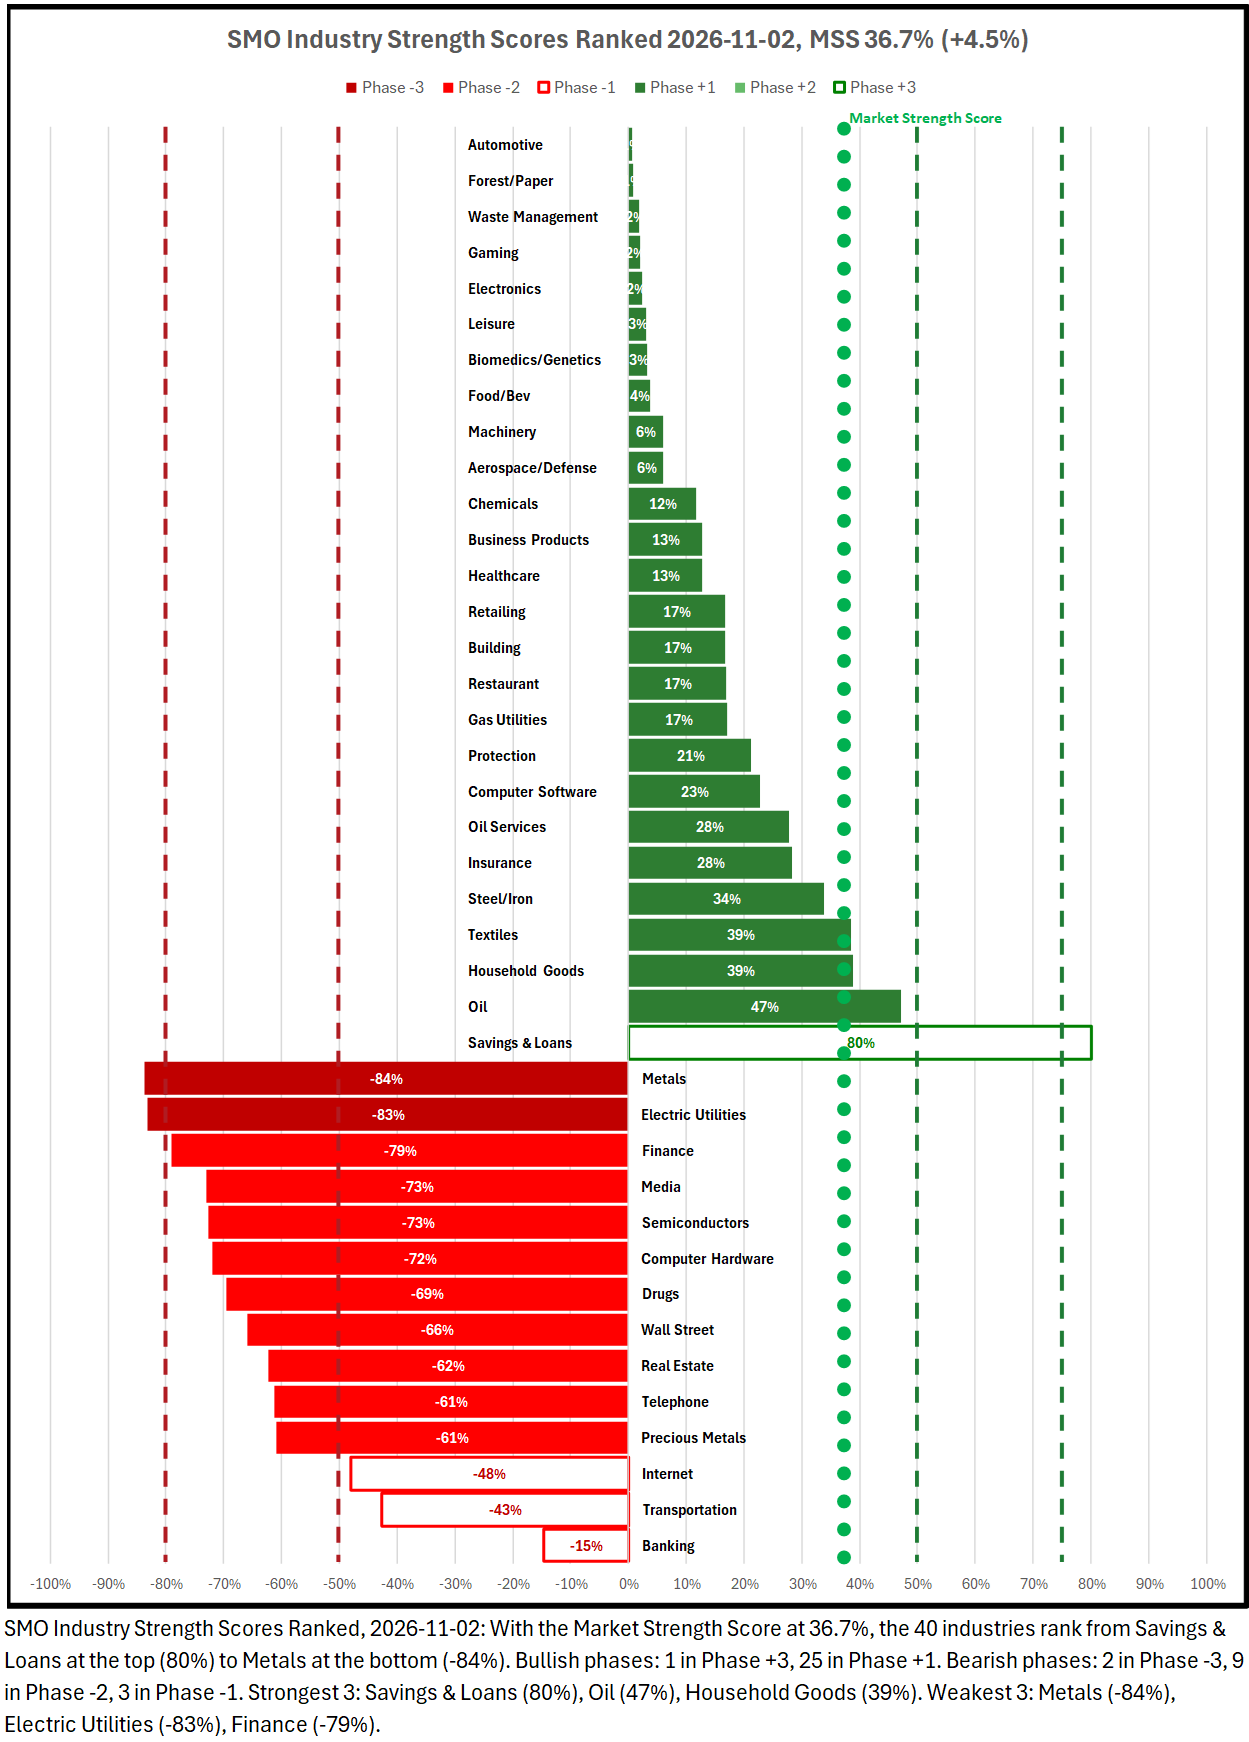
SMO Industry Strength Scores Ranked
The industries are listed based on strength score, first strengthening industries then weakening industries. The Six Phase thresholds are labeled along with the current Market Strength Score. This reveals the least and most extended industries.
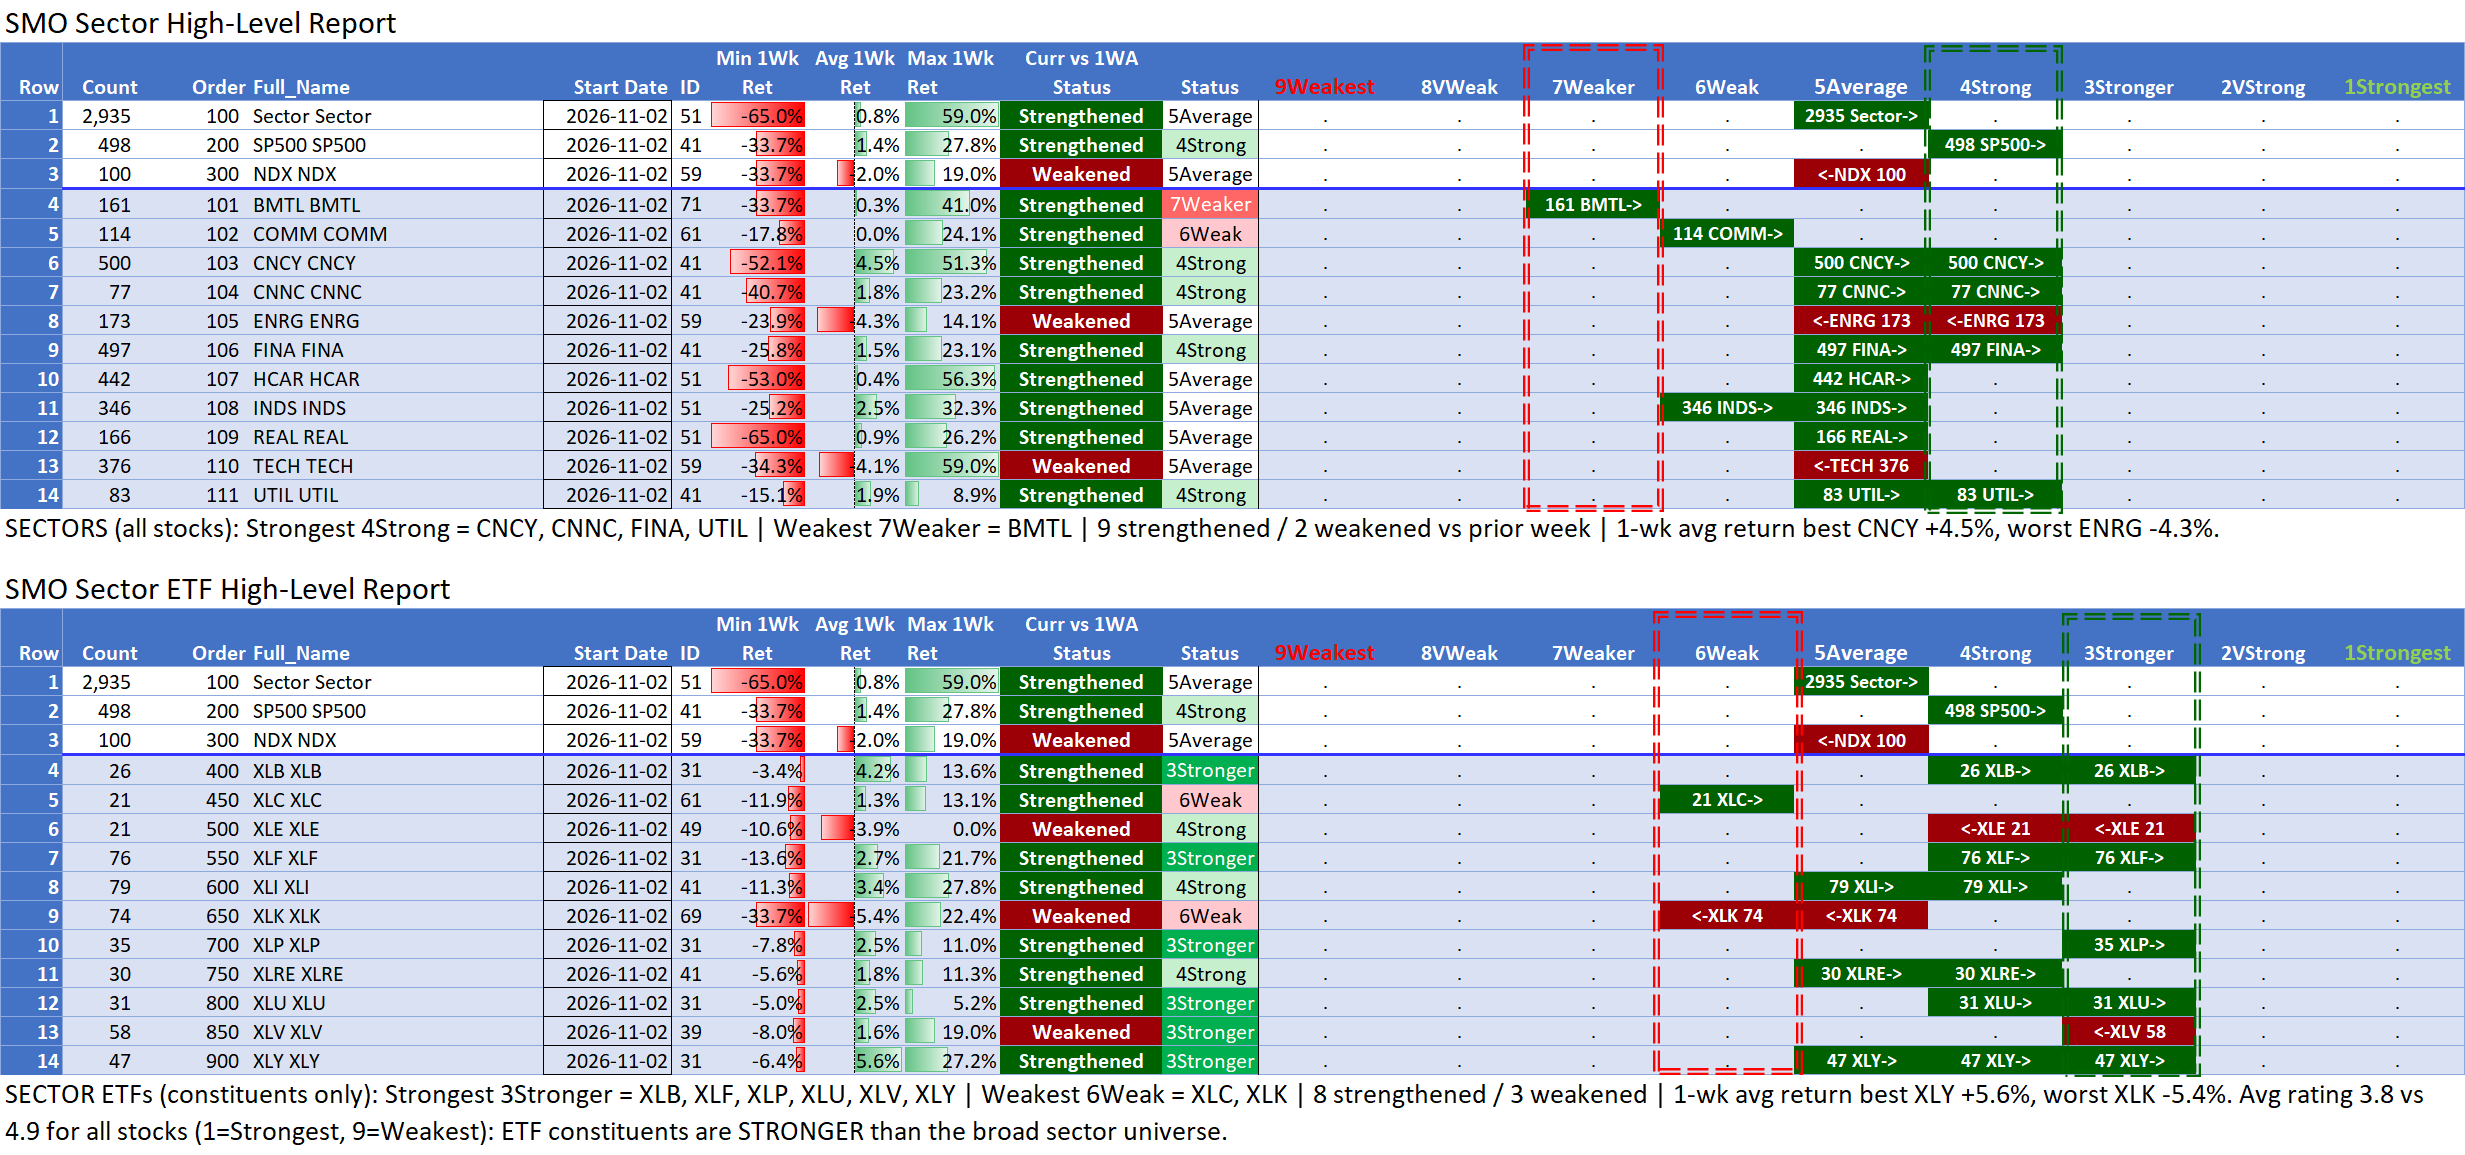
SMO Sector and Sector ETFs High-Level Reports
The Sector Report lists the strength spectrum readings for the 11 sectors. The Sector ETFs Report lists the strength spectrum readings for the 11 sector ETFs. Each report also shows the combined strength spectrum for all stocks in this universe and for the major indexes S&P 500 and NDX.
This provides a broad overview of market strength and weakness pockets.
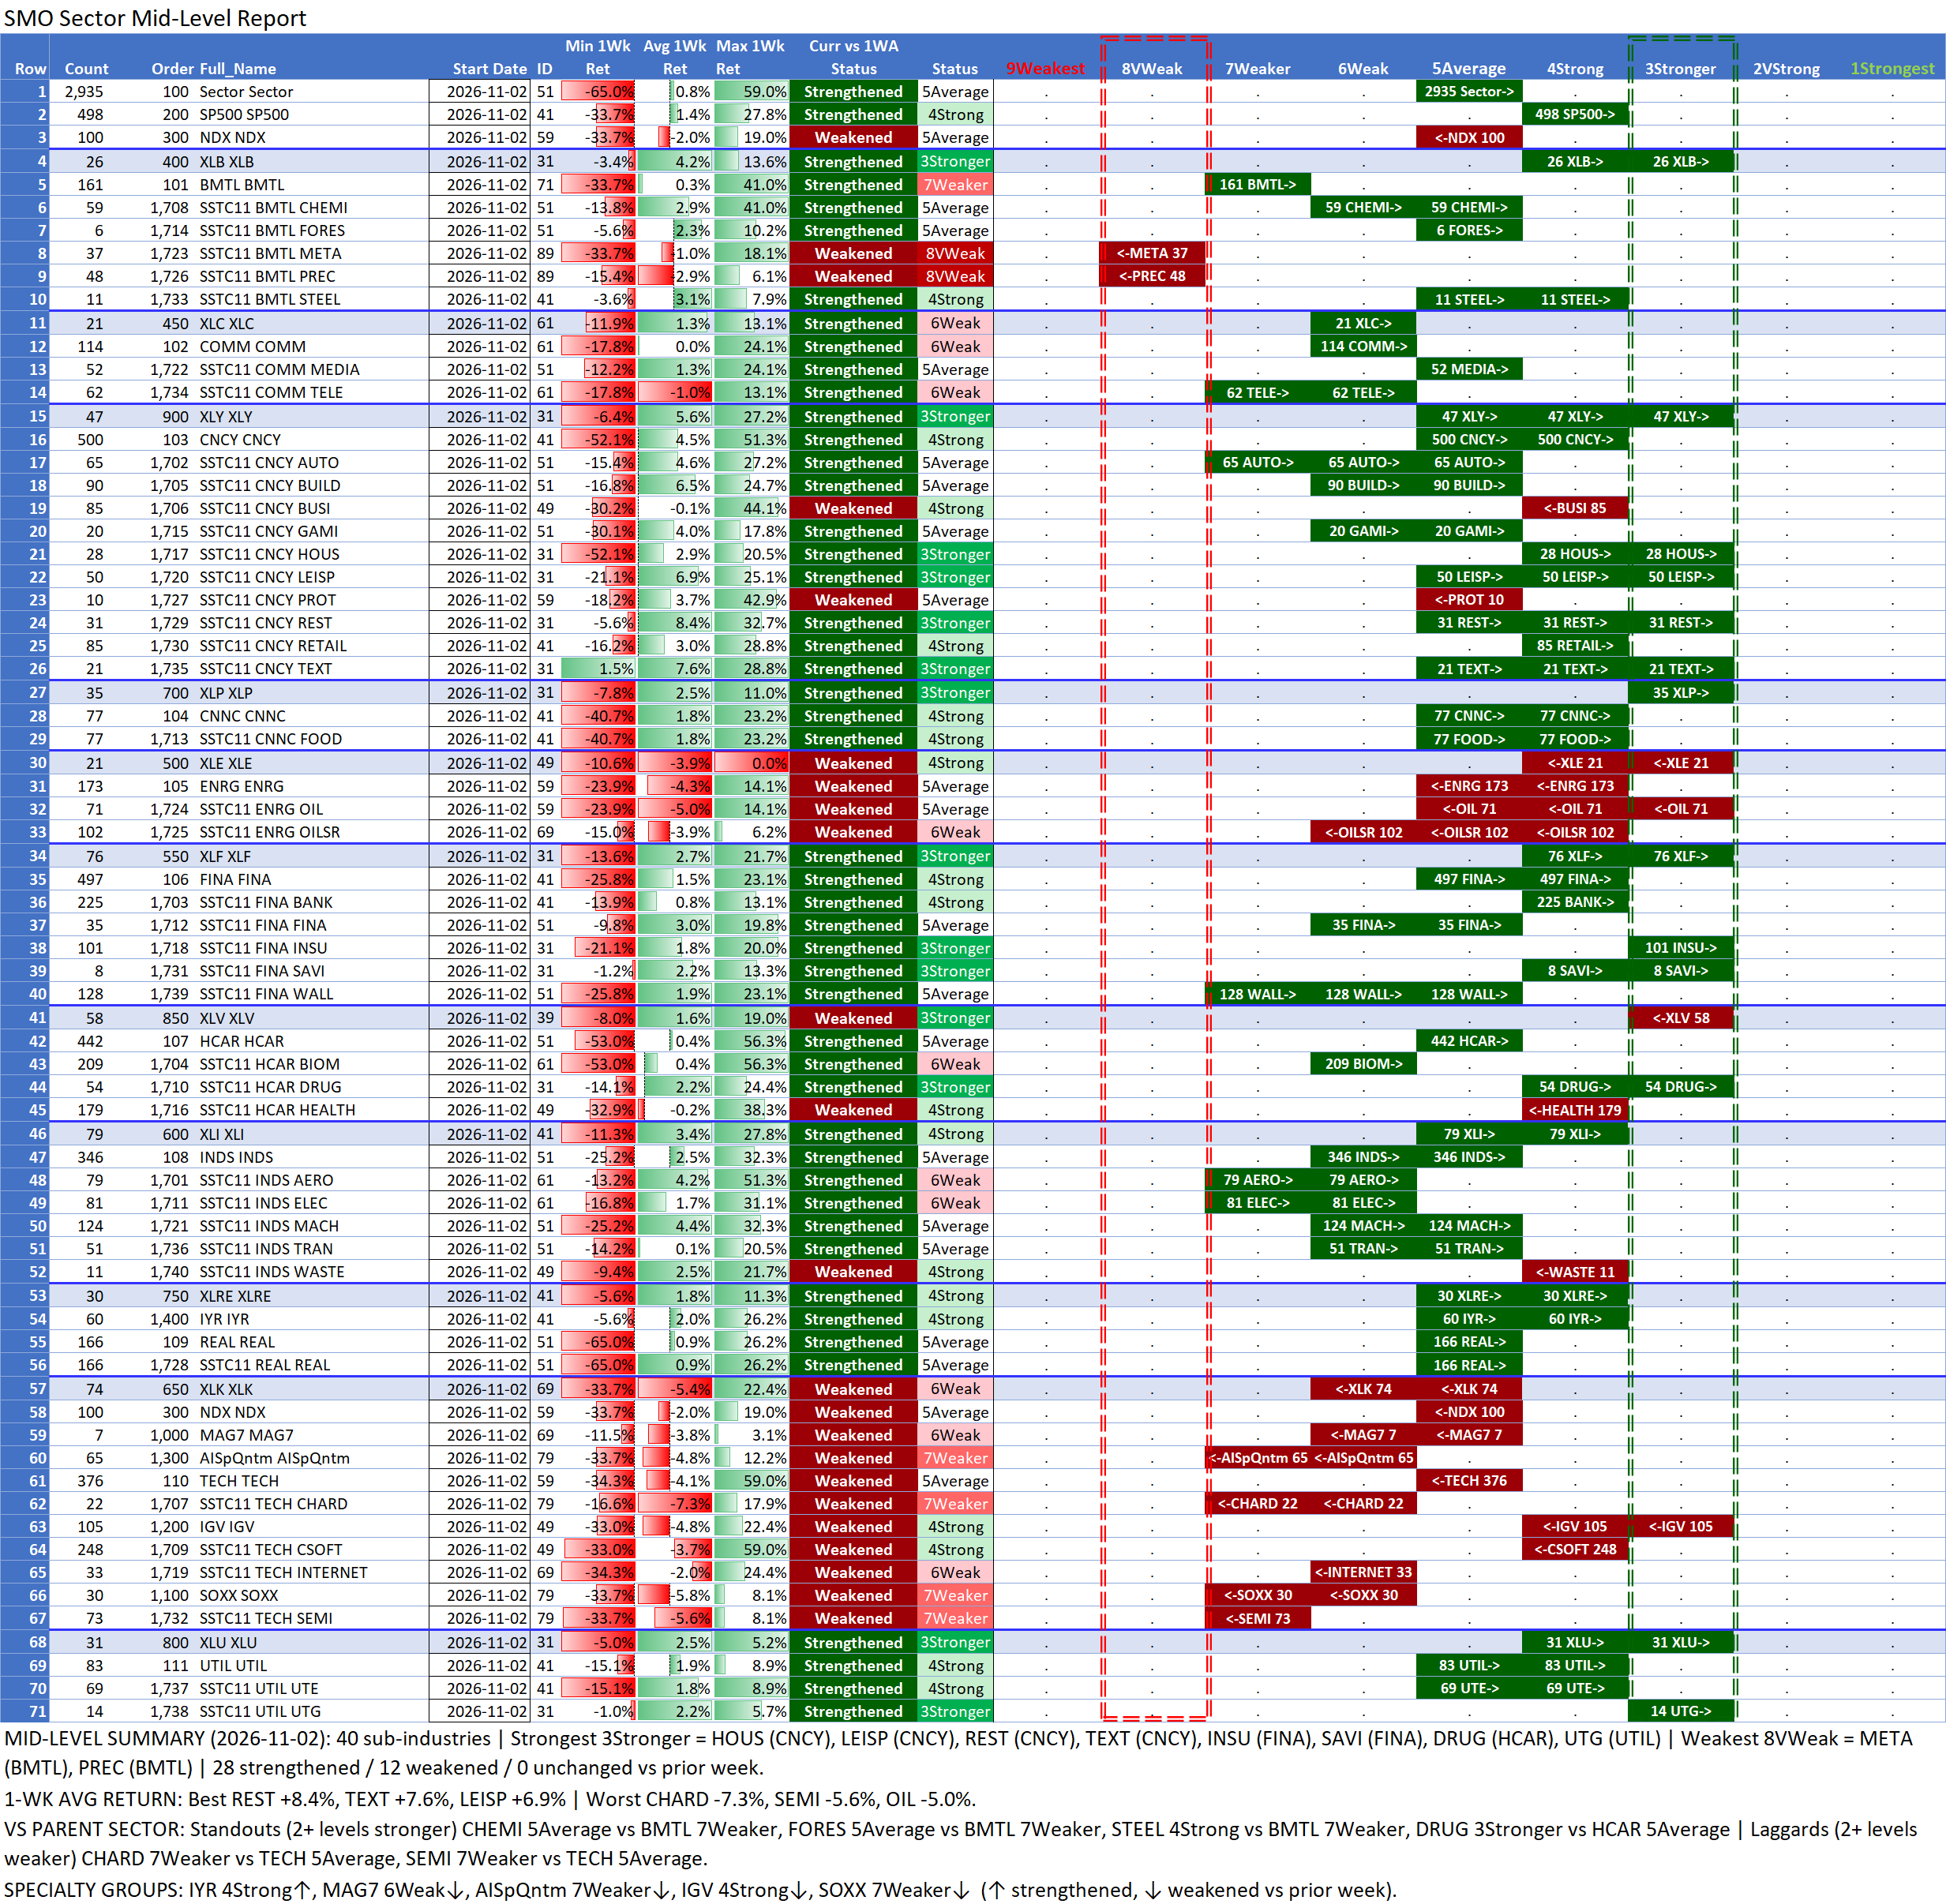
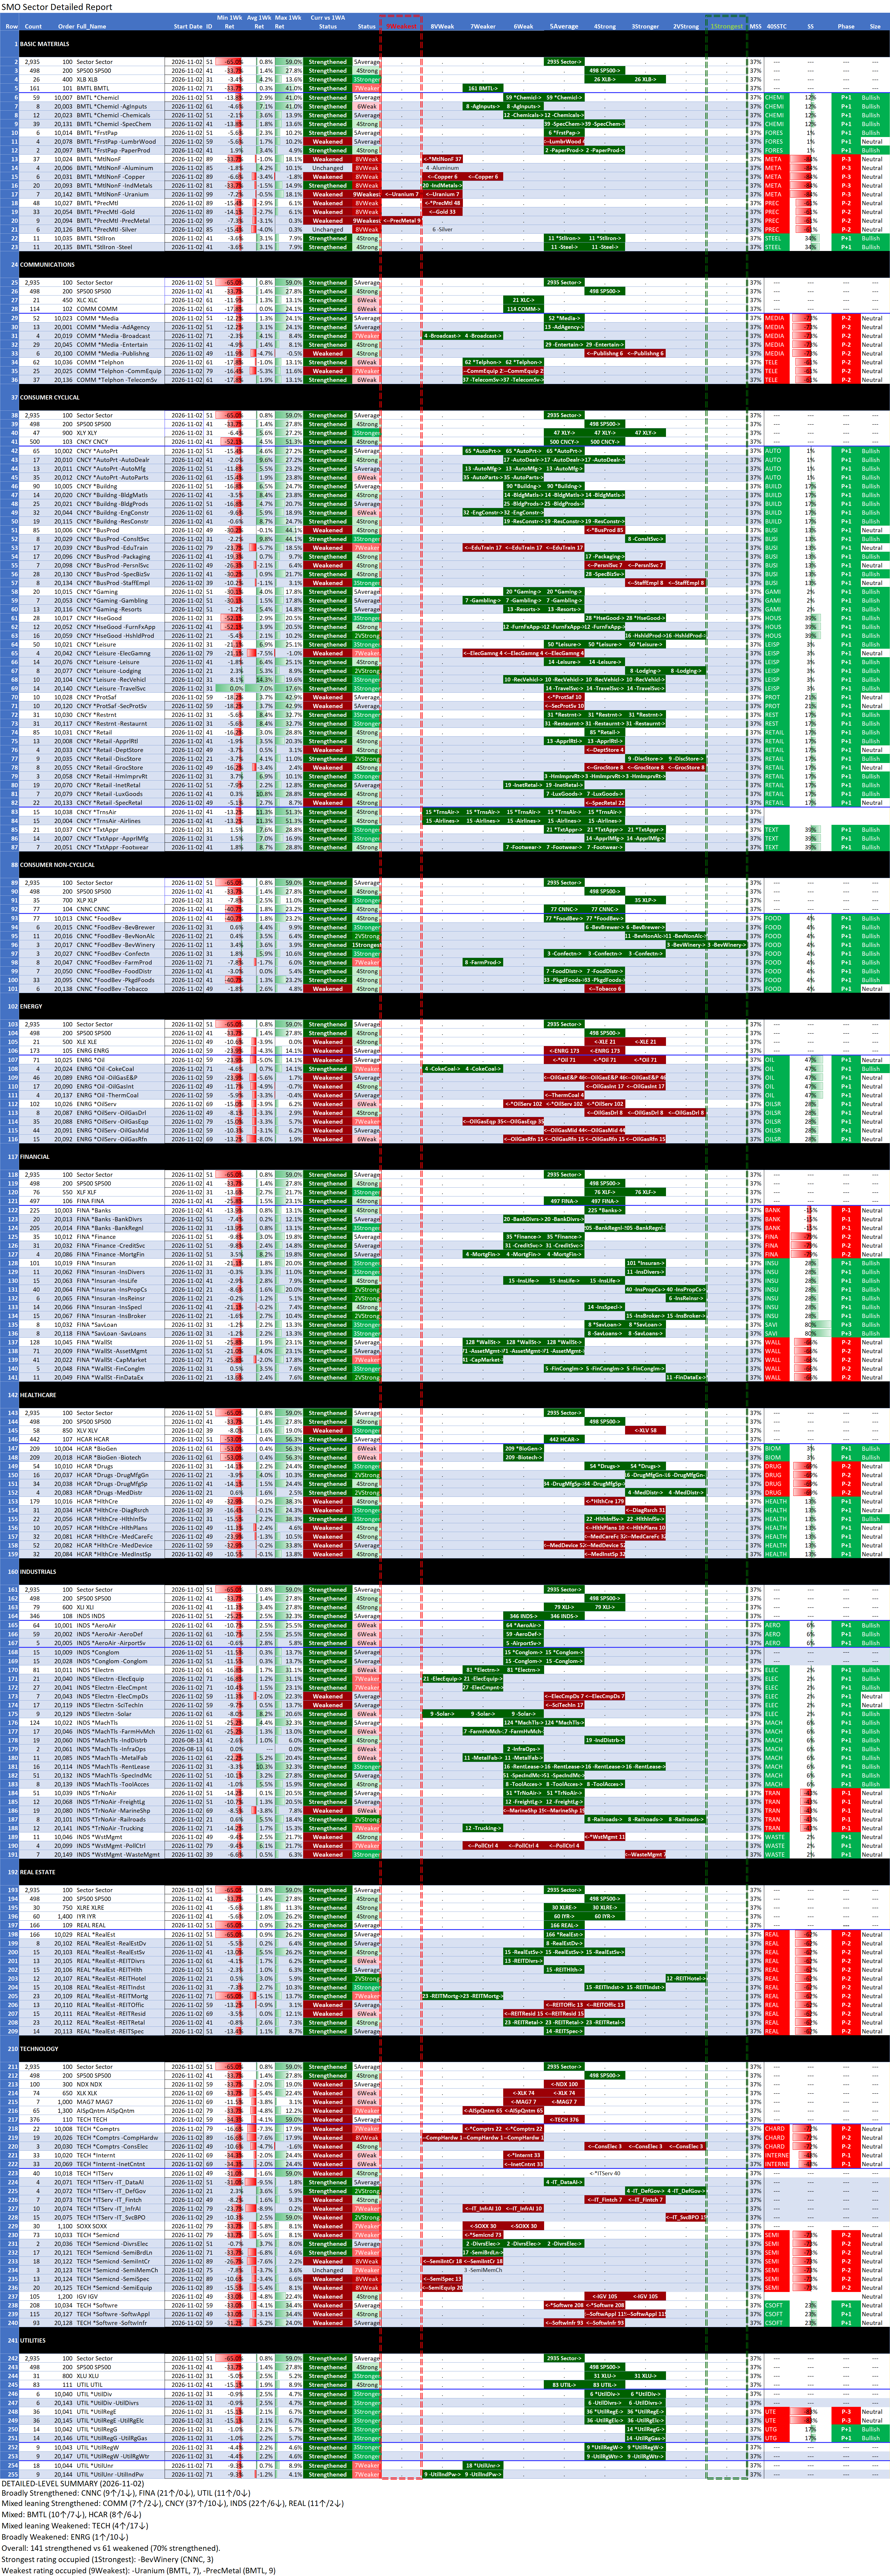
SMO Sector Mid-Level and Detailed Reports
The following Sector Mid-Level and Detailed Reports provide more refined market strength pockets, potential relative lasting power for these strengths, and a logical foundation for potential stock-/option-specific actions.
SMO Ranked Reports
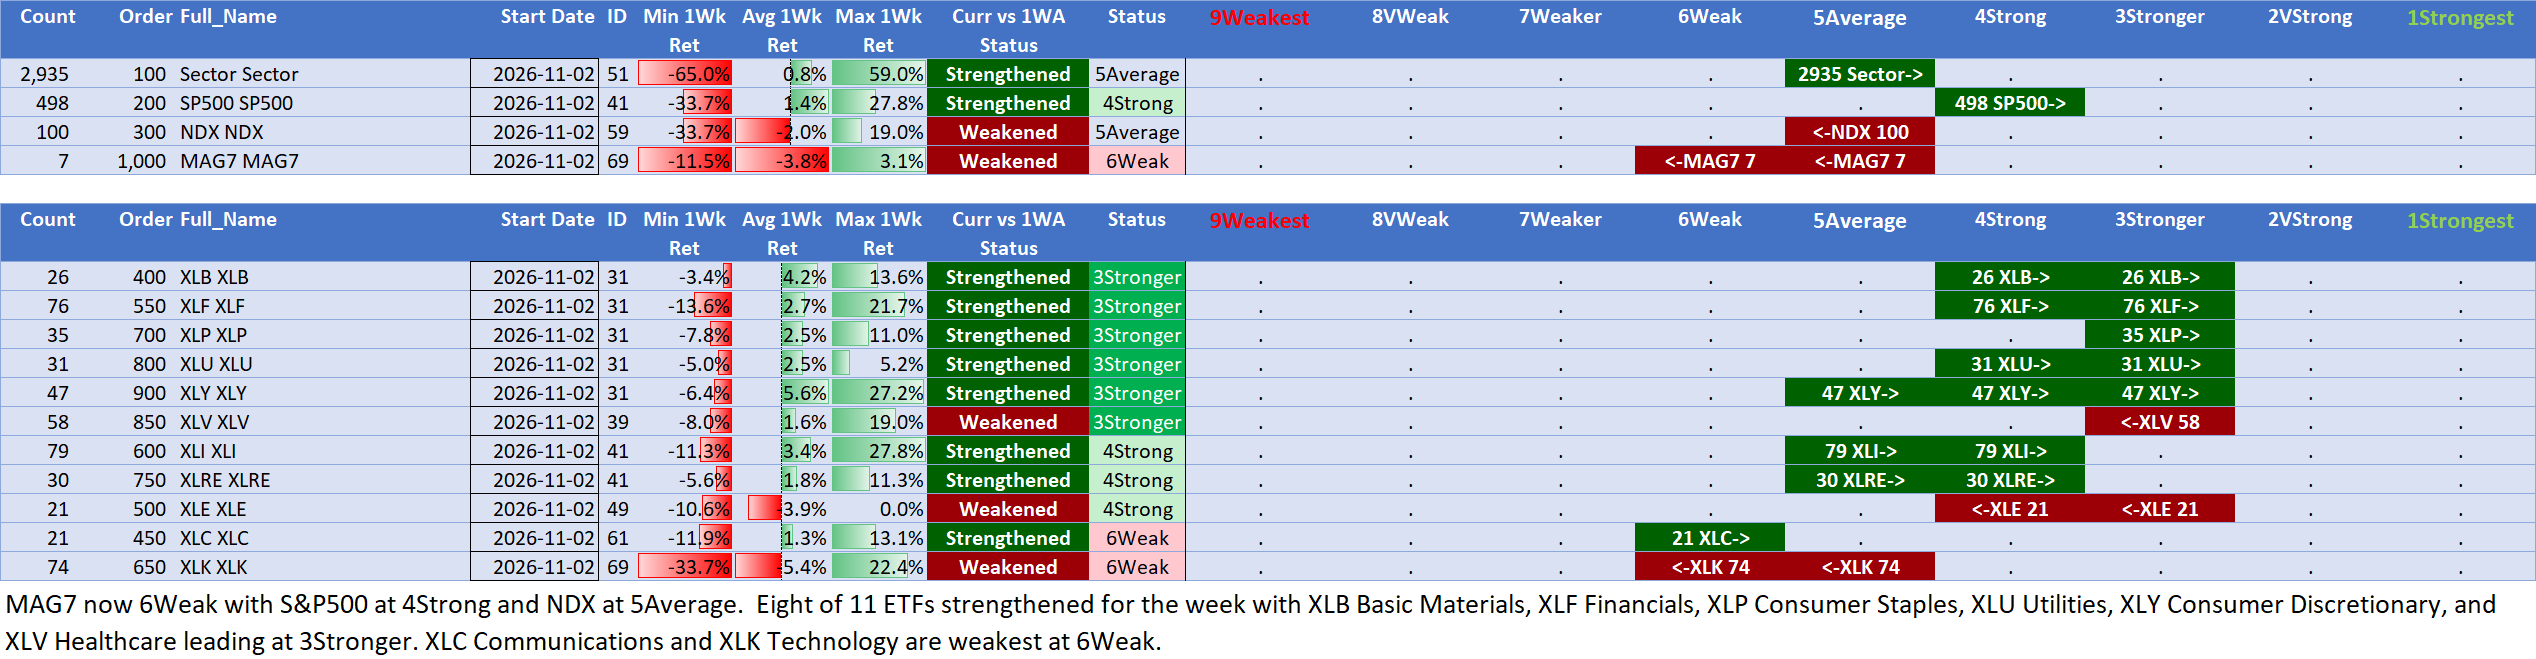
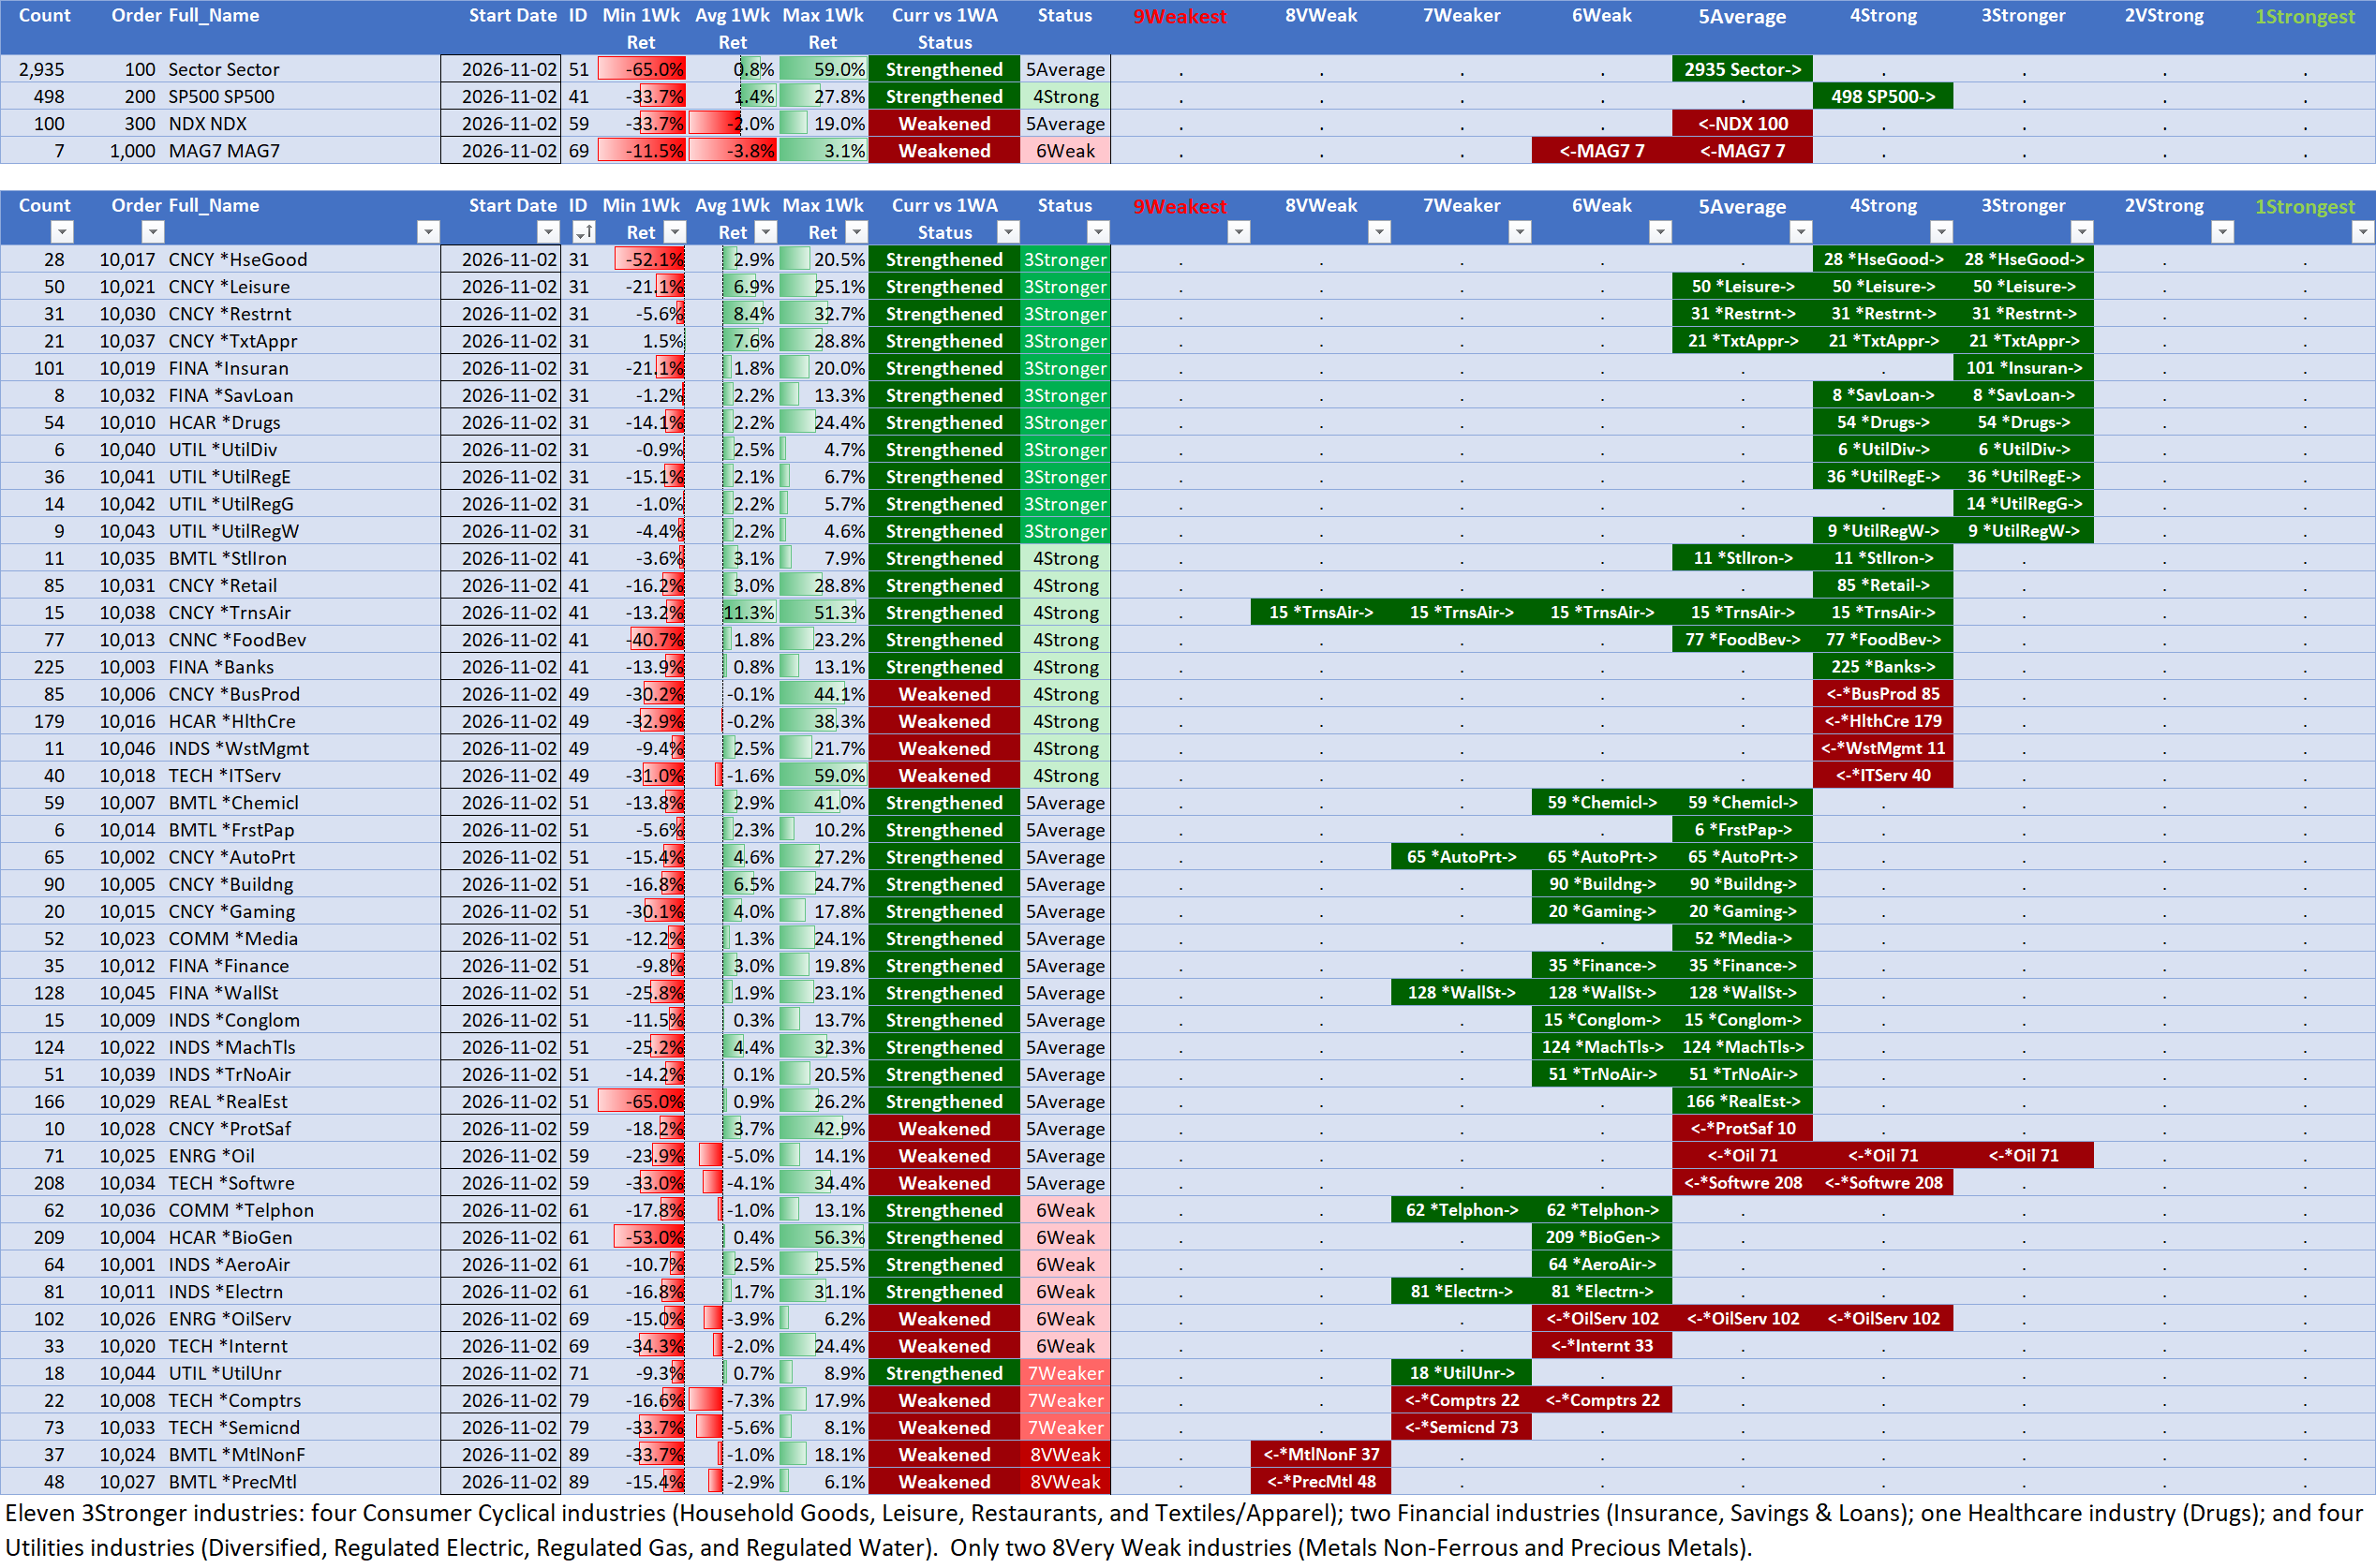
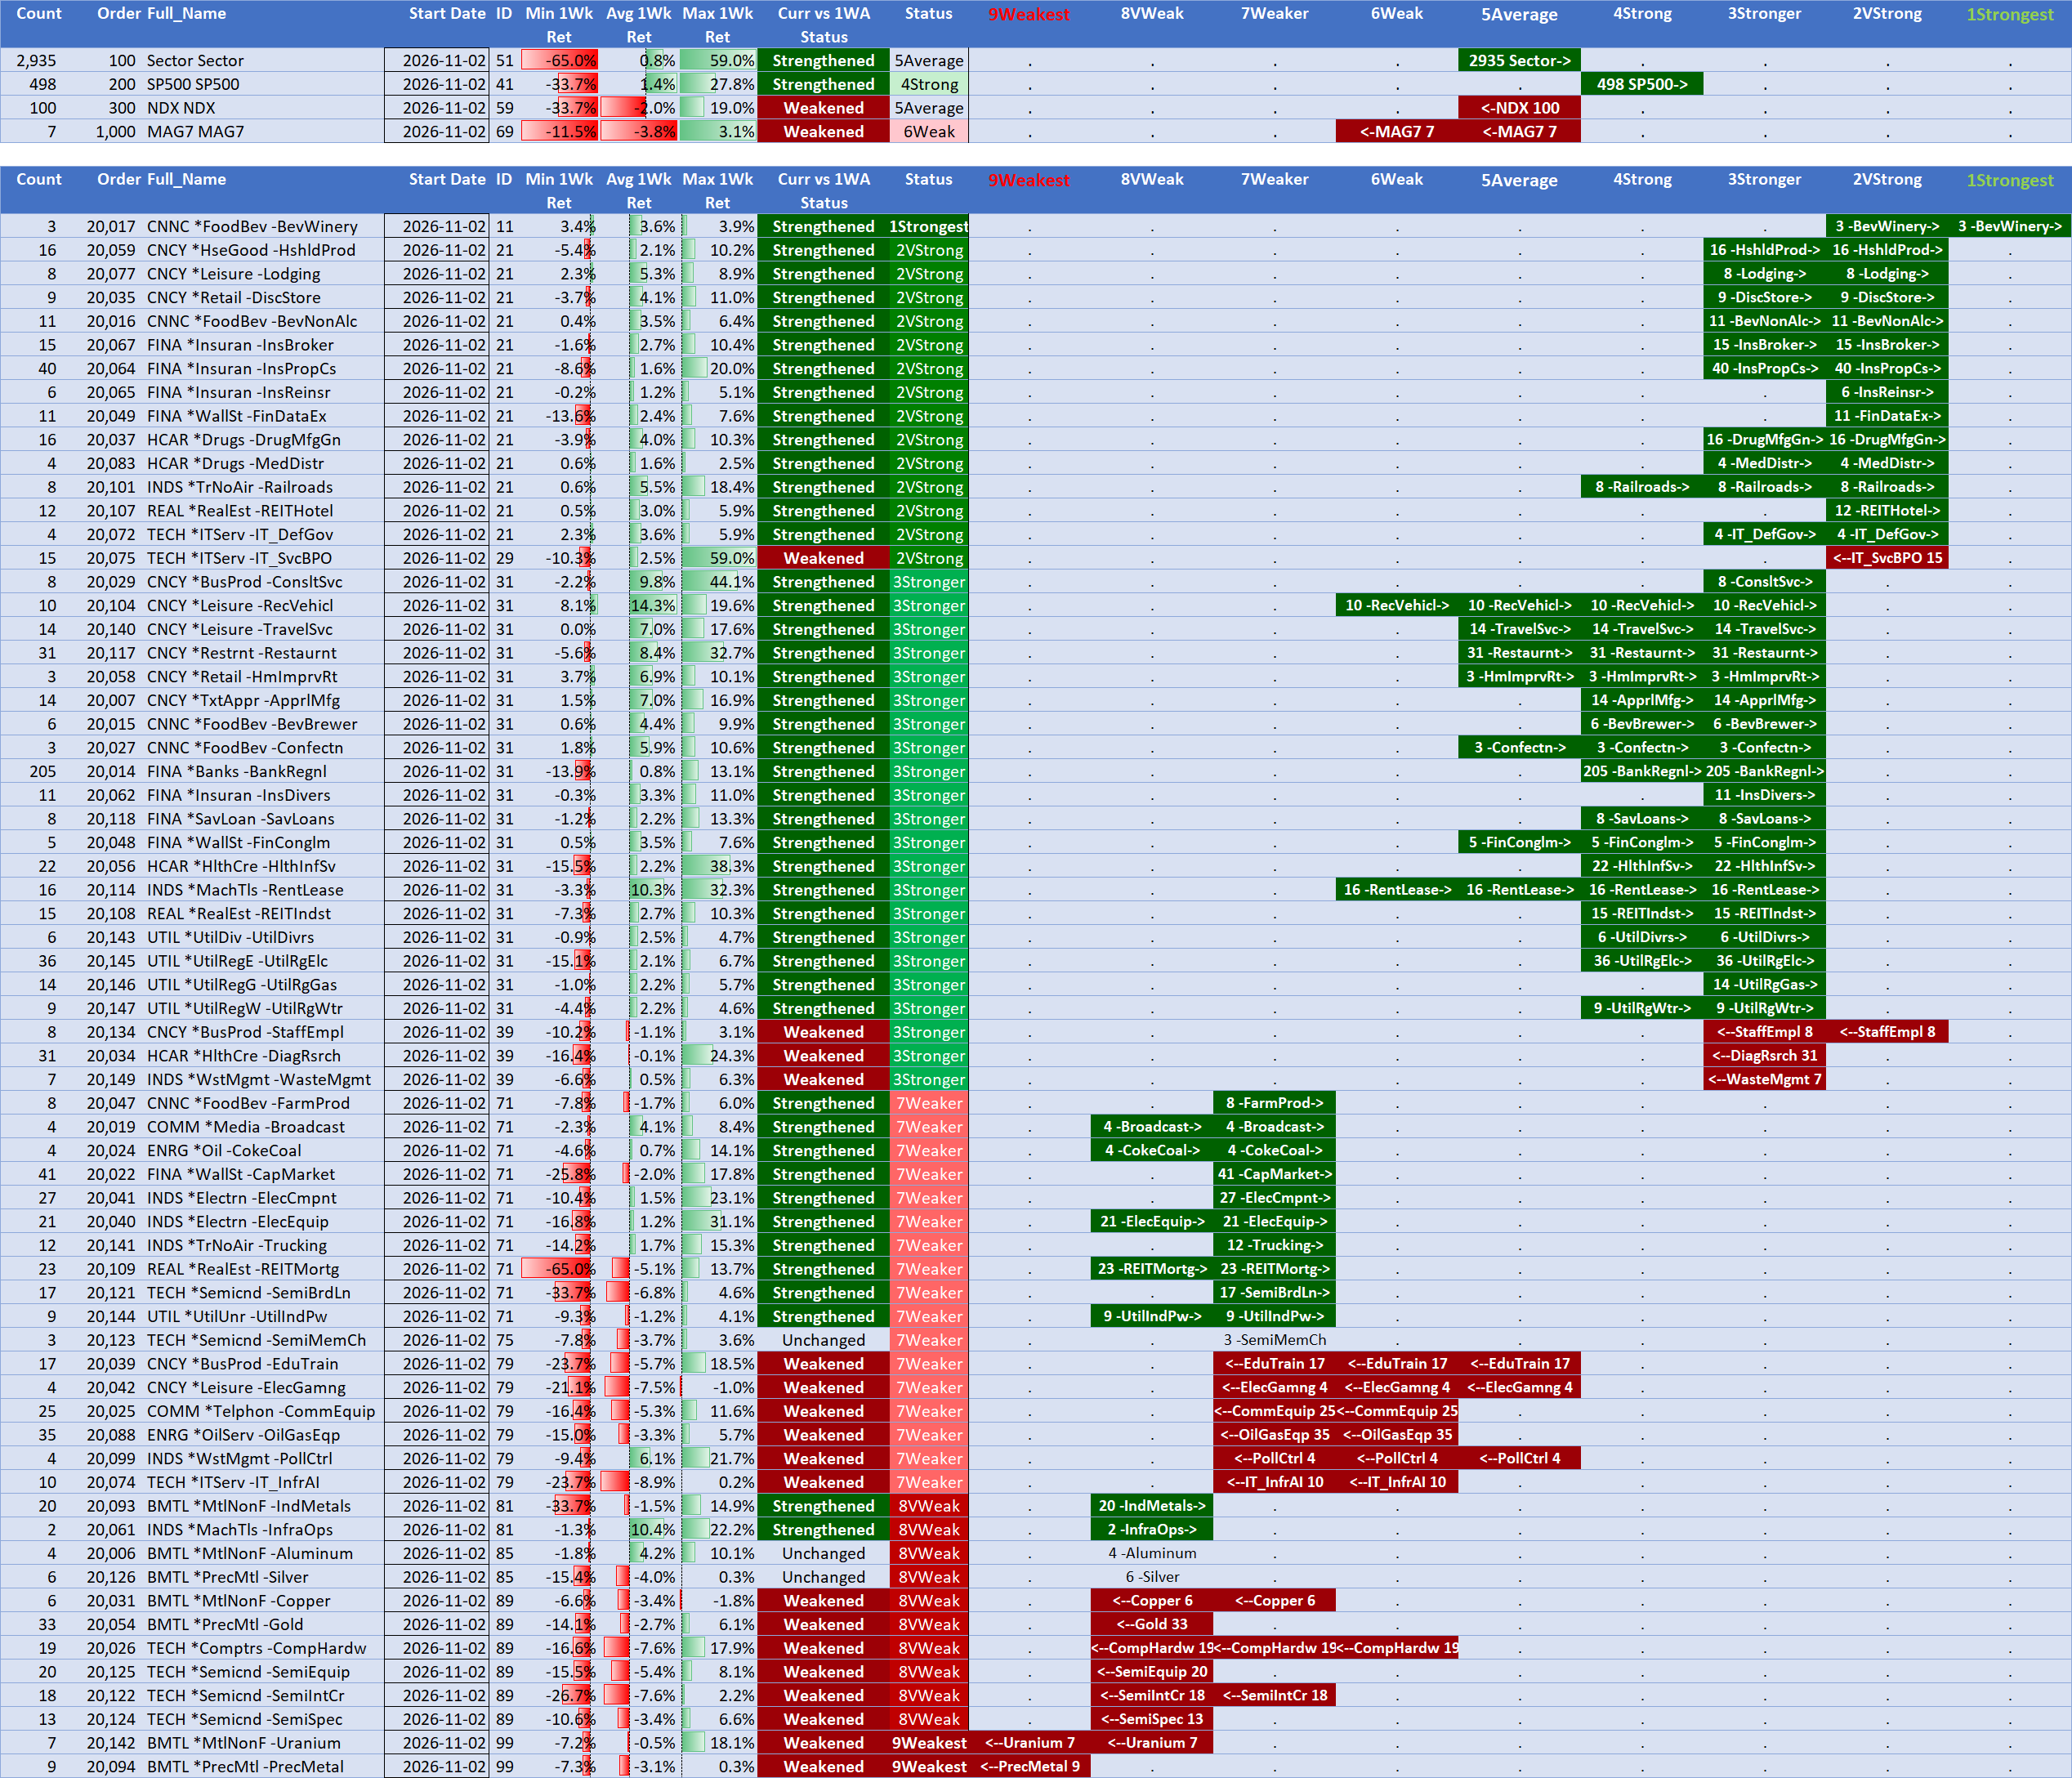
The following provide strongest to weakest ranked views of the sectors, industries, and sub-industries.
Sector ETFs Ranked Report
Industry Ranked Report
Sub-Industry Ranked Report, Strongest and Weakest Only
The sub-industries report shows only those ranked 3Stronger, 2Very Strong, 1Strongest, 7Weaker, 8Very Weak, and 9Weakest.
For educational purposes only. These are not stock or investment recommendations. See this disclaimer.