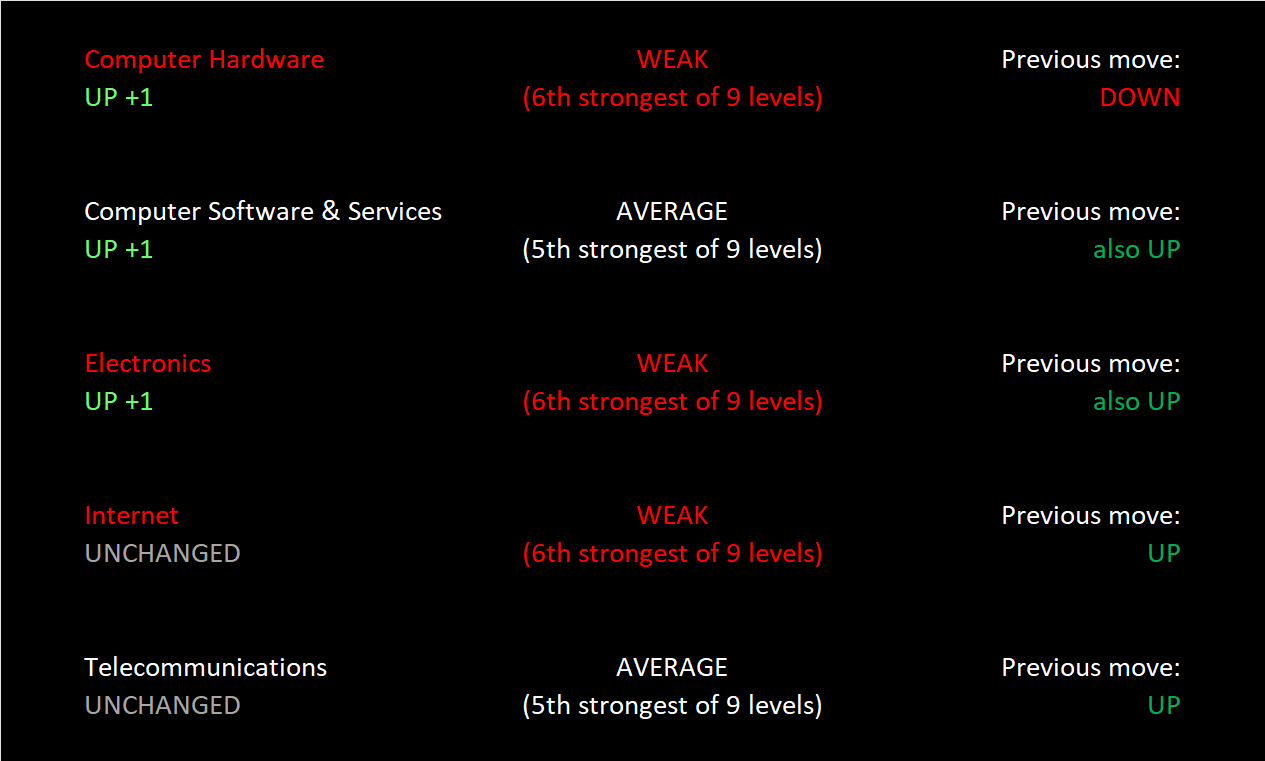
Technology Sector Thu 2025-05-08: 5.5 Strength Score (Strengthened +0.8)
Tailwind/Neutral/Headwind Bottom Line
Tailwind
Market (positive, not extreme market strength score)
Technology Sector (strengthened)
Computer Hardware Industry (strengthened rating)
Computer Software & Services Industry (strengthened rating)
Electronics Industry (strengthened rating)
Internet Industry (strengthened)
Neutral
Telecommunications Industry (unchanged over the past week)
Headwind
None
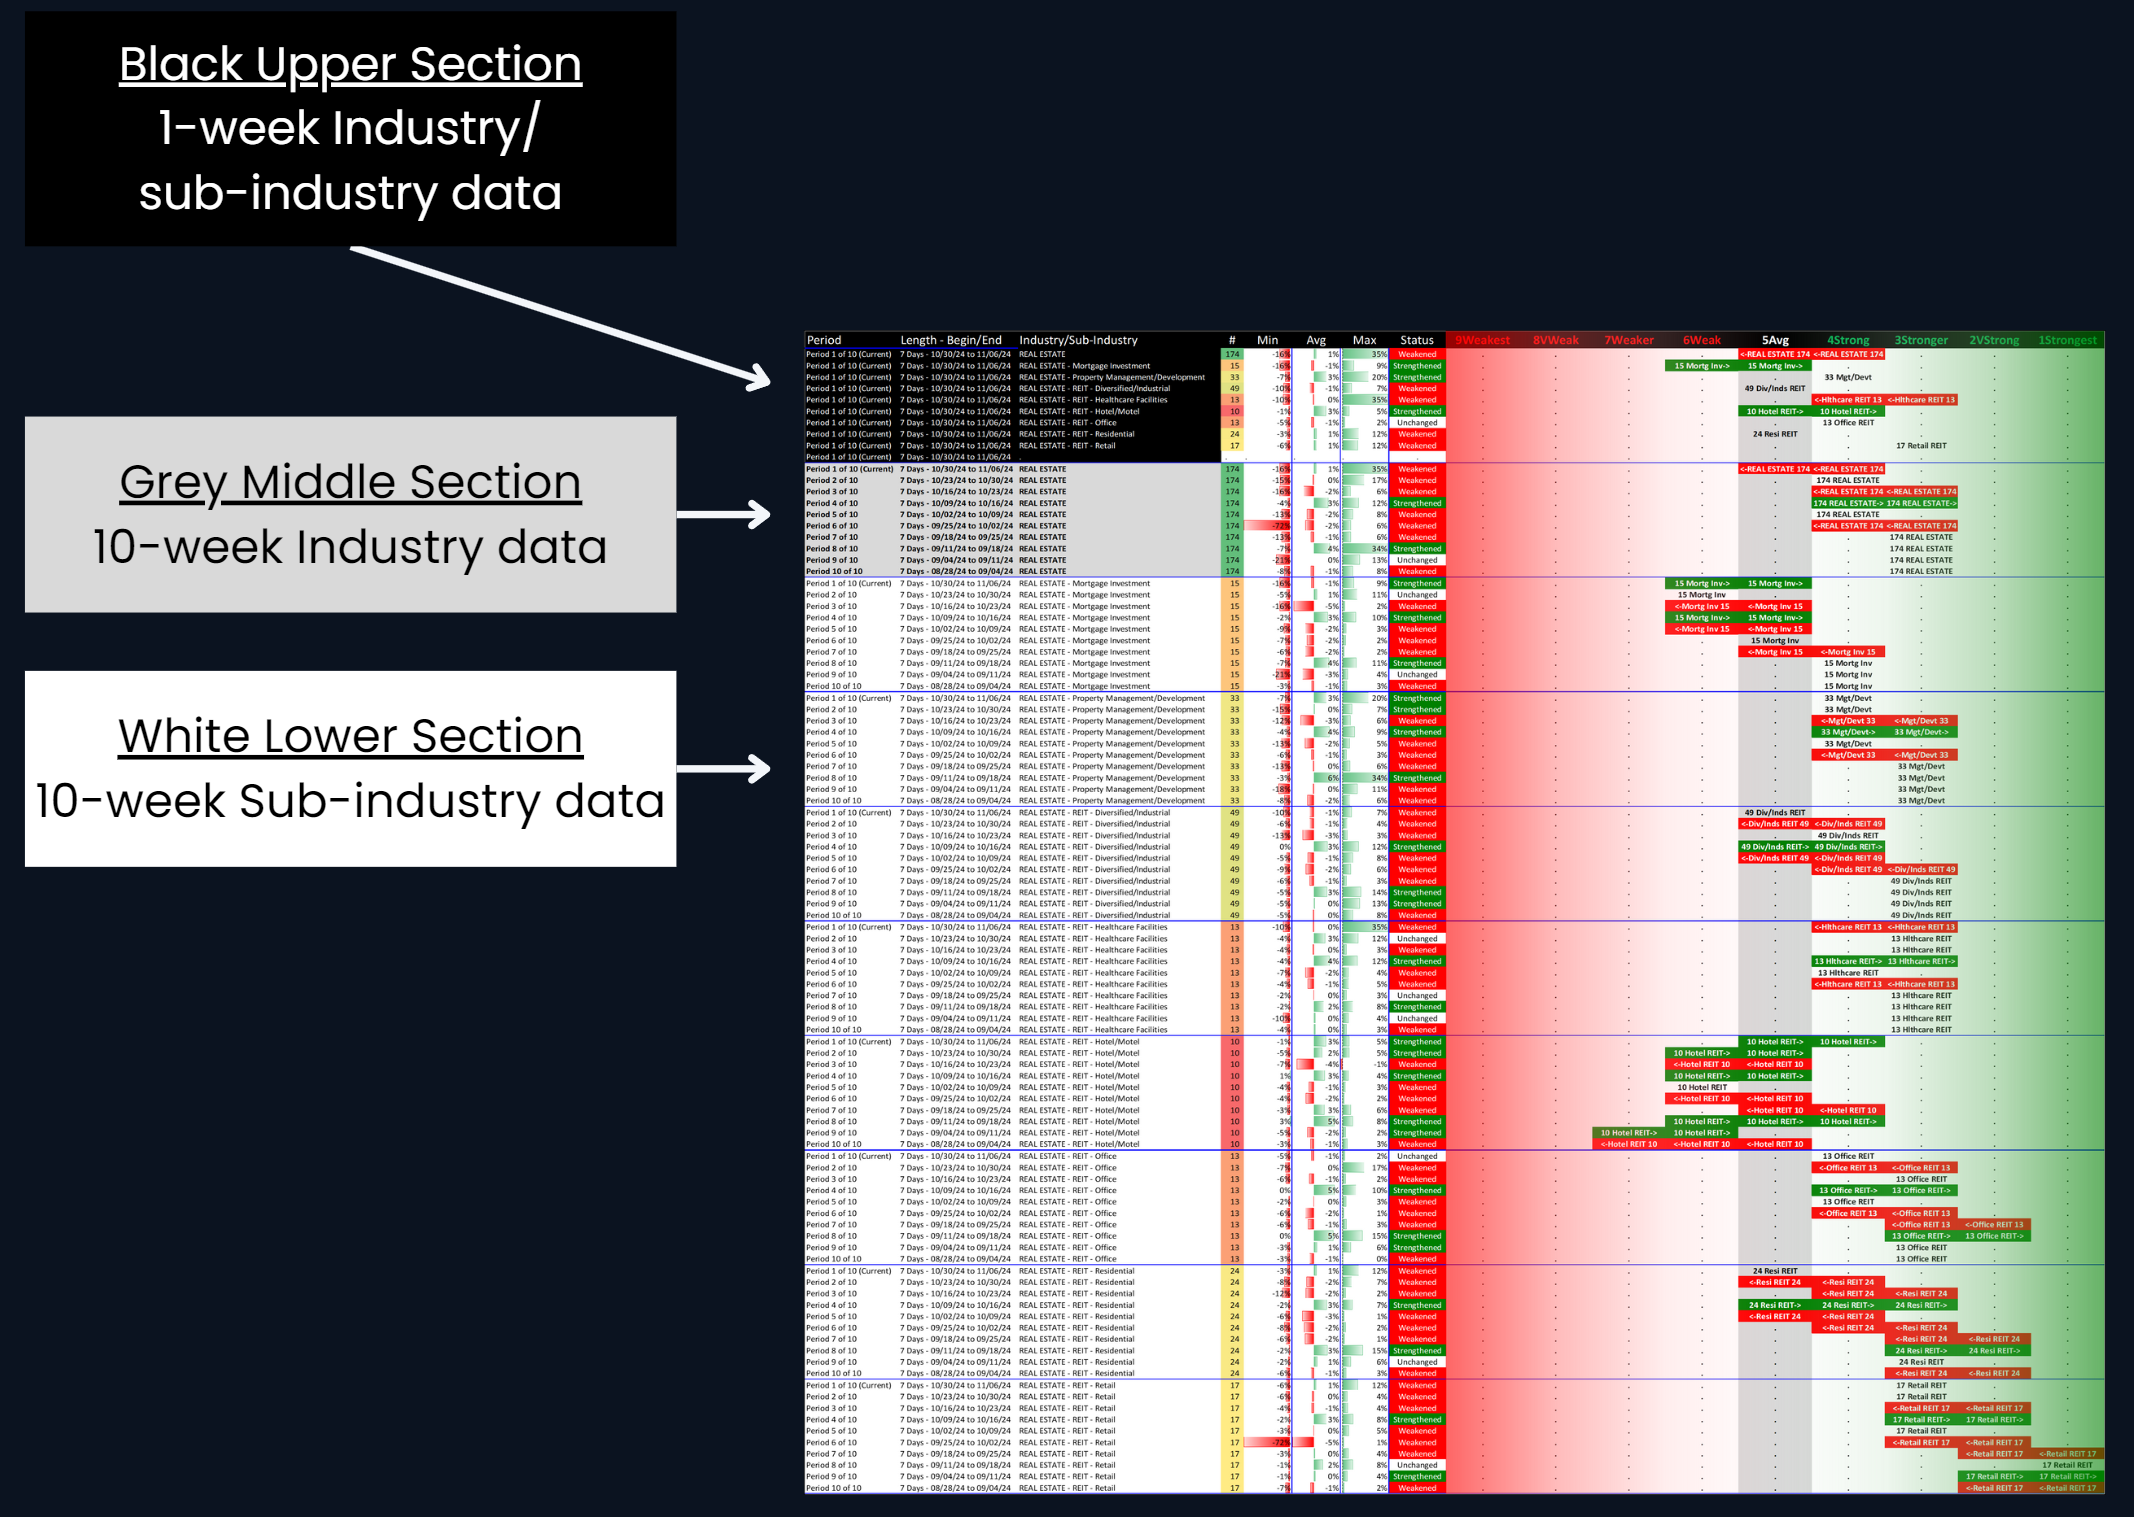
Sector Detail
Section Table of Contents
- Introduction - Industry Components
- INDUSTRY 1-Week Strengthening, Positive/Negative % Stocks
- INDUSTRY 10-Week Strengthening
- SUB-INDUSTRY 10-Week Strengthening
- STOCKS Outliers: Strongest/Weakest Rated
- STOCKS Outliers: 1-Week % Change
- STOCKS Outliers: 5-Year Highs/Lows
1. Introduction - Industry Components
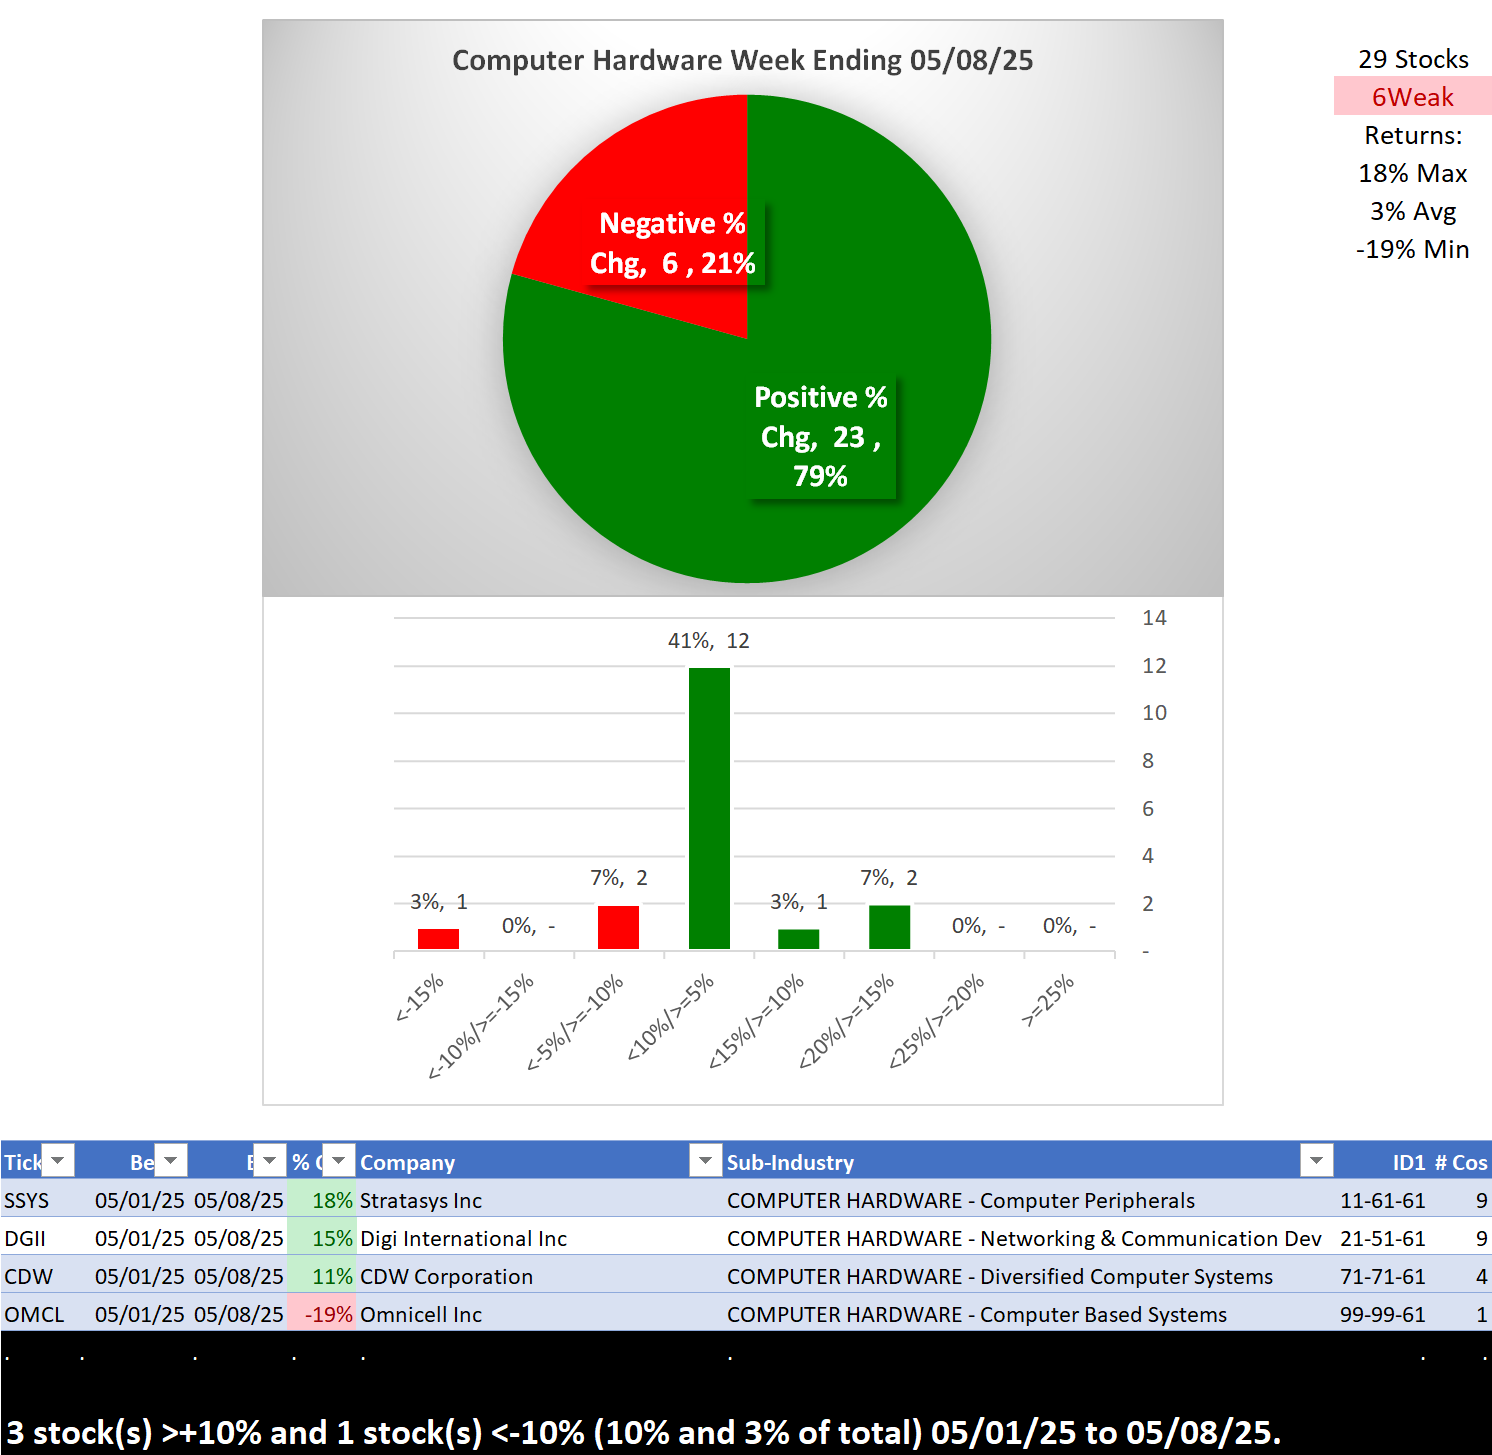
Computer Hardware
Largest of 6 sub-industries (29 stocks, average 5):
- Networking & Communication Dev (9 stocks)
- Computer Peripherals (9 stocks)
Top 10 Market Caps:
AAPL/Apple Inc, CSCO/Cisco Systems Inc, ANET/Arista Networks Inc, PANW/Palo Alto Networks Inc., HPQ/HP Inc, CDW/CDW Corporation, NTAP/Netapp Inc, SMCI/Super Micro Computer Inc, STX/Seagate Technology Holdings PLC, WDC/Western Digital Corp
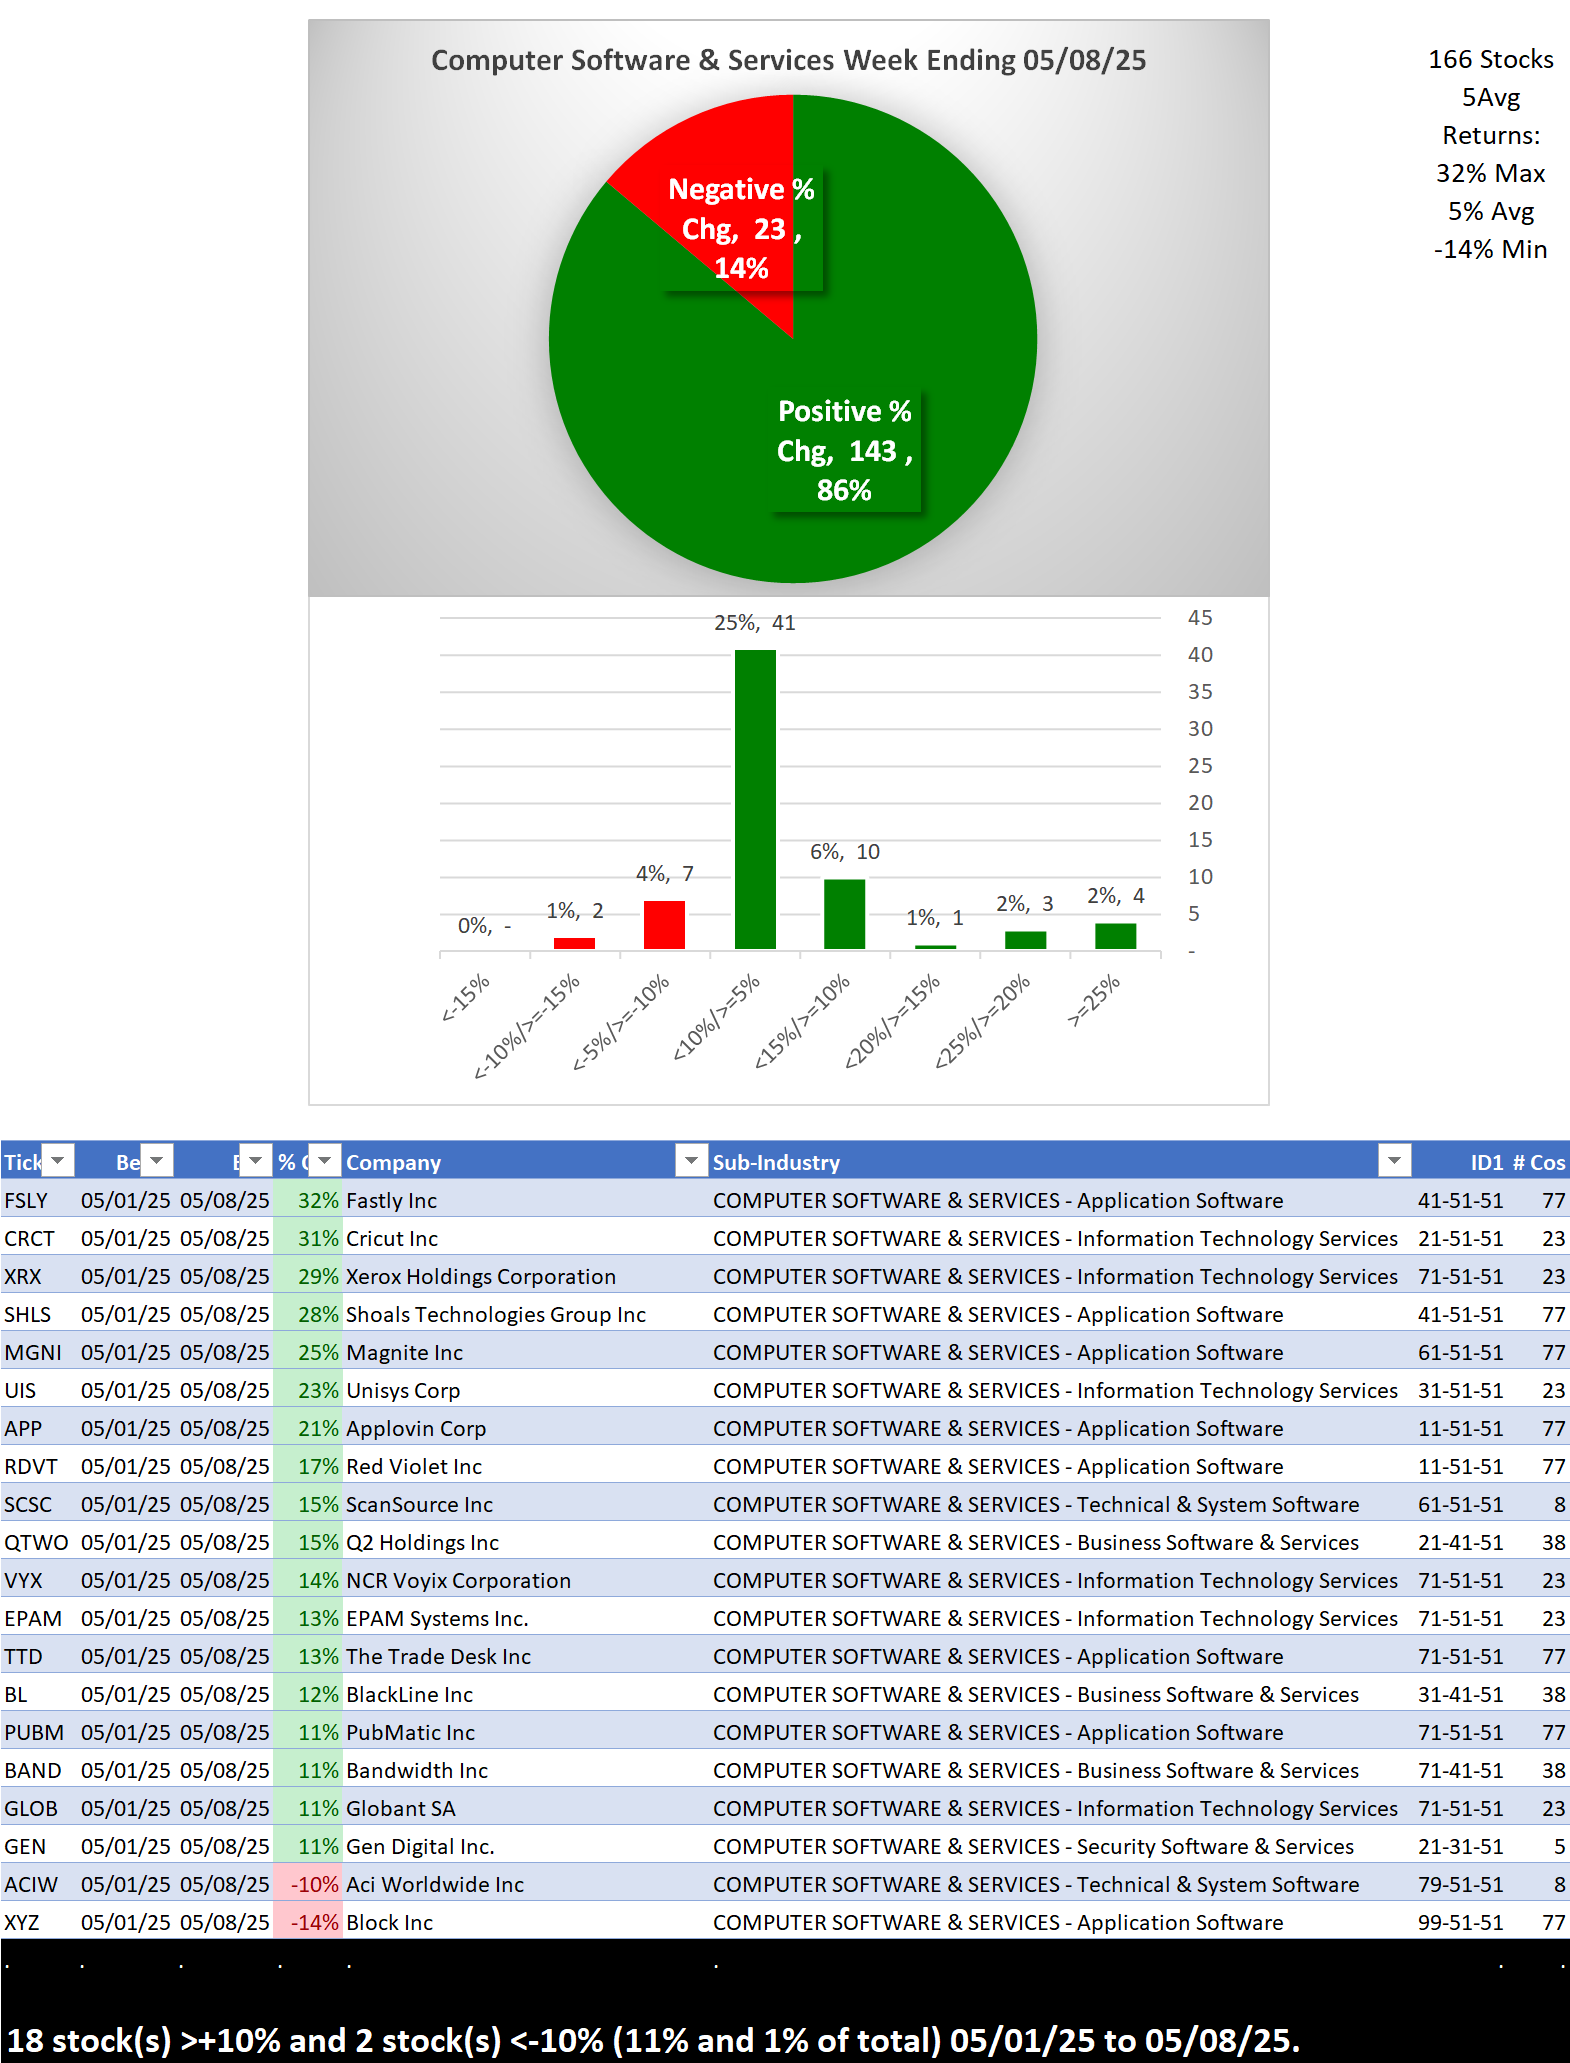
Computer Software & Services
Largest of 8 sub-industries (166 stocks, average 21):
- Application Software (77 stocks)
- Business Computer Software & Services (38 stocks)
- Information Technology Services (23 stocks)
Top 10 Market Caps:
MSFT/Microsoft Corp, ORCL/Oracle Corp, CRM/Salesforce Inc, ACN/Accenture Ltd, ADBE/Adobe Systems Inc, IBM/International Business Machines Corporation, NOW/ServiceNow Inc, INTU/Intuit Inc, UBER/Uber Technologies, ADP/Automatic Data Processing
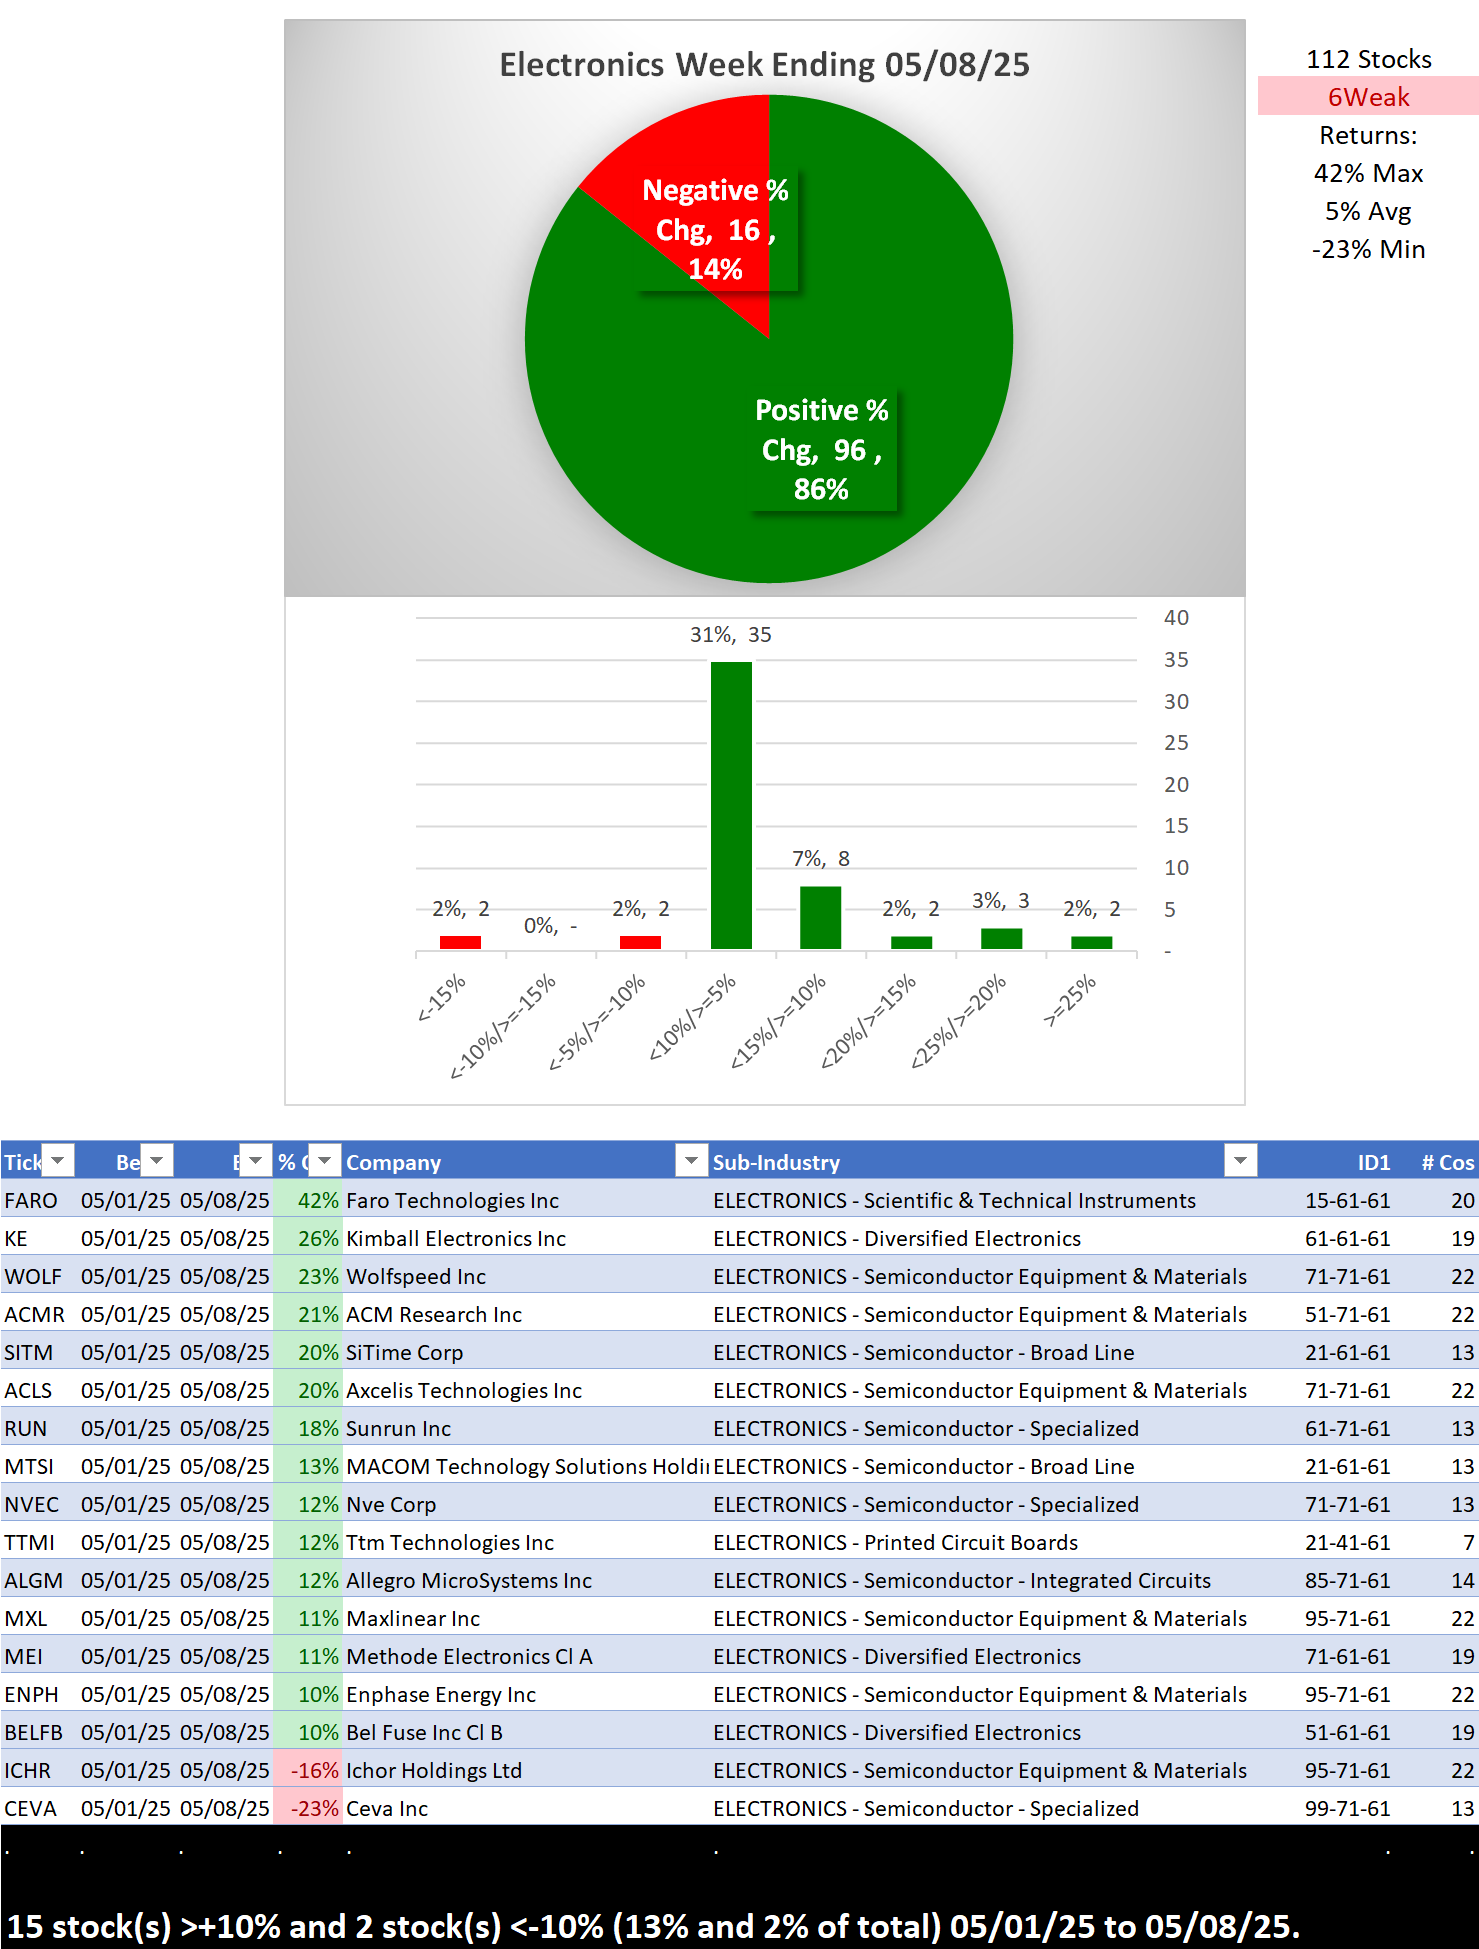
Electronics
Largest of 8 sub-industries (112 stocks, average 14):
- Semiconductor Equipment & Materials (22 stocks)
- Scientific & Technical Instruments (20 stocks)
- Diversified Electronics (19 stocks)
- Semiconductor - Integrated Circuits (14 stocks)
Top 10 Market Caps:
NVDA/NVIDIA Corporation, TSM/Taiwan Semiconductor Manufacturing Company Ltd. ADS, AVGO/Broadcom Inc, AMD/Advanced Micro Devices, TXN/Texas Instruments Inc, AMAT/Applied Materials Inc, ADI/Analog Devices Inc, MU/Micron Technology Inc, KLAC/KLA Corporation, INTC/Intel Corp
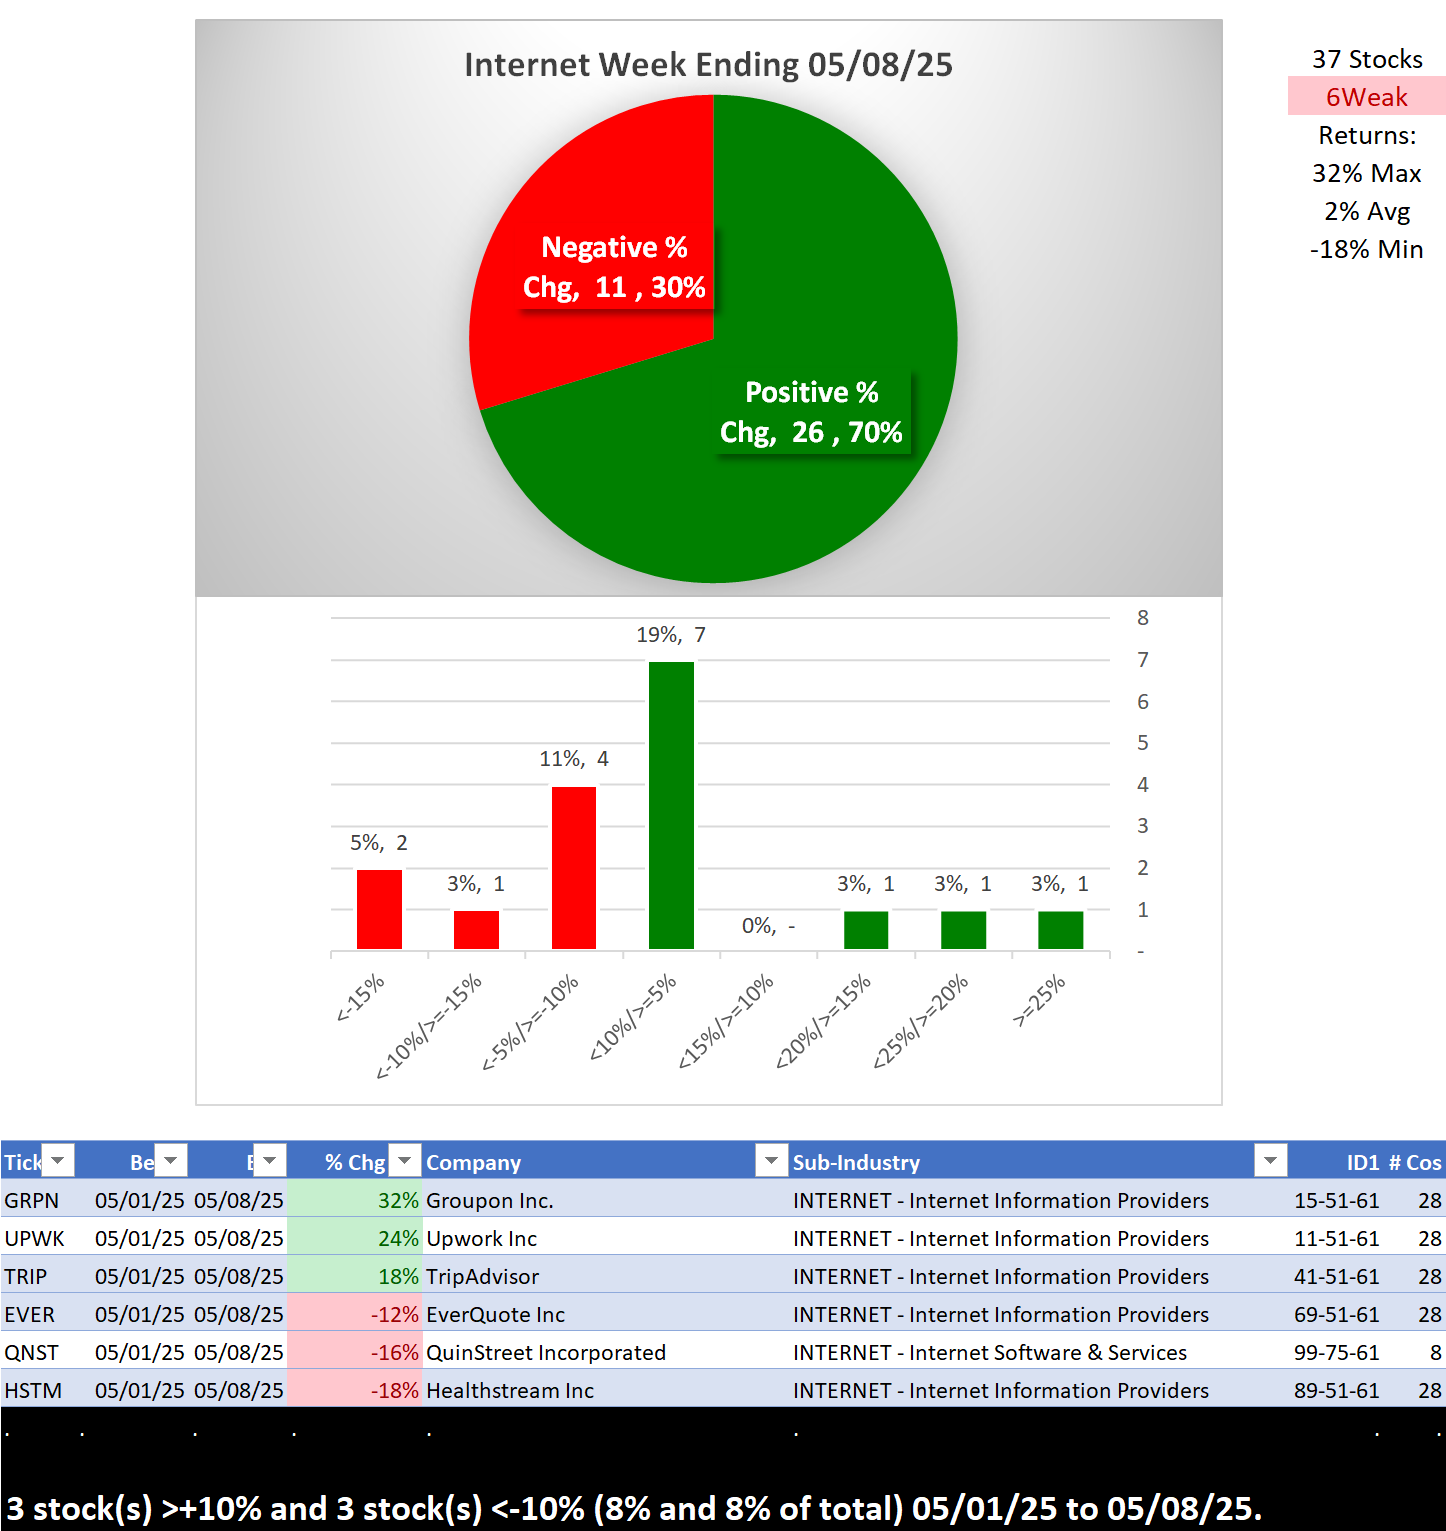
Internet
Largest of 3 sub-industries (37 stocks, average 12):
- Internet Information Providers (28 stocks)
Top 10 Market Caps:
GOOG/Alphabet Inc, META/Meta Platforms Inc, BKNG/Booking Holdings Inc, EQIX/Equinix Inc, DASH/DoorDash Inc, GIB/CGI Group Inc, PINS/Pinterest Inc, GDDY/GoDaddy Inc, ZM/Zoom Video Communications, EXPE/Expedia Inc
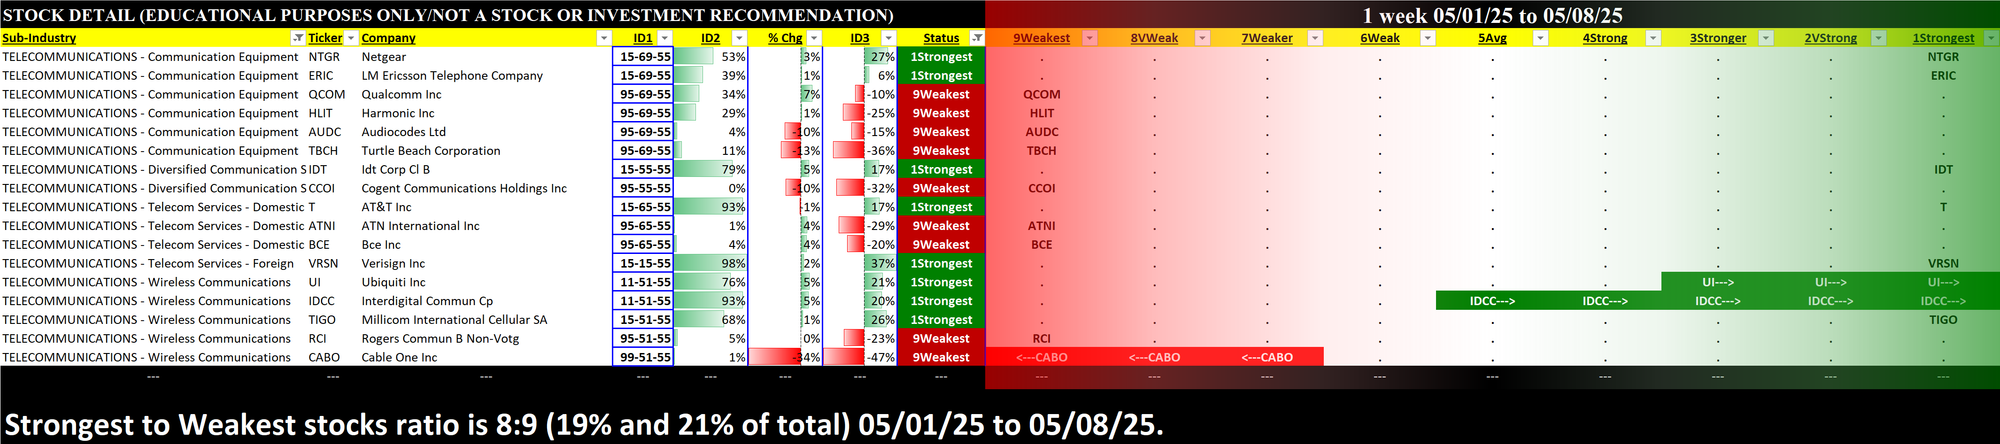
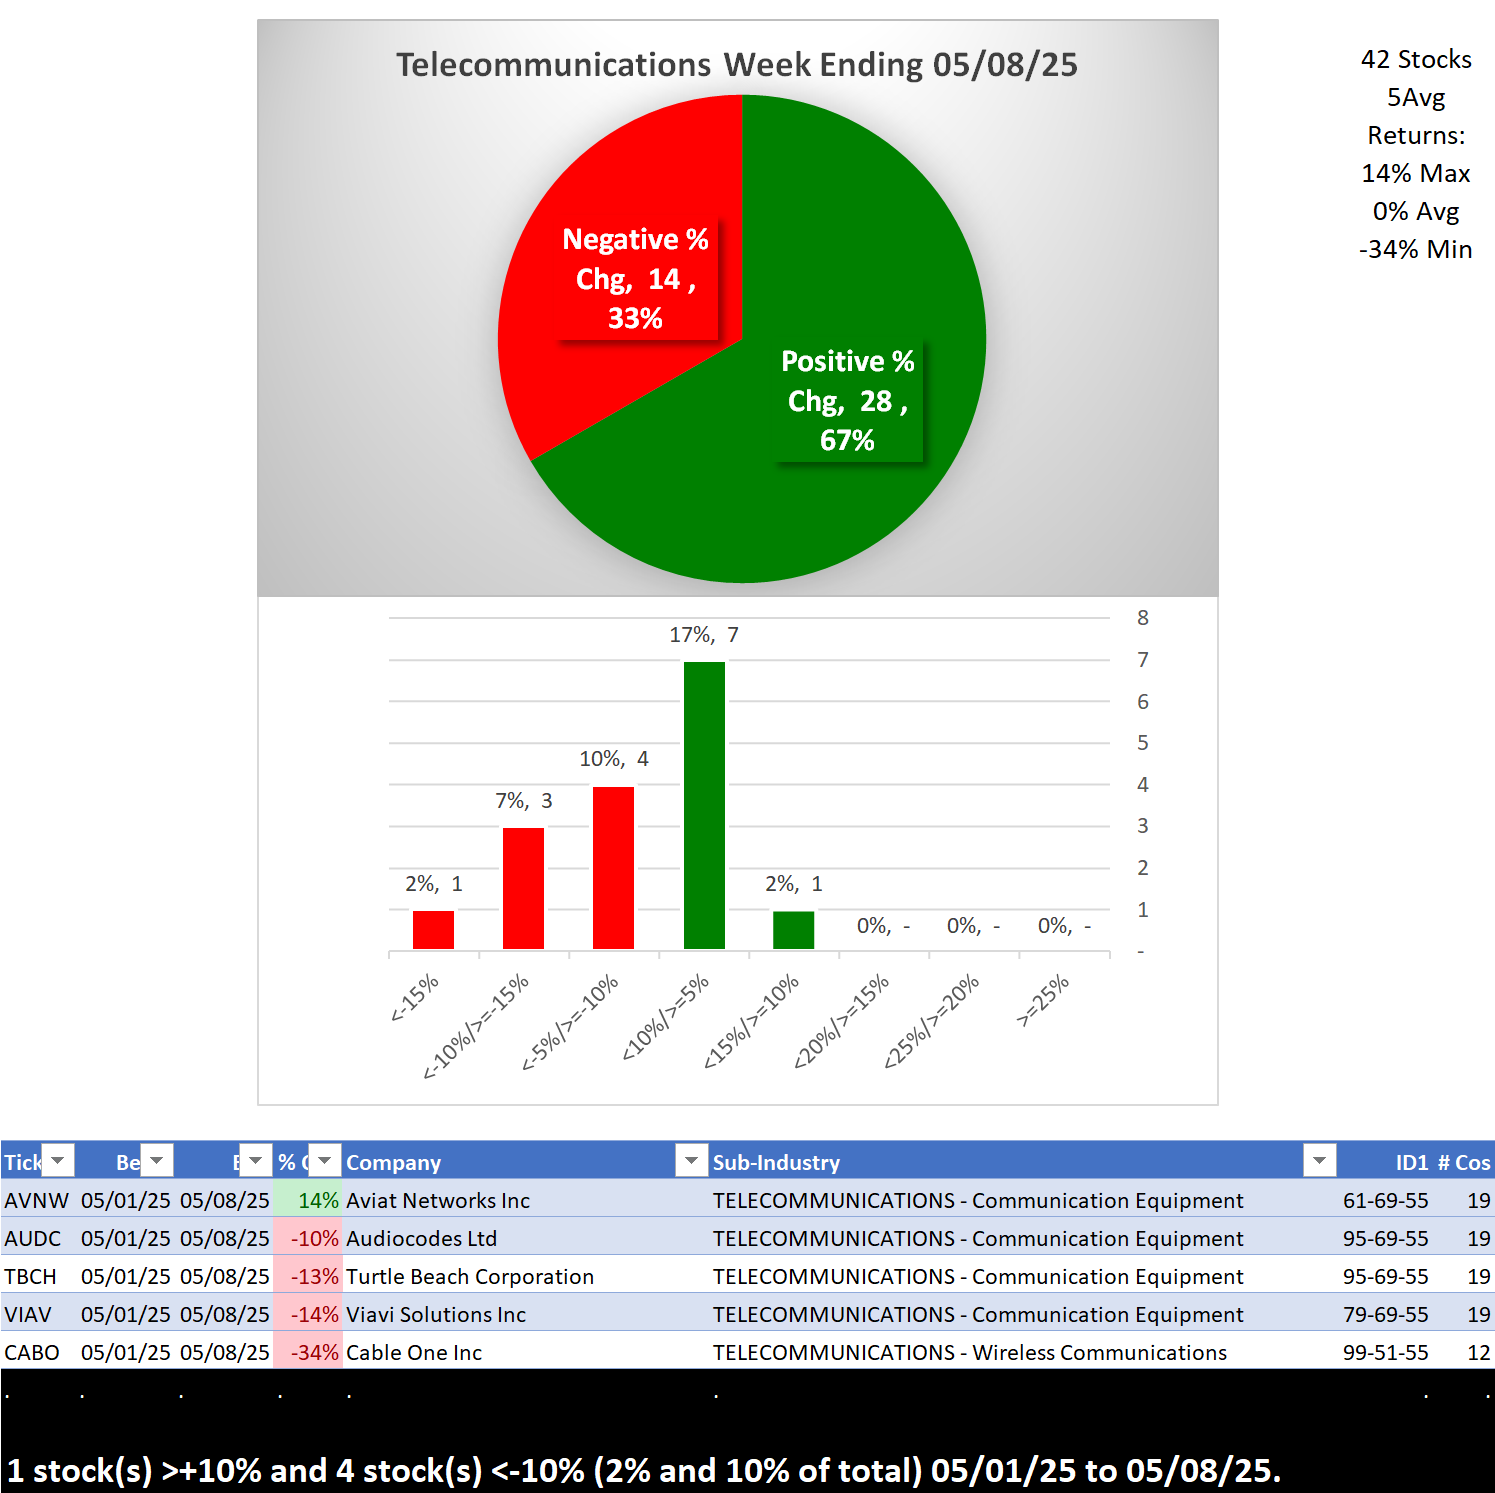
Telecommunications
Largest of 5 sub-industries (42 stocks, average 9):
- Communication Equipment (20 stocks)
- Wireless Communications (12 stocks)
Top 10 Market Caps:
TMUS/T-Mobile US Inc., VZ/Verizon Communications, QCOM/Qualcomm Inc, T/AT&T Inc, MSI/Motorola Solutions Inc, CCI/Crown Castle Intl Corp, LHX/L3Harris Technologies Inc, BCE/BCE Inc, ERIC/LM Ericsson Telephone Company, TU/Telus Corporation
2. INDUSTRY 1-Week Strengthening
Overview
What: A closer 1-week look at industry and sub-industry strengthening
Why: a multi-month rally begins with one up week. Meaningful moves last and can last longer than expected.
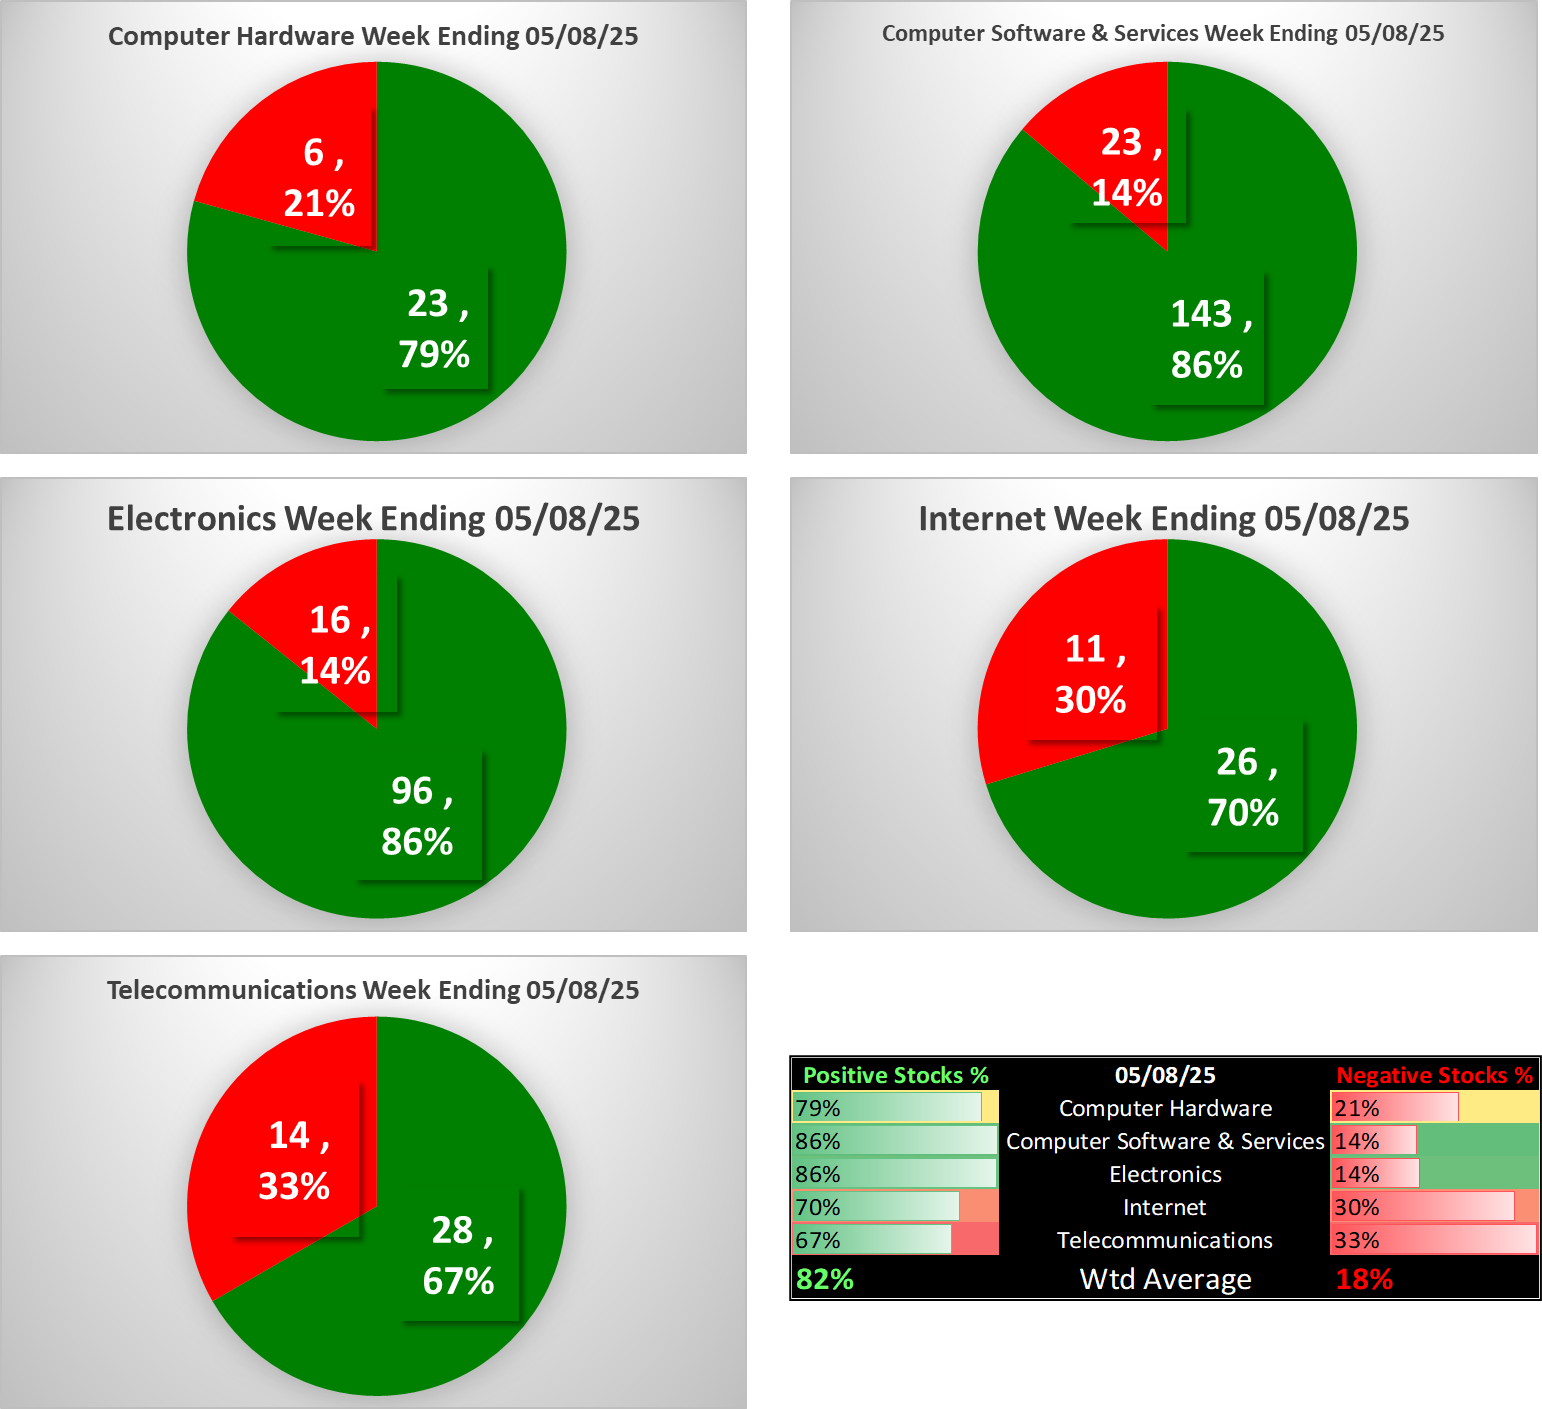
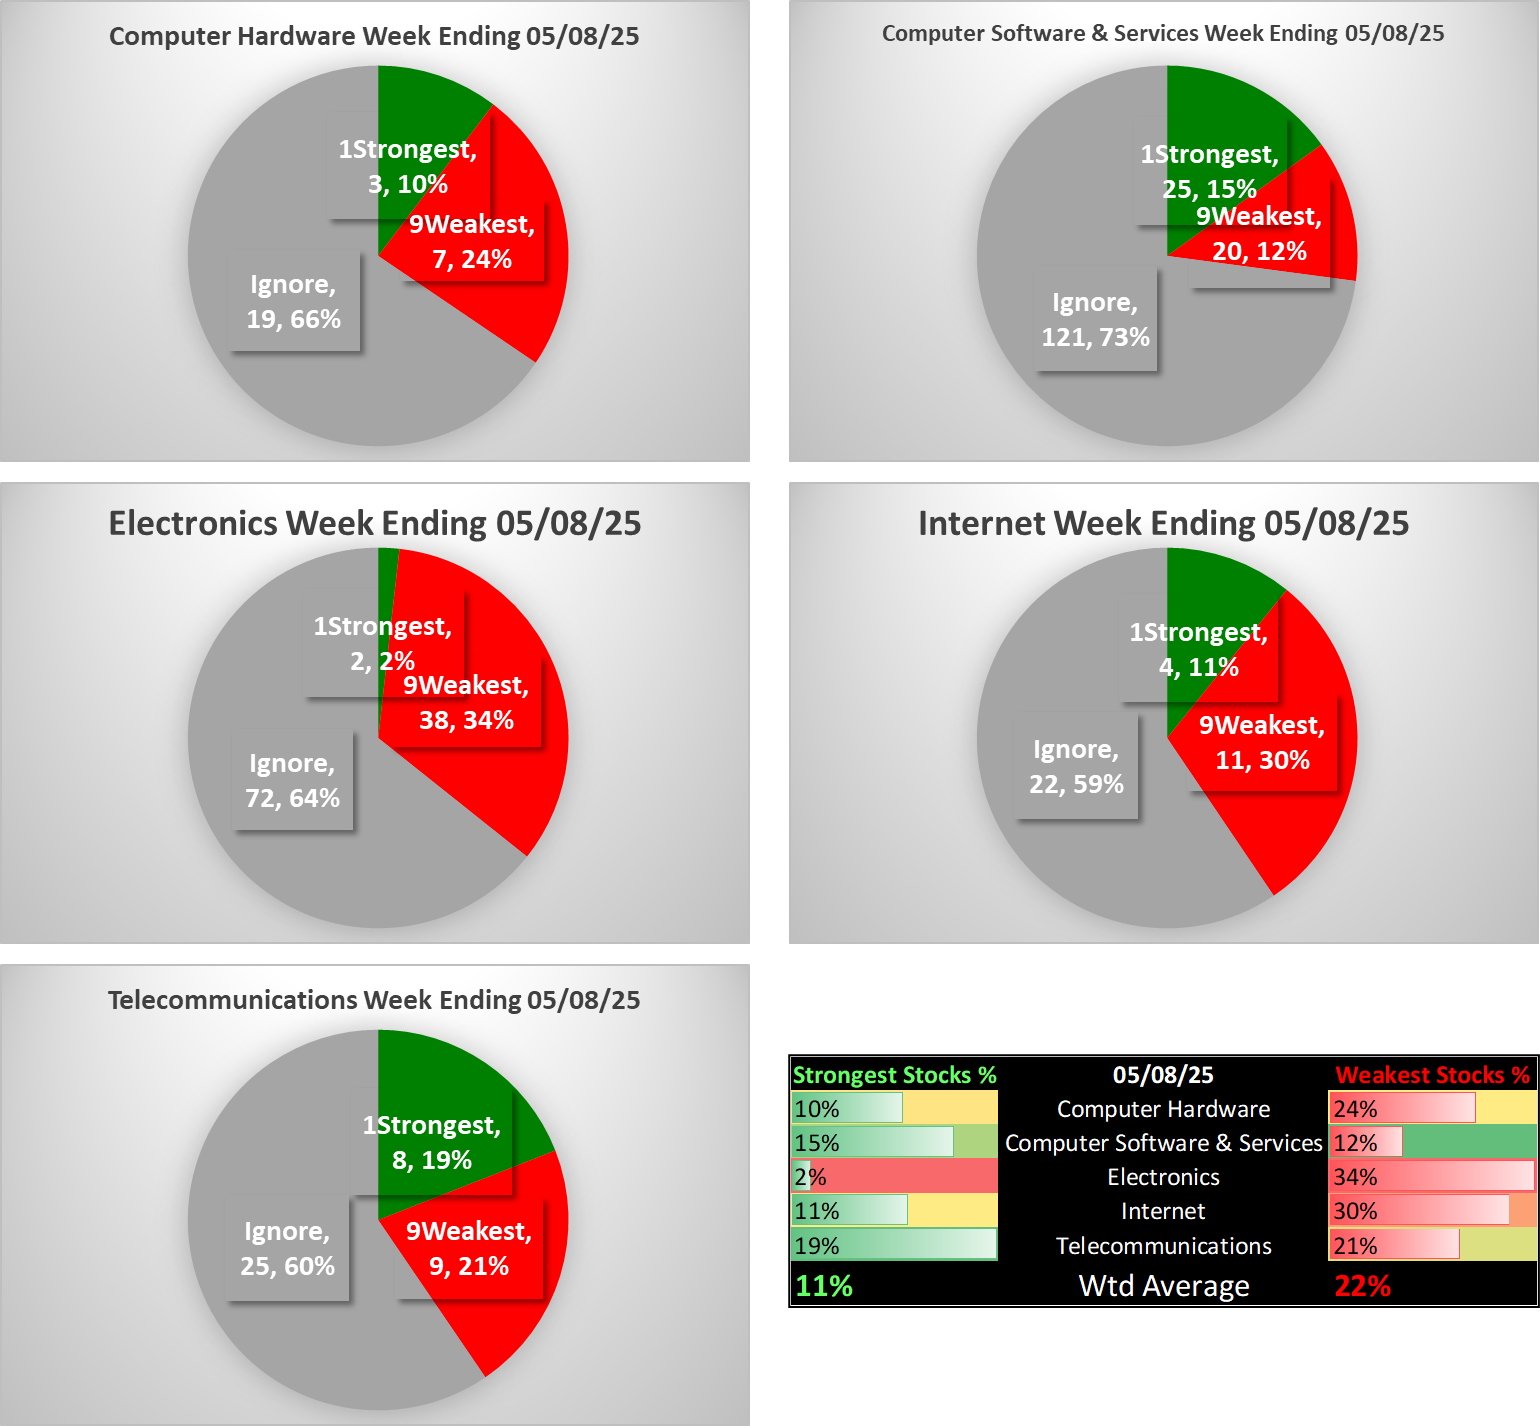
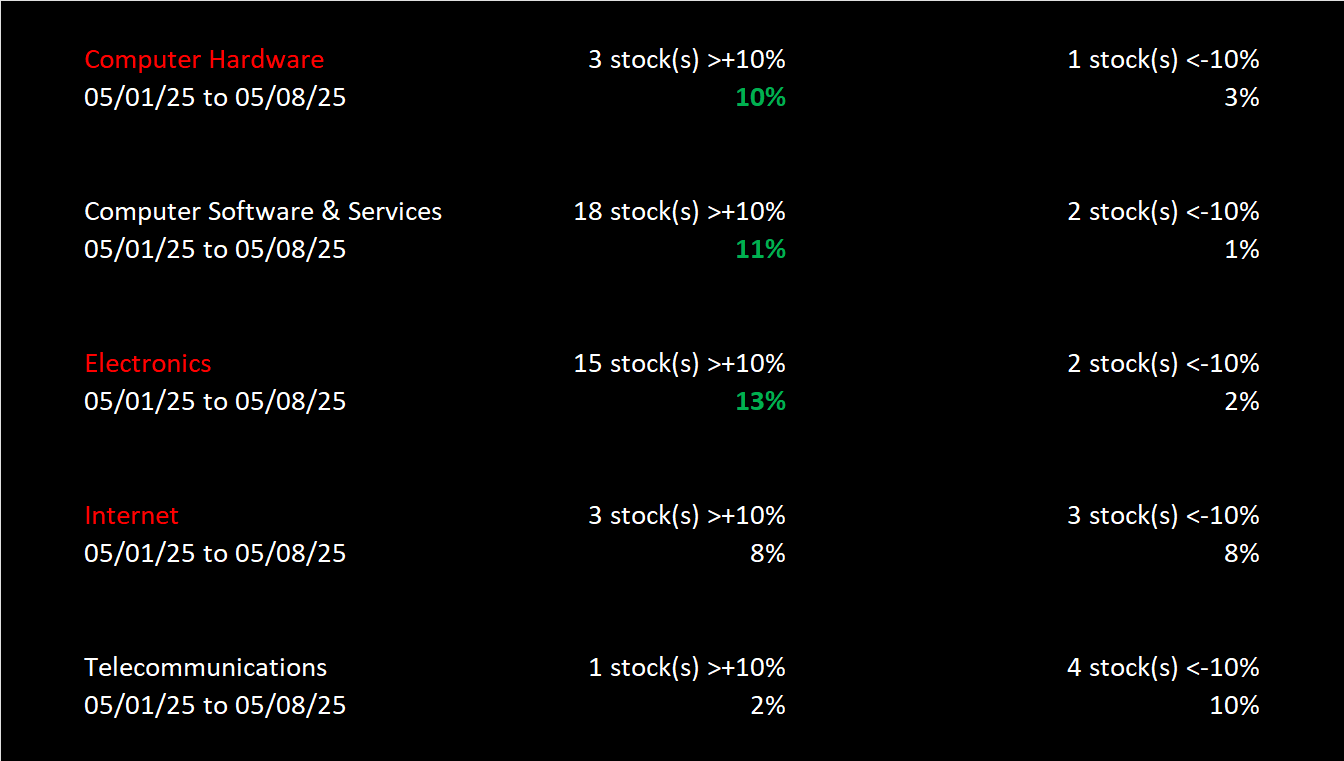
Positive/Negative % Stocks
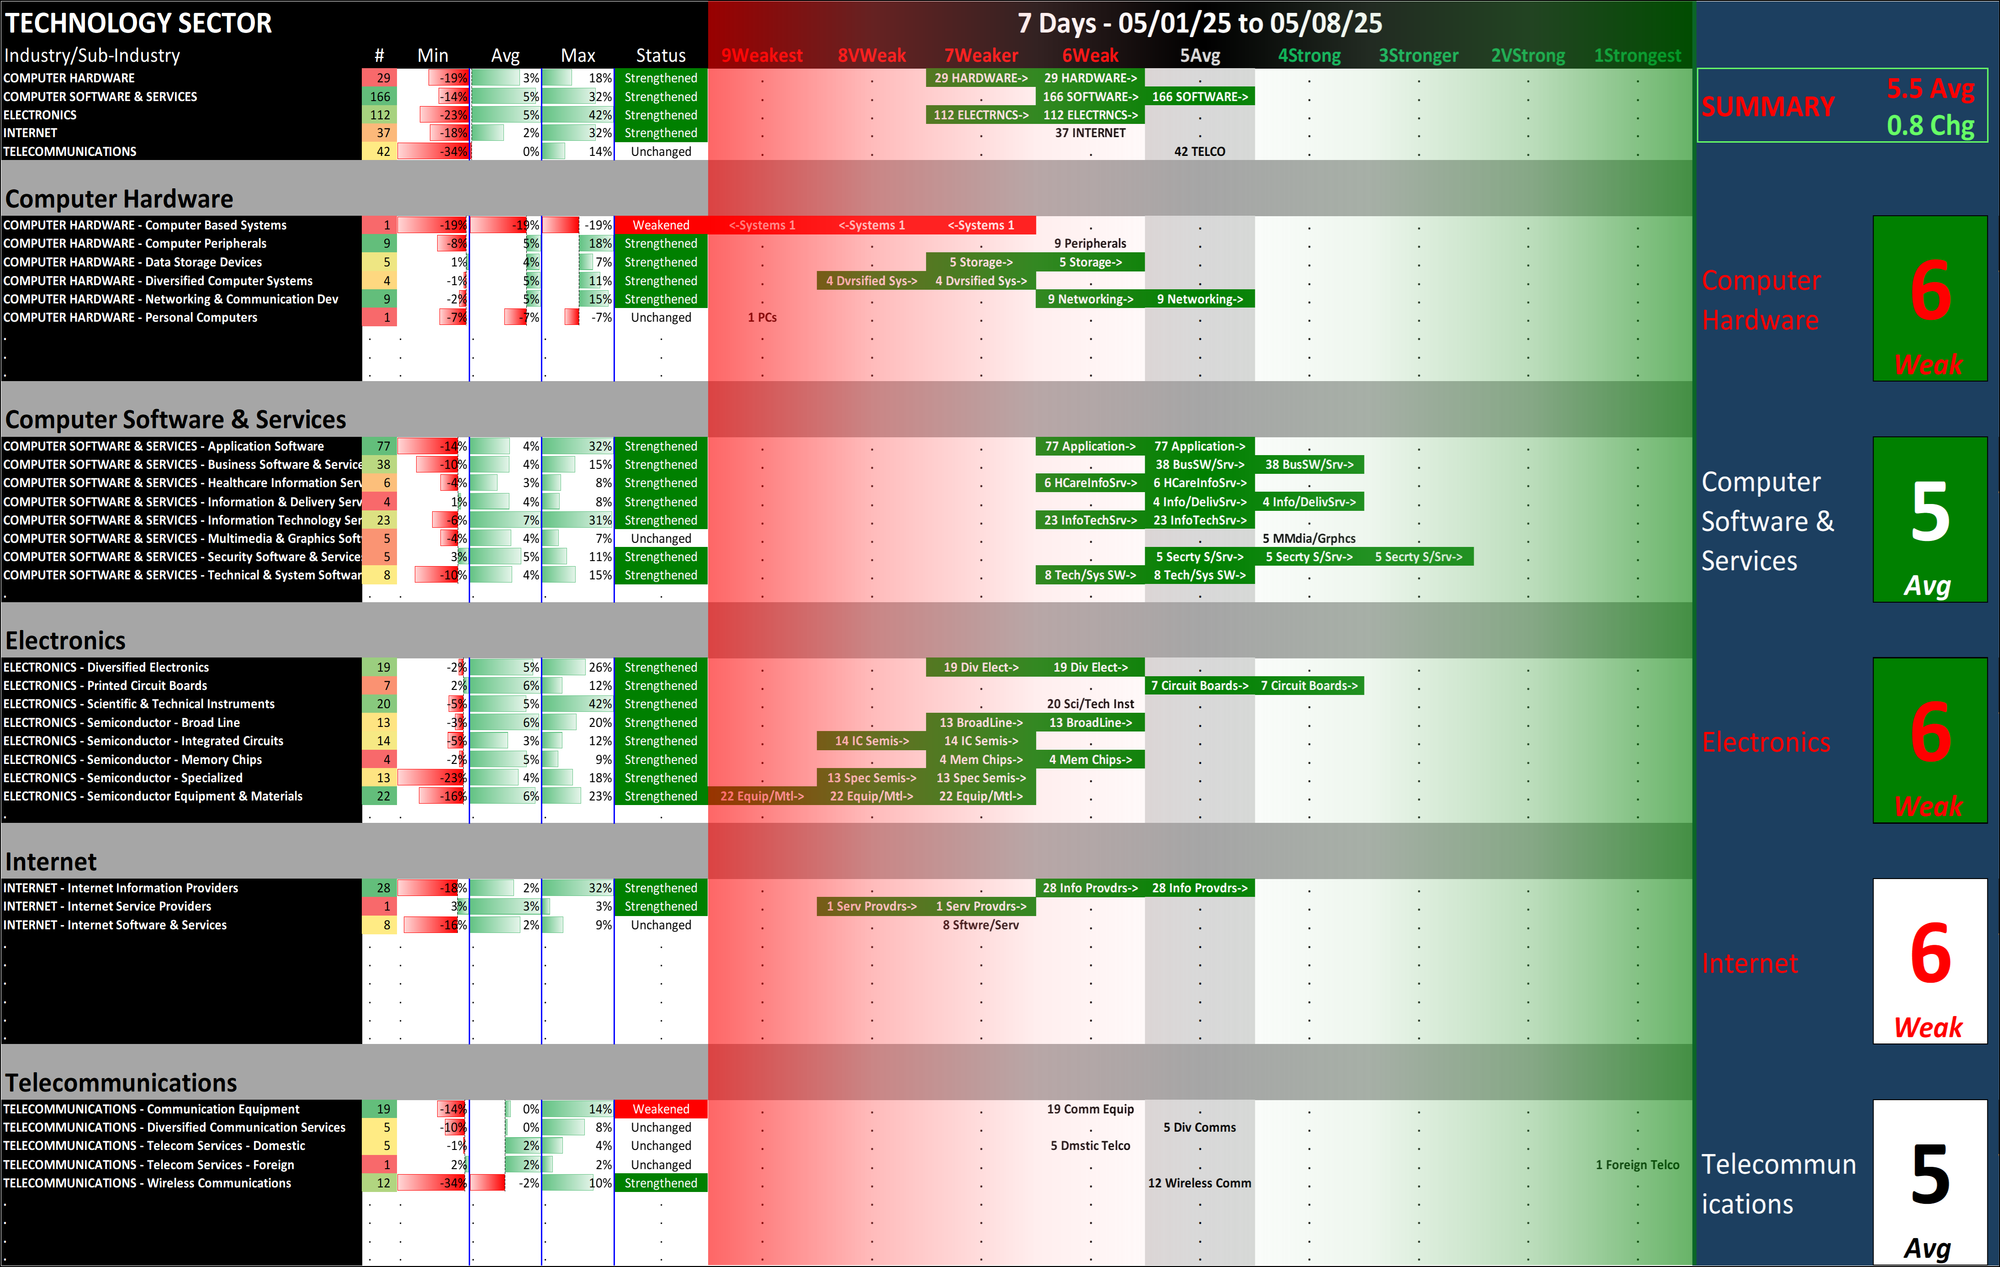
3. INDUSTRY 10-Week Strengthening
Overview
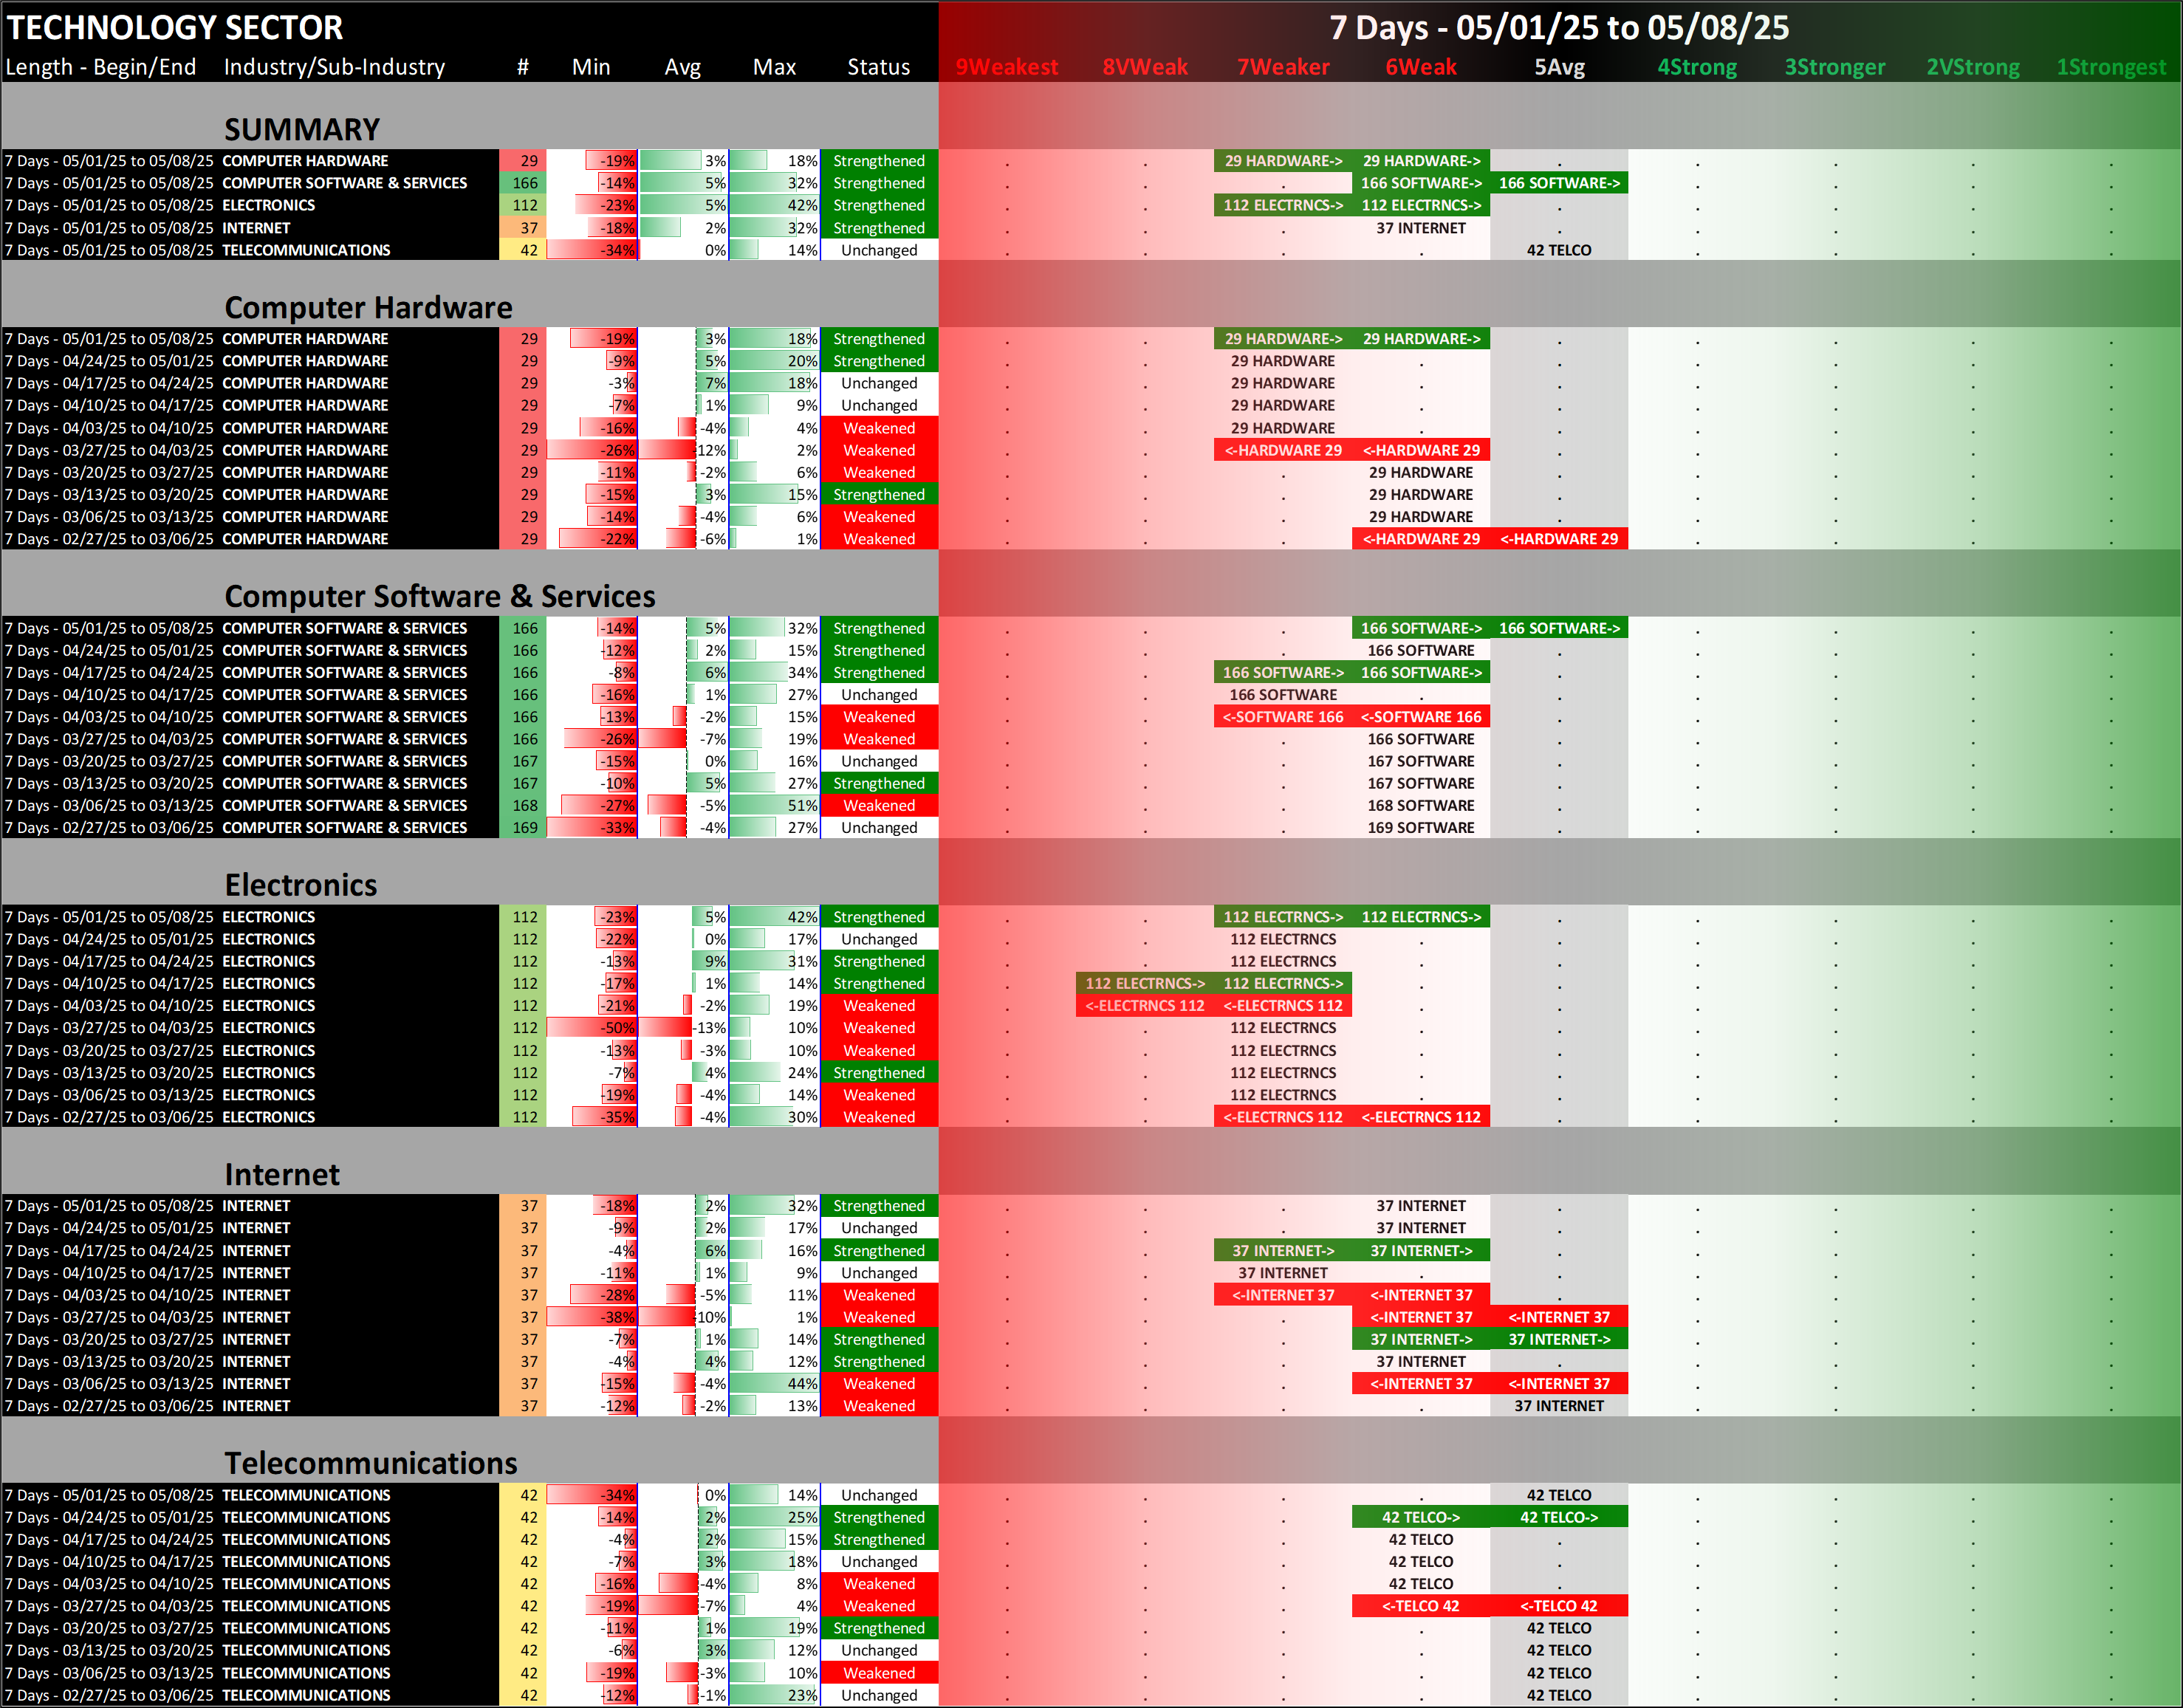
What: A comparative 10-week look at industry strengthening
Why: clearly and quickly understand where there is strengthening and weakening over a relevant time frame
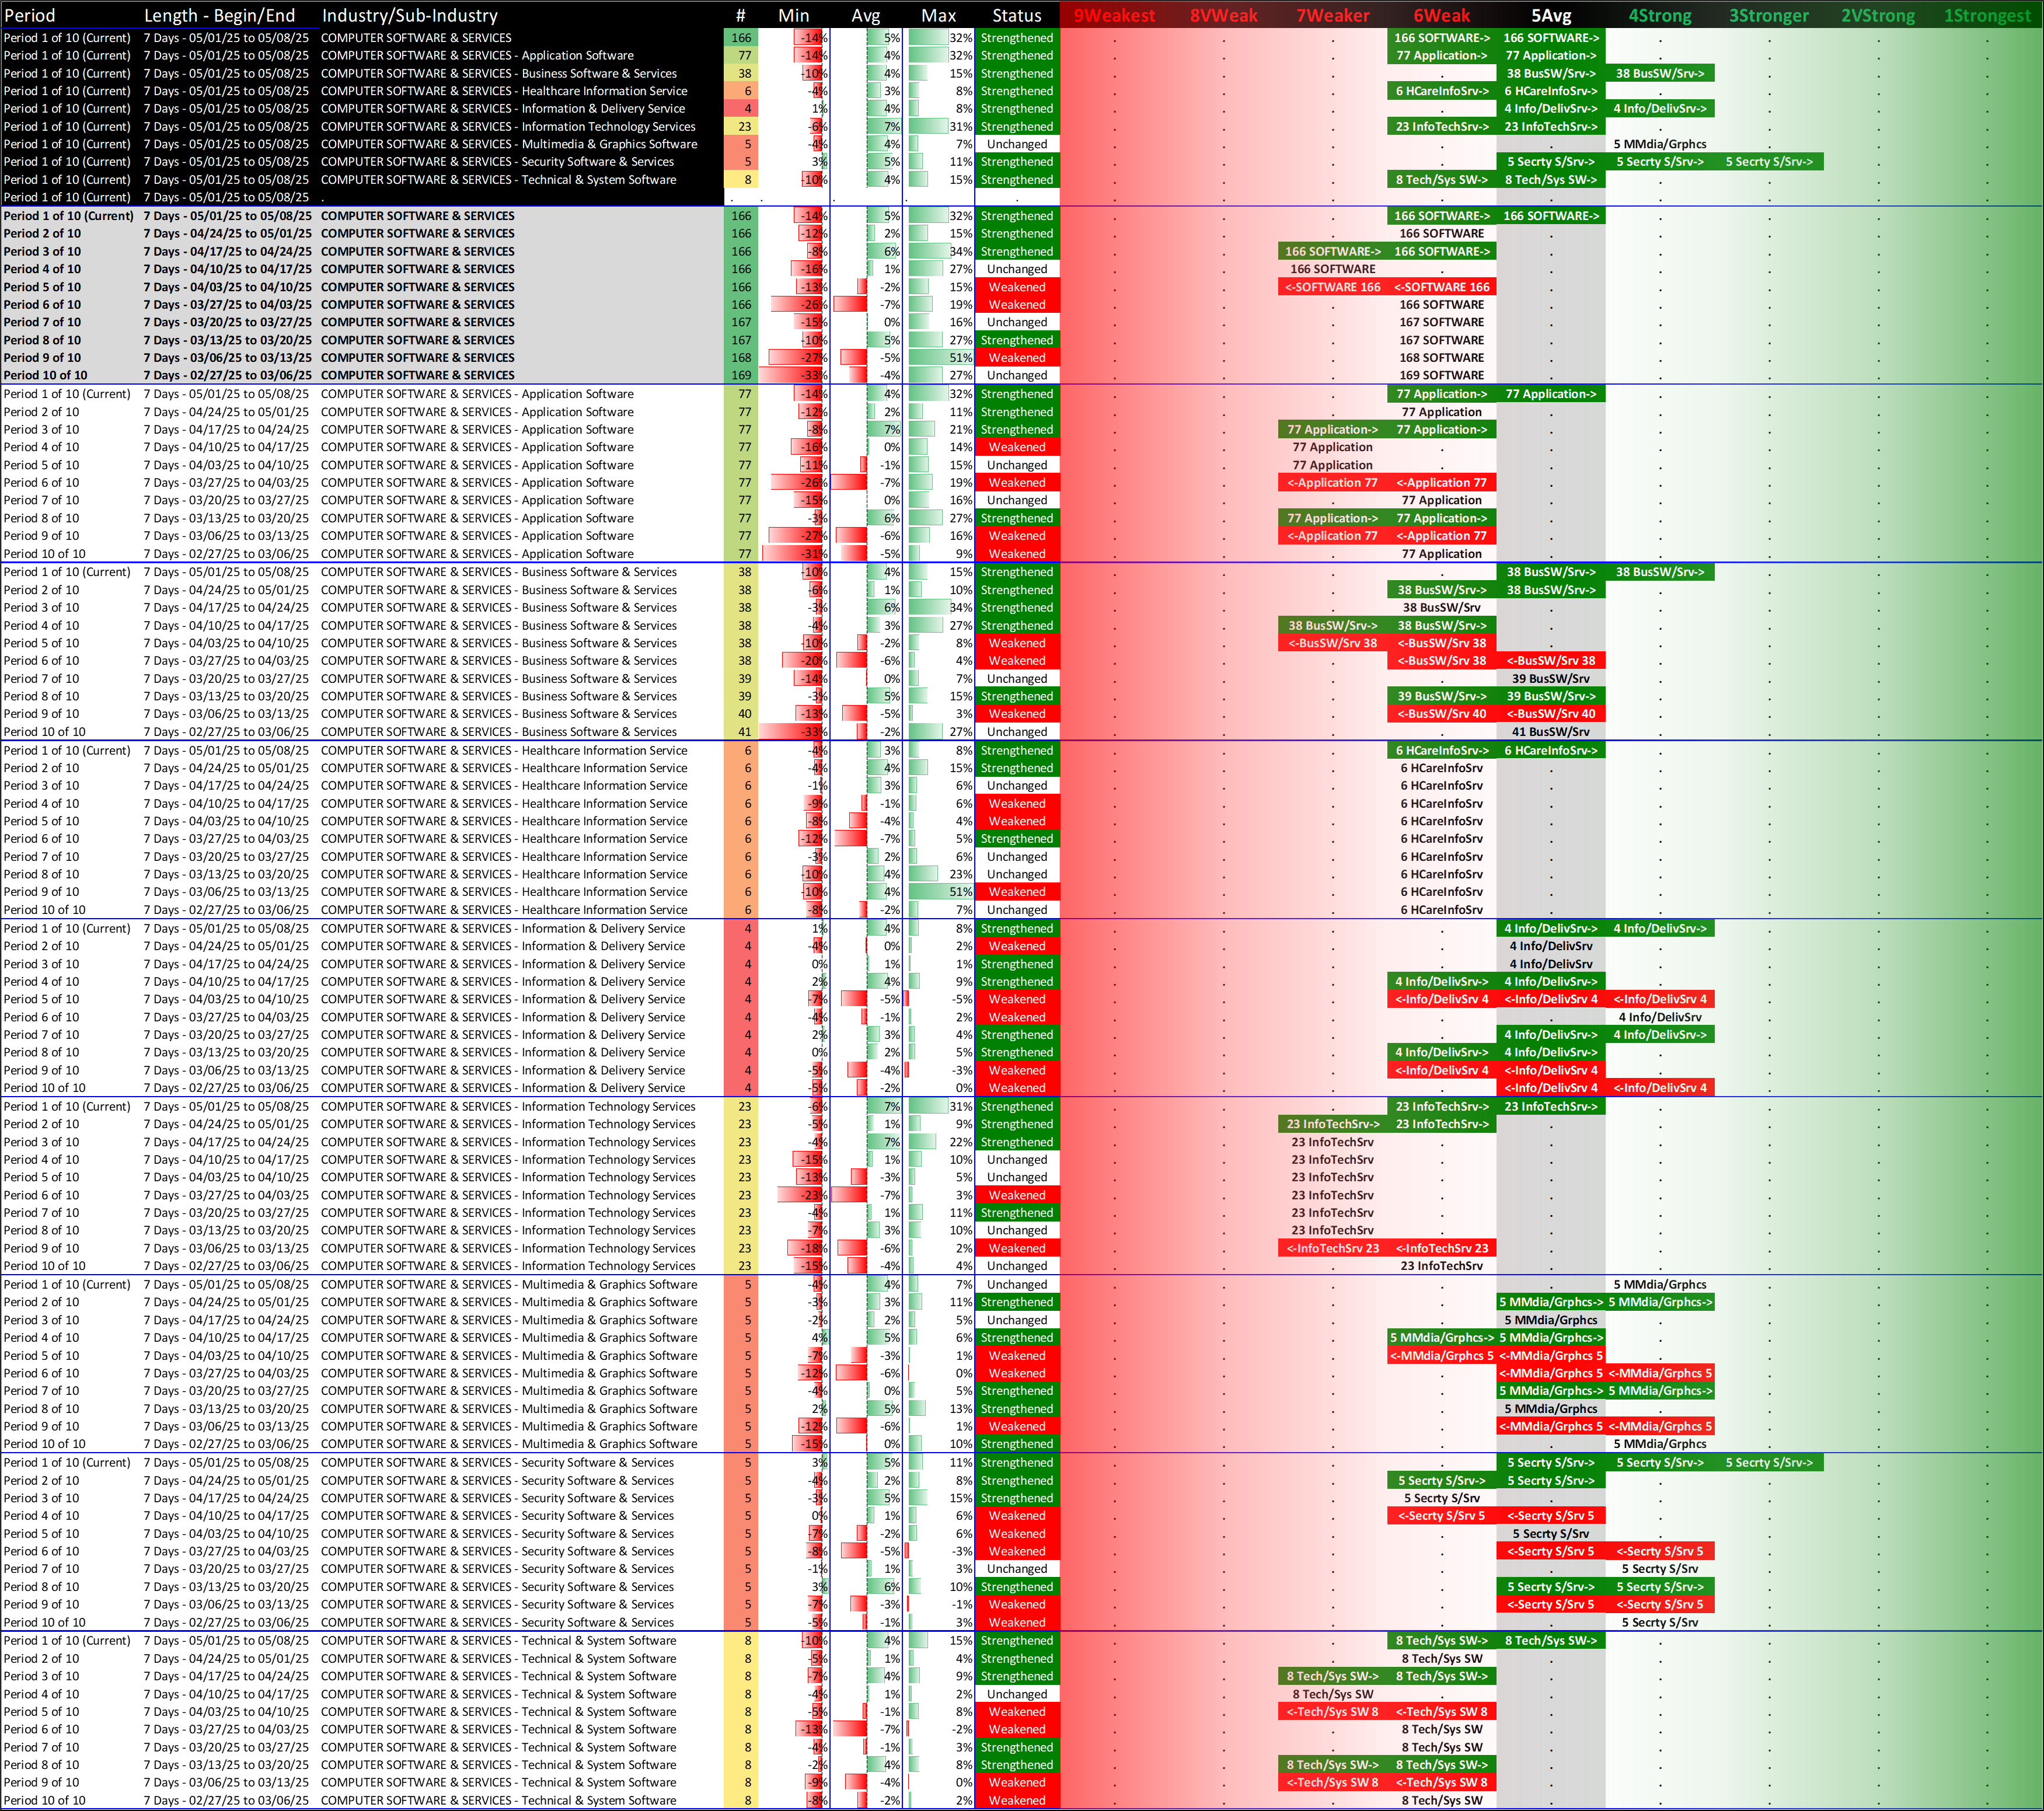
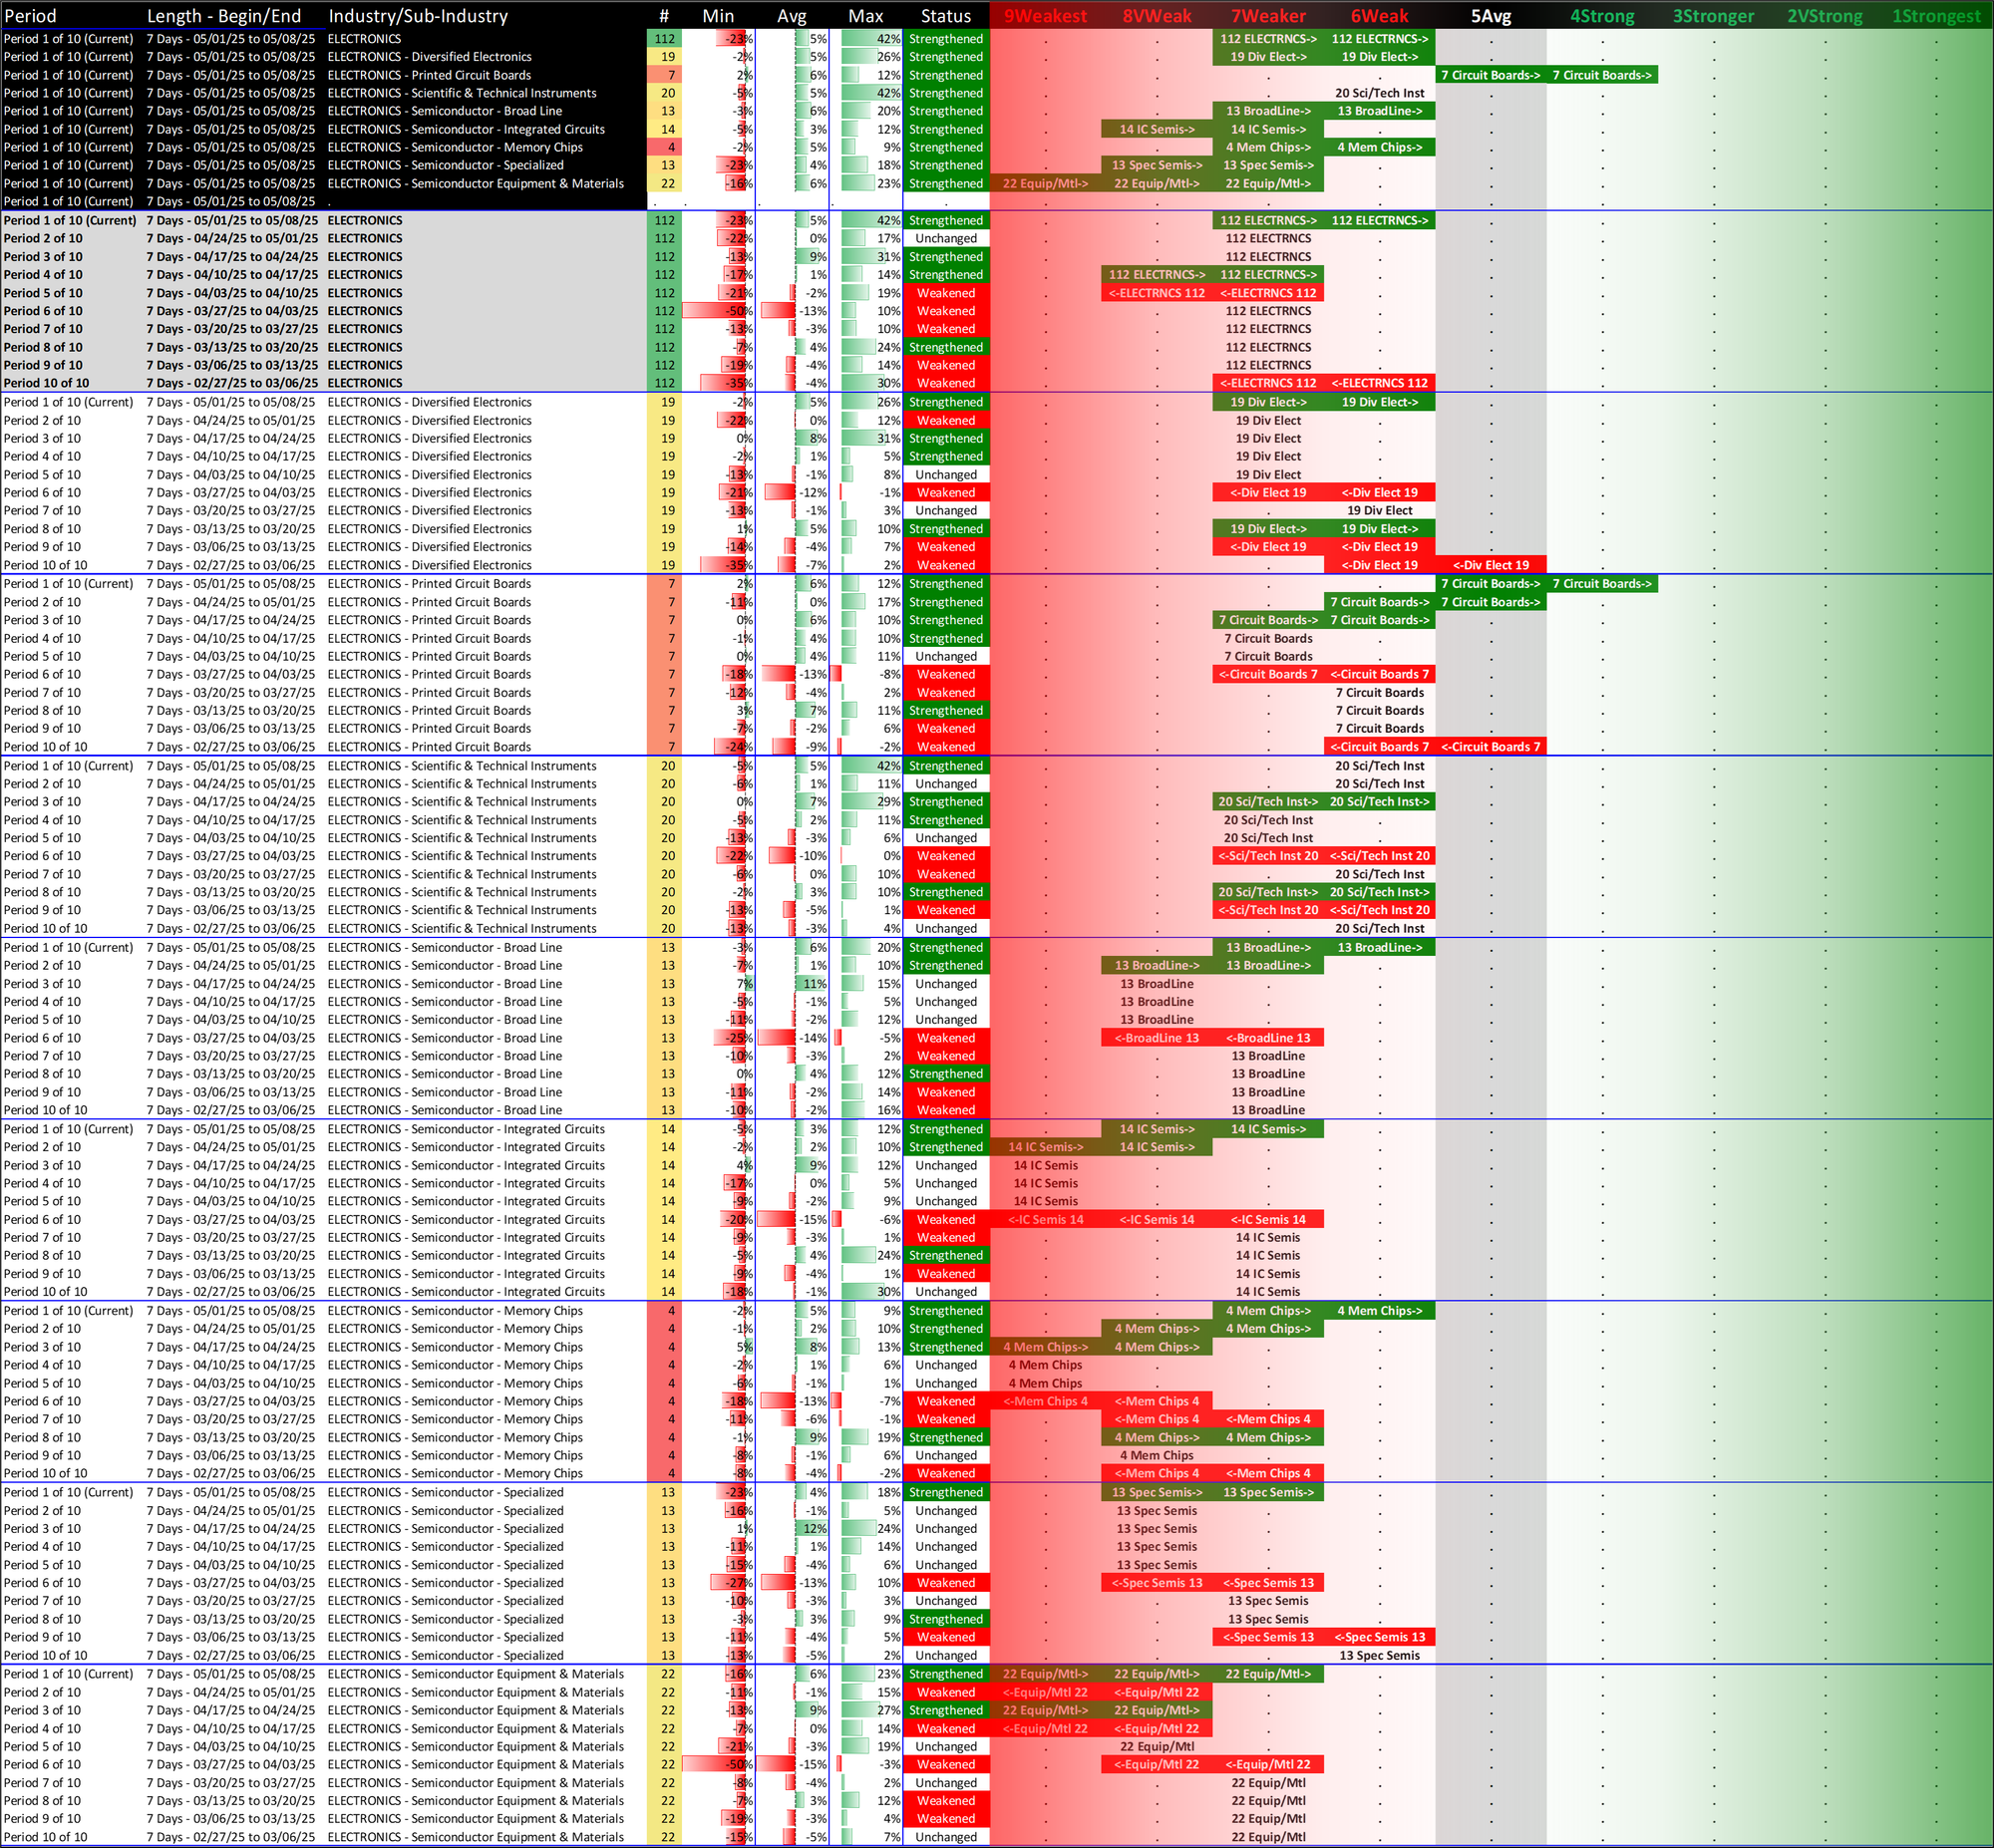
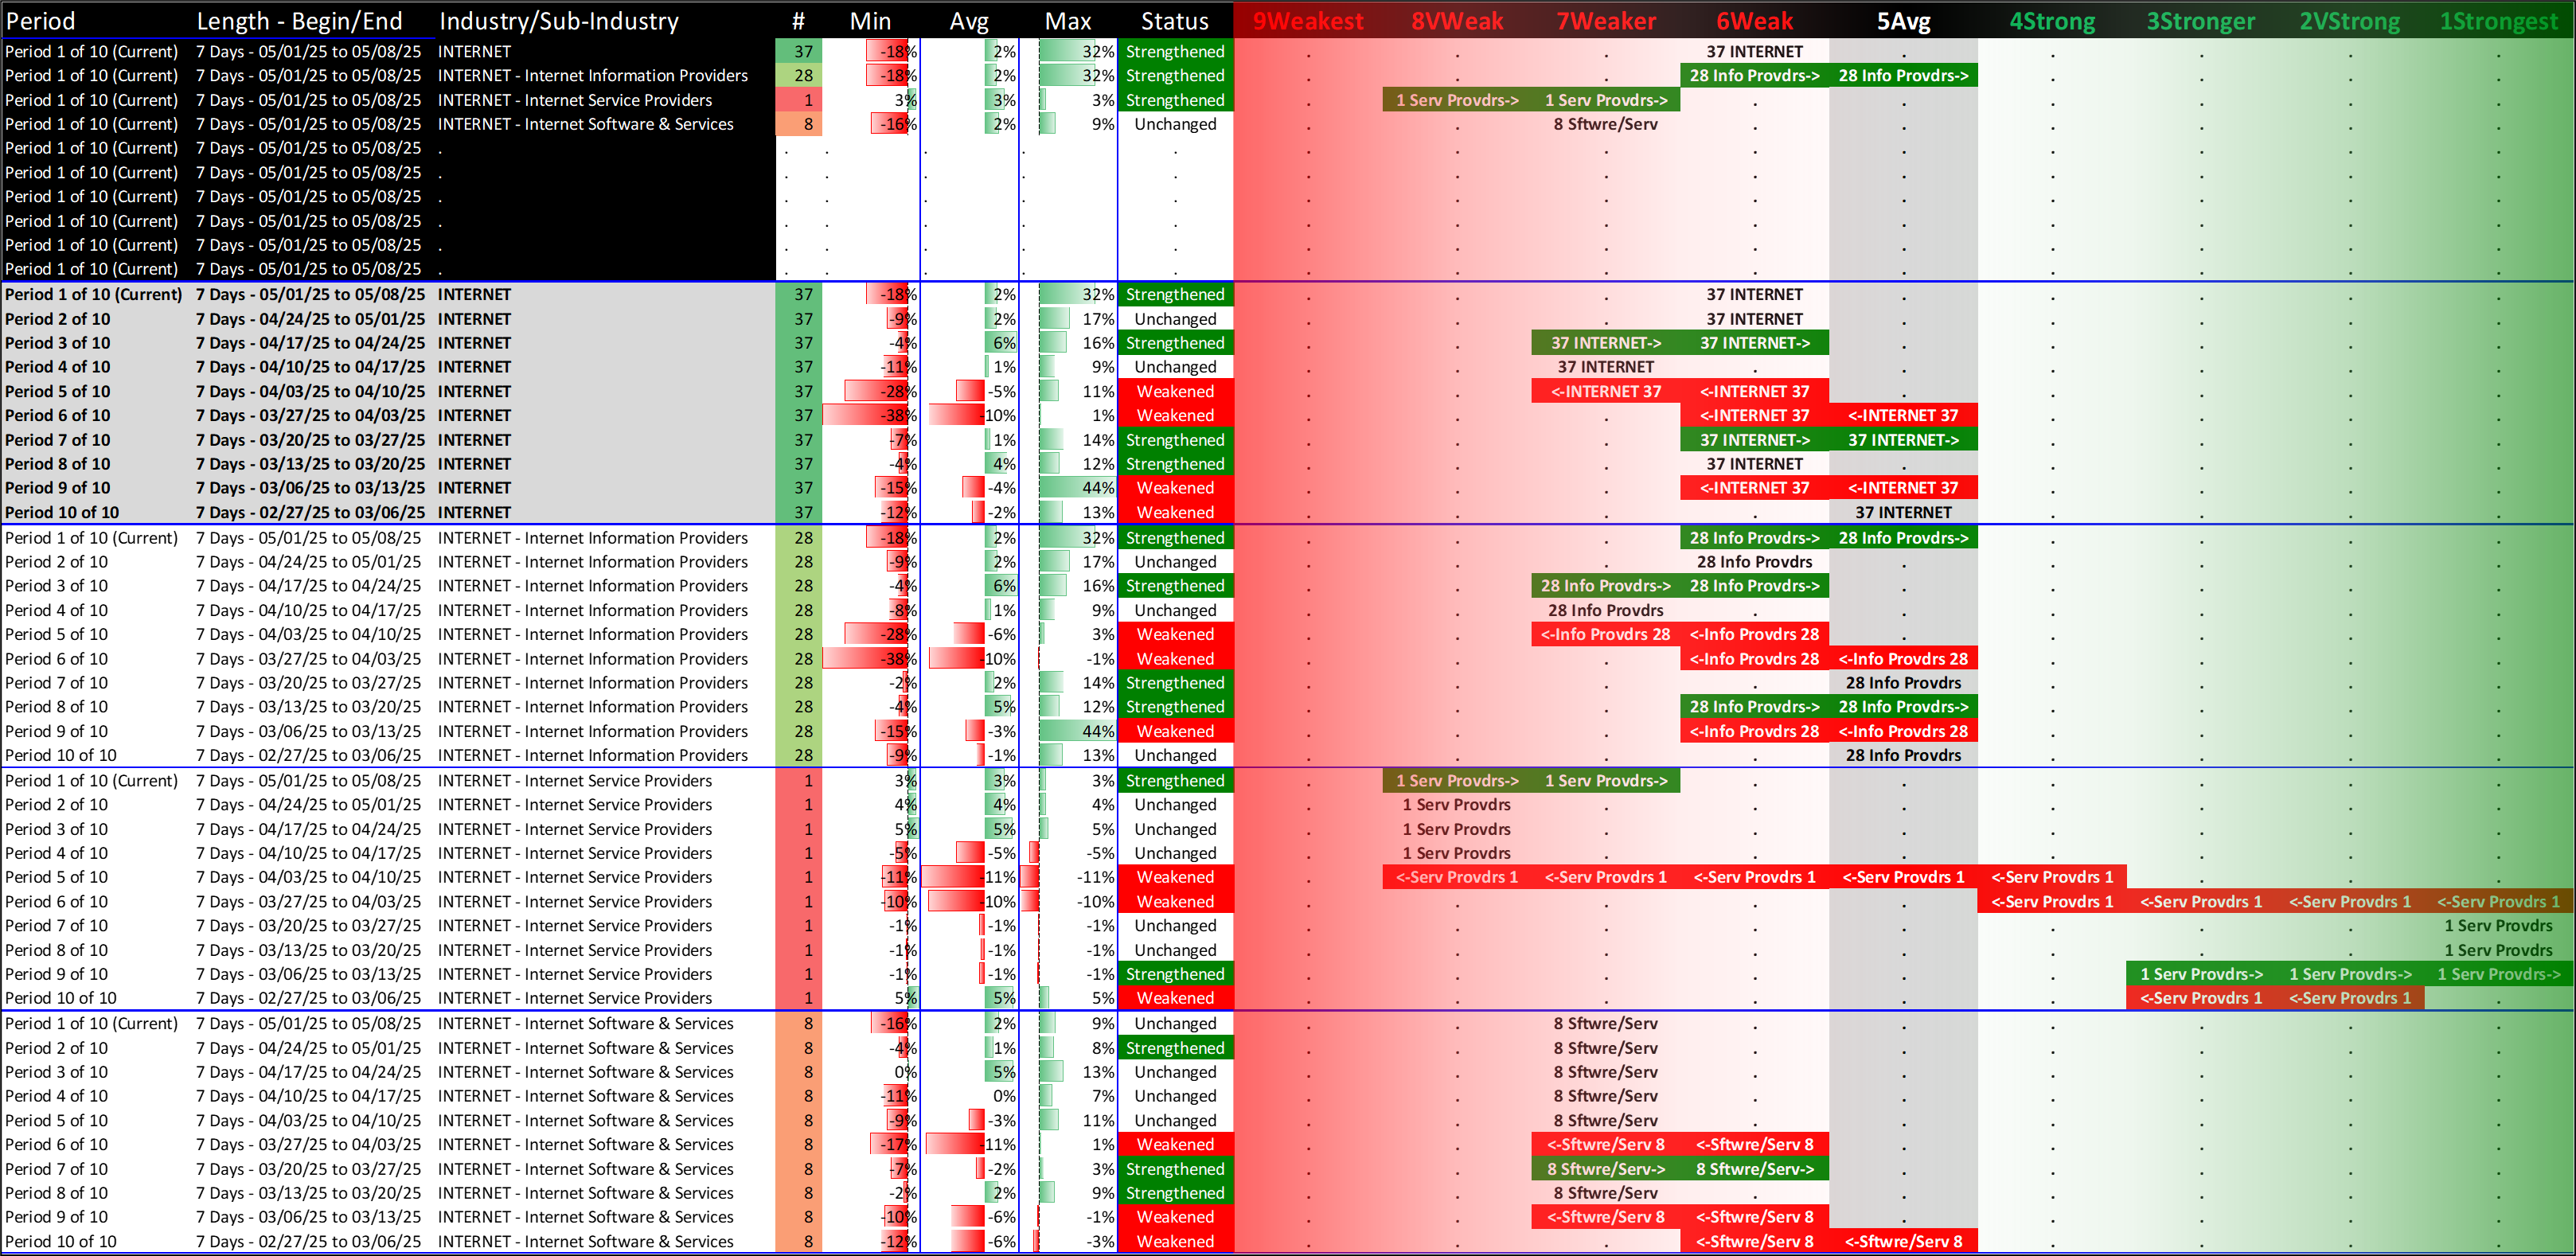
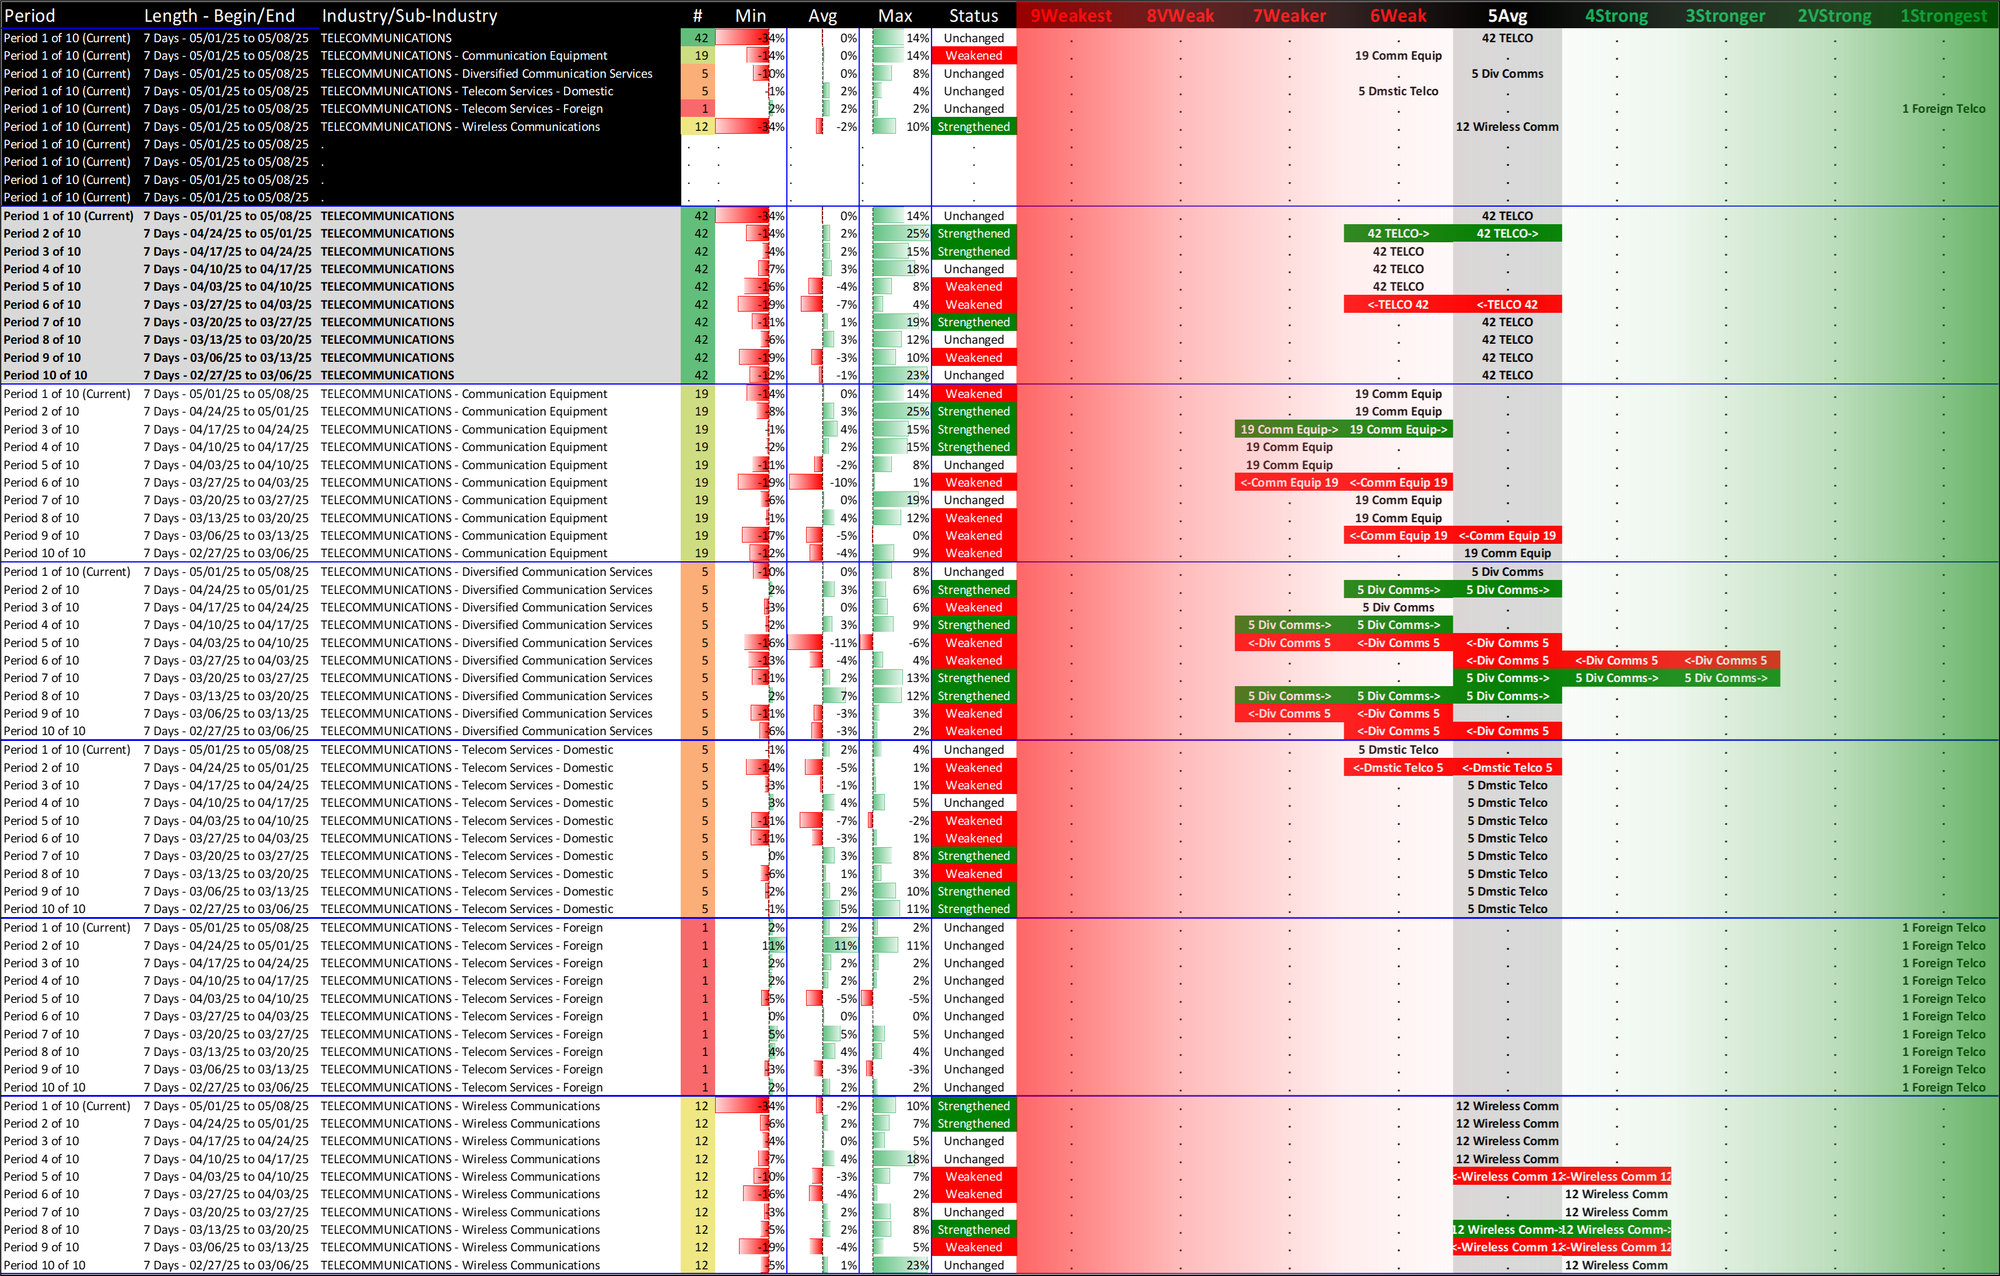
4. SUB-INDUSTRY 10-Week Strengthening
Overview
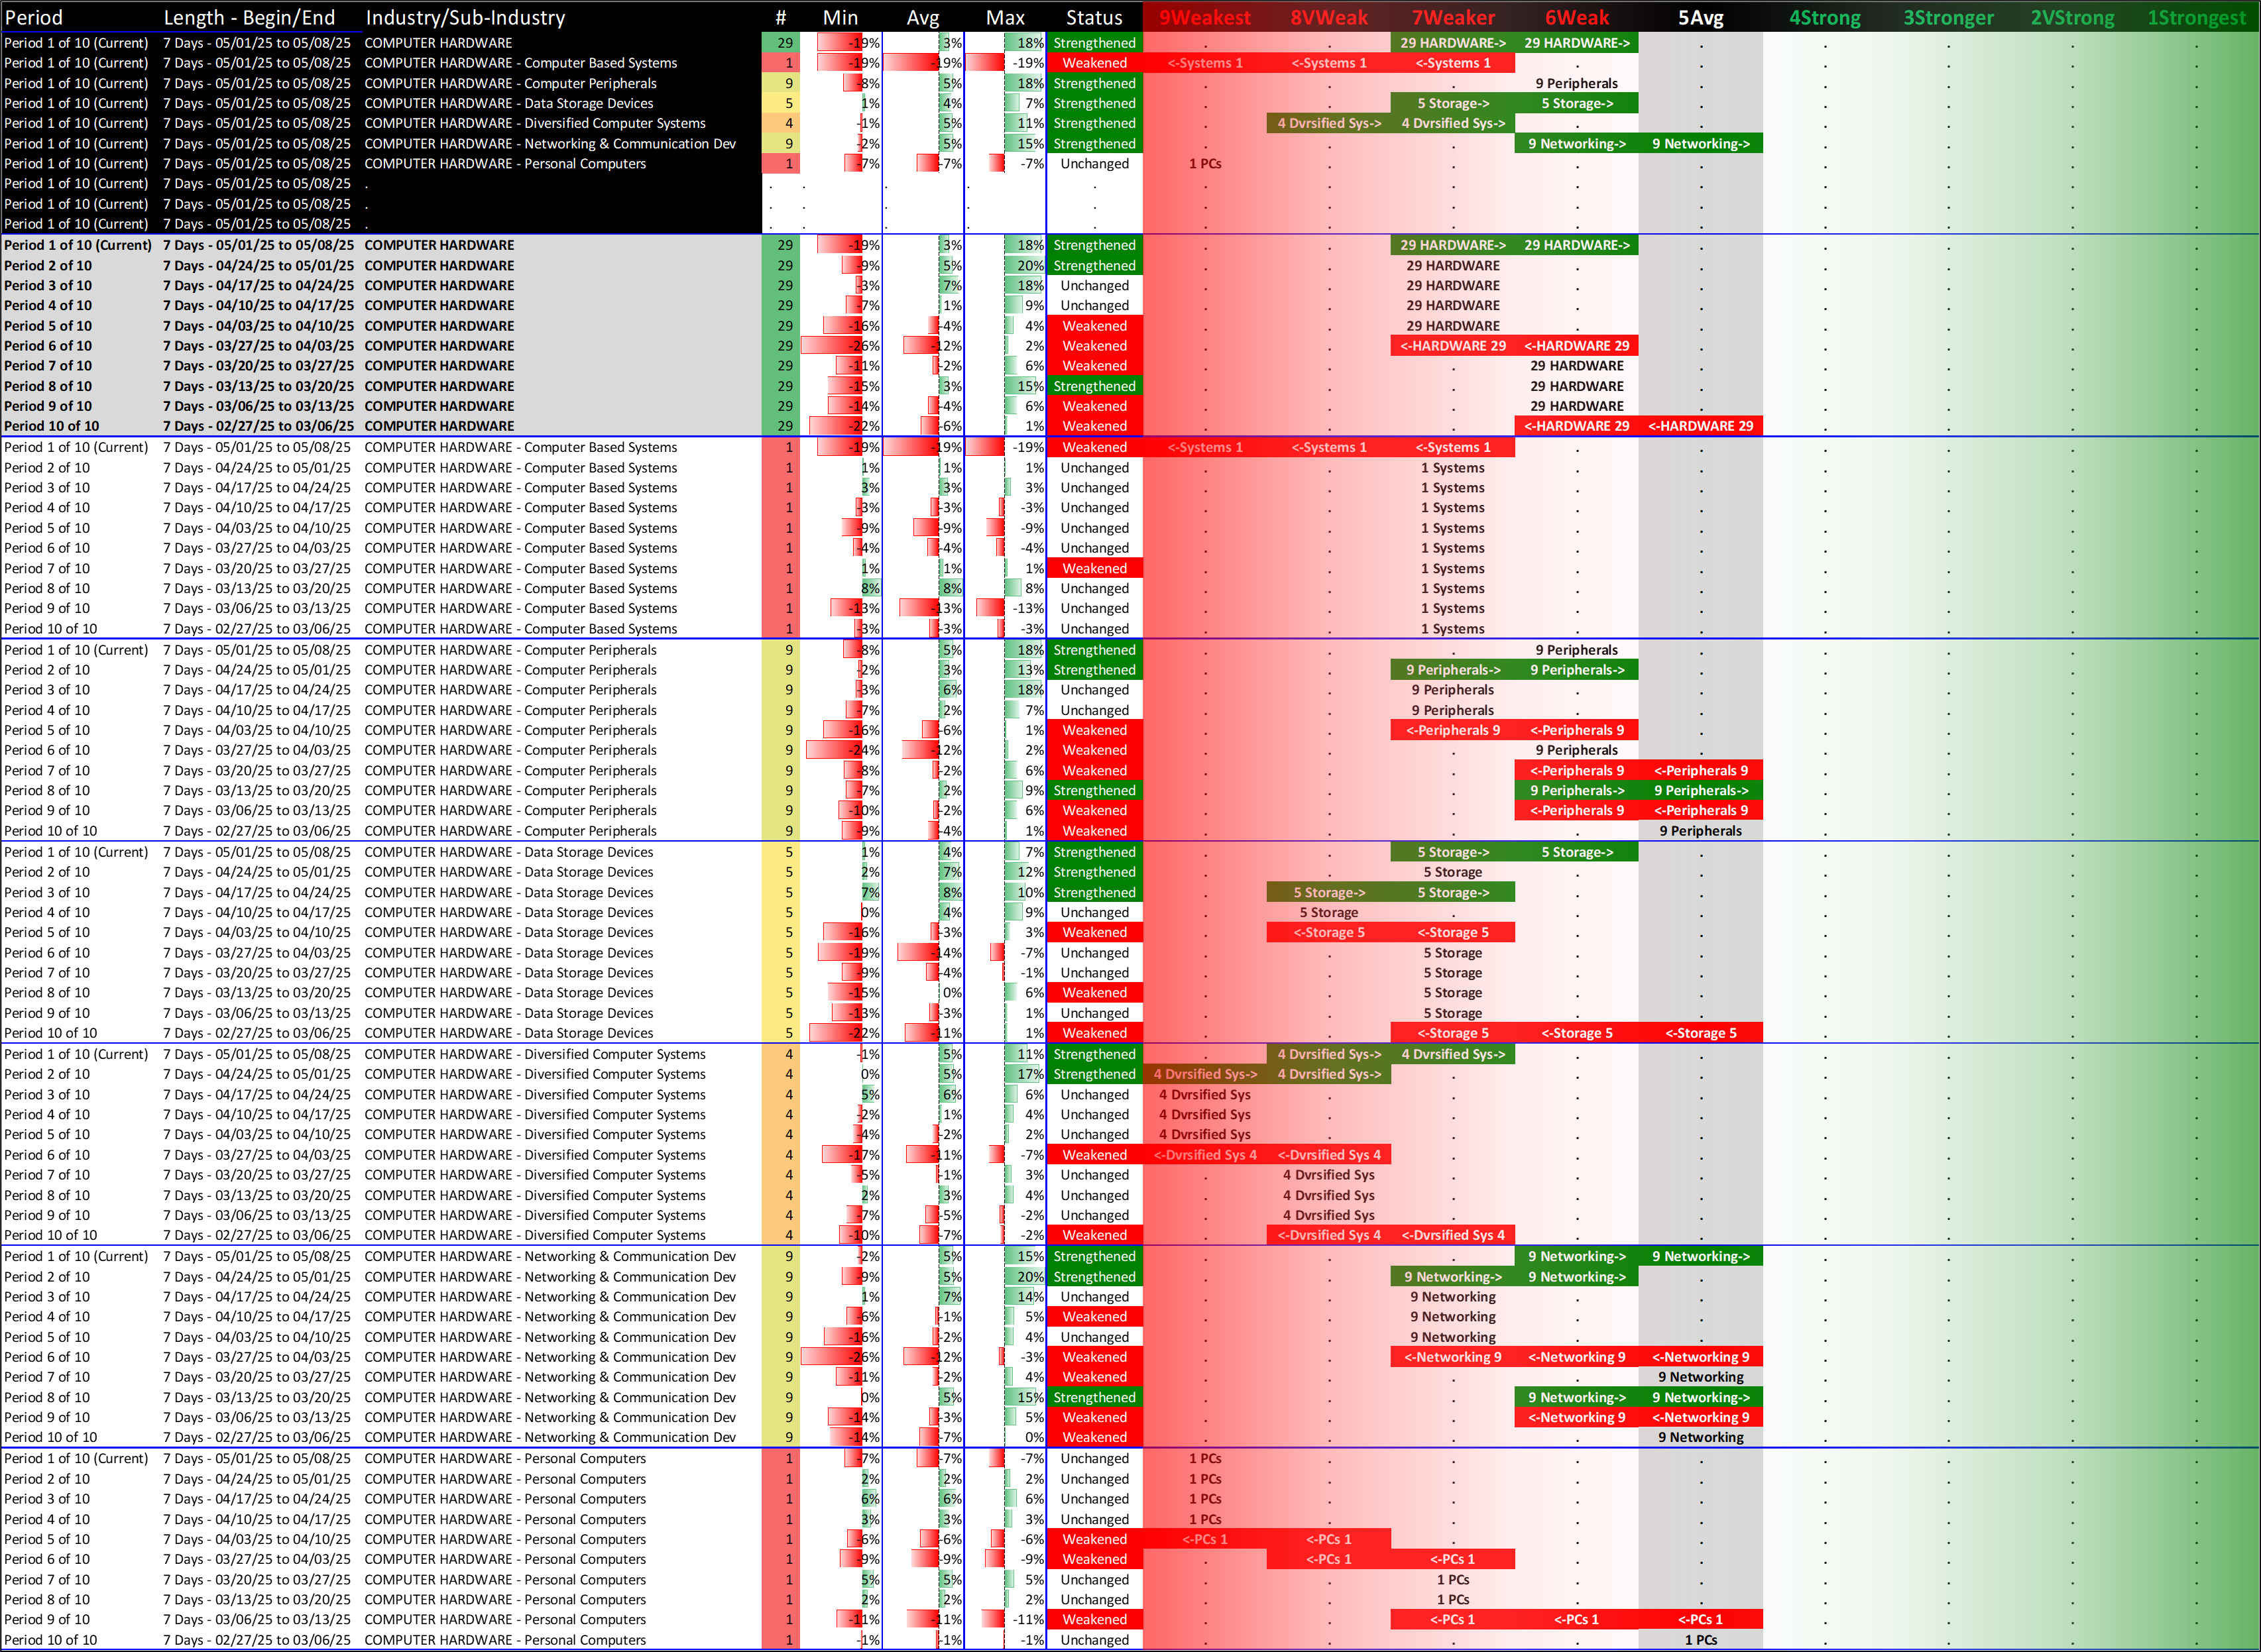
What: recent week-by-week strength changes for the industry and its sub-industries
Why: objective measurement of strengthening and weakening enabling comparison within and across industries and sub-industries
Computer Hardware
Computer Software & Services
Electronics
Internet
Telecommunications
5. STOCKS Outliers: Strongest/Weakest Rated
Overview
What: stocks currently rated 1Strongest/9Weakest (highest/lowest of 9 strength ratings)
Why: these are interesting stocks for available capital because
- The Strongest have the least amount of overhead supply to dampen breakouts while
- the Weakest may be prone to volatility, subject to big pops from bottom-fishing and short-covering BUT ALSO to bigger and faster falls.
- (Not guaranteed and not a recommendation - weak stocks in weakening sub-industries may be better shorts than high-flyers.)
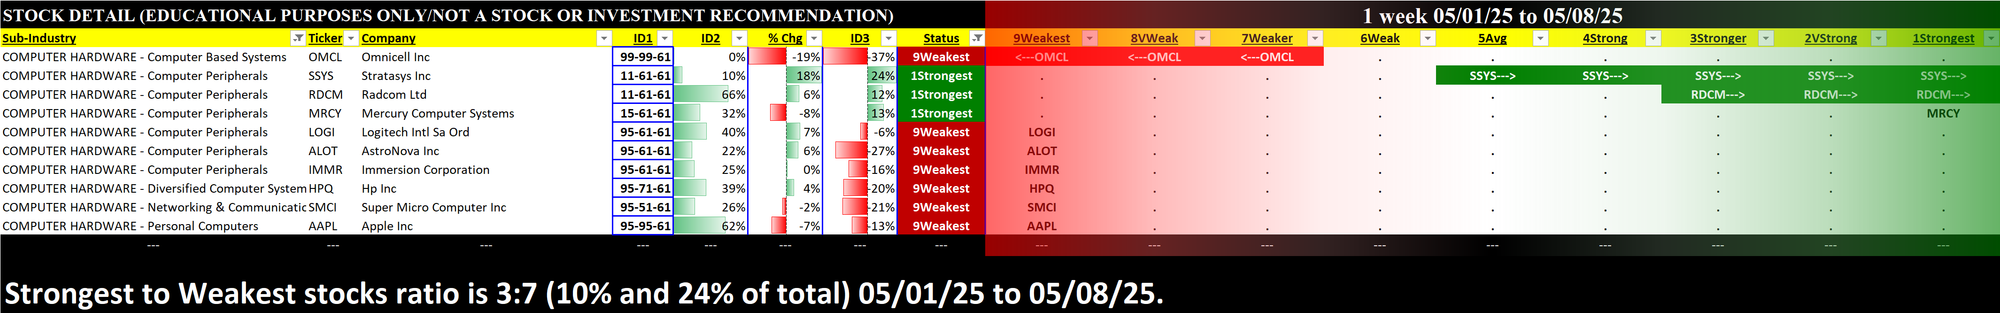
Computer Hardware
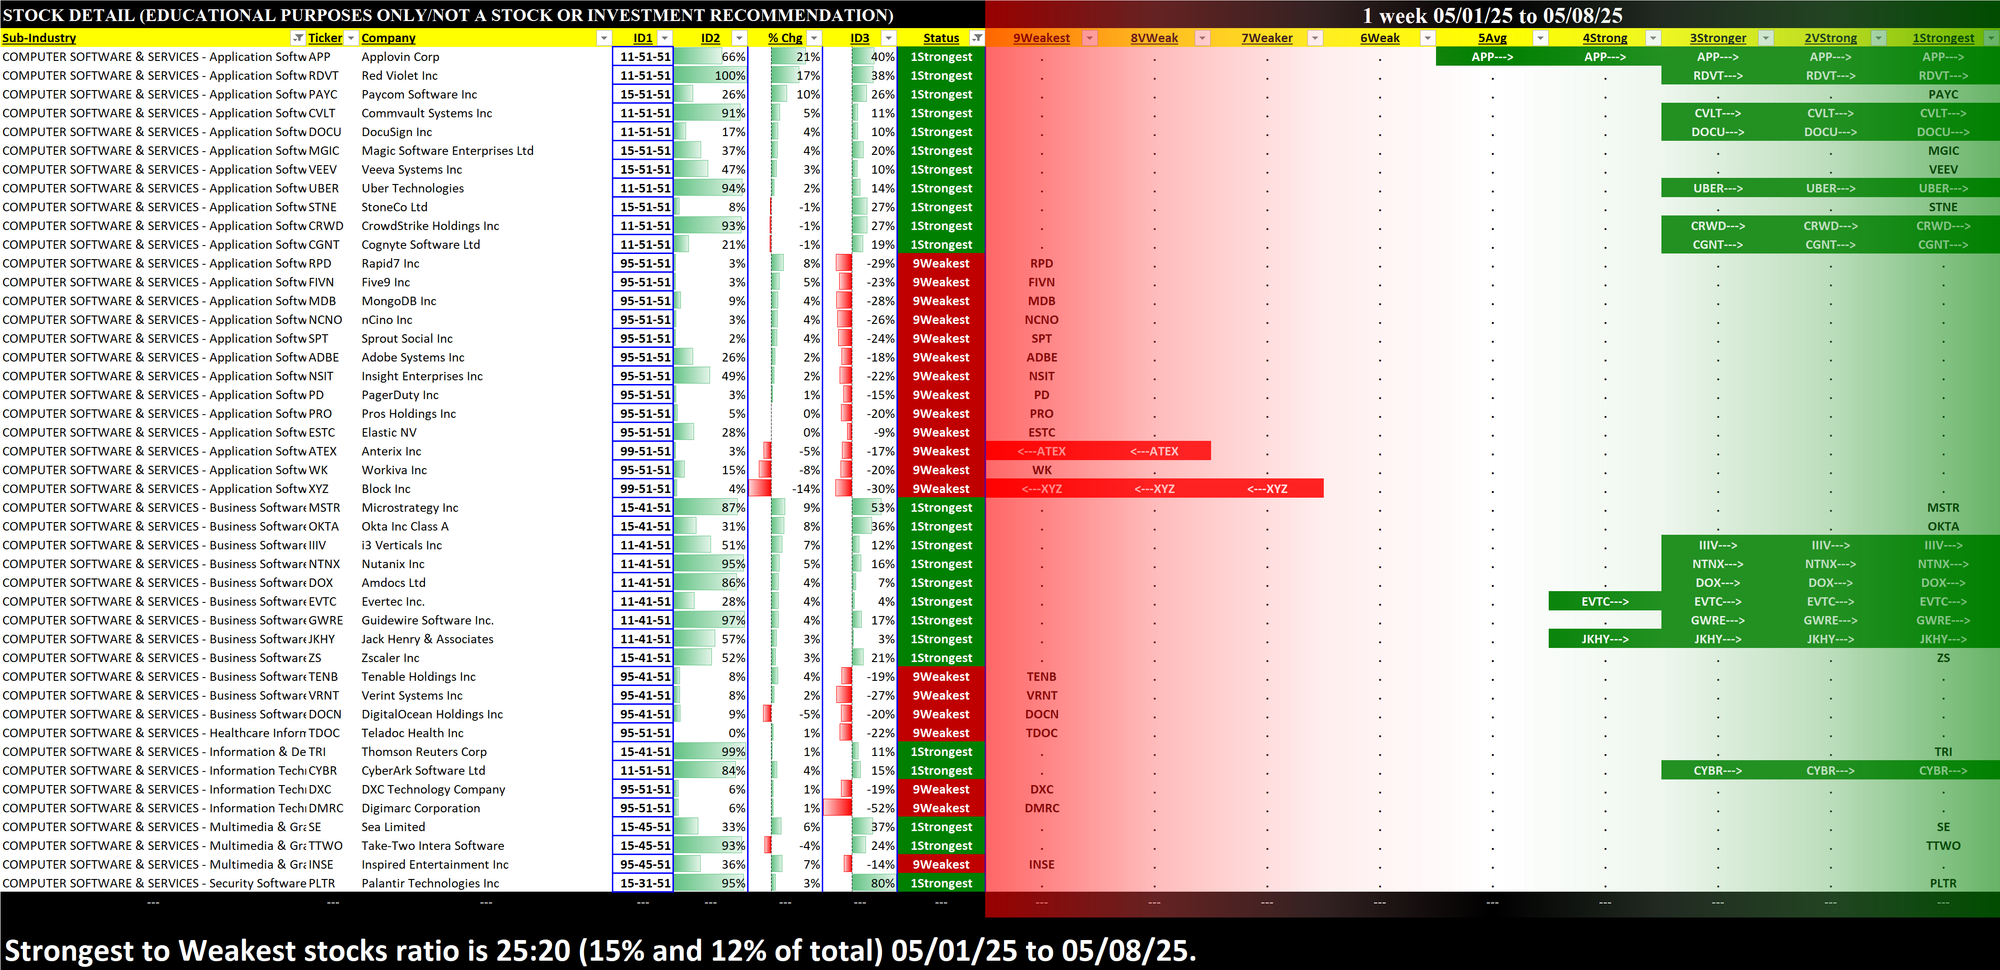
Computer Software & Services
Electronics

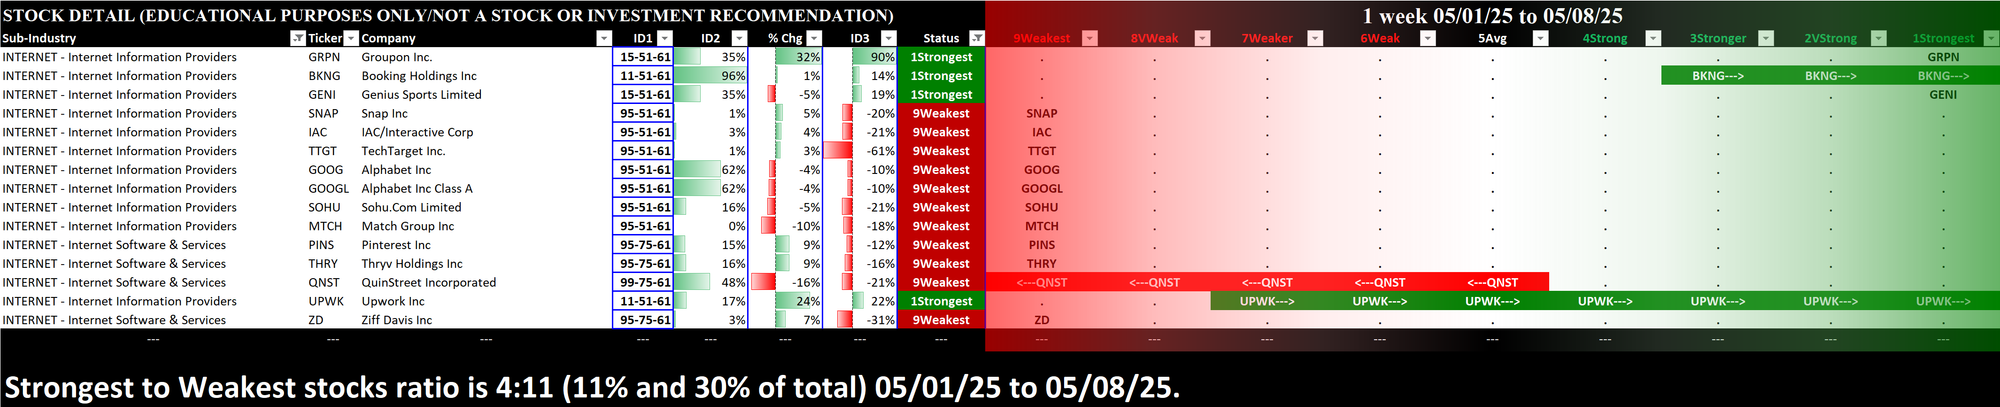
Internet
Telecommunications
6. STOCKS Outliers: 1-Week % Change
Overview
What: stocks with atypically strong or weak performance this week
Why: these are interesting stocks for available capital because
- The journey to 100%+ returns begins with 10% returns...
- Strength can beget strength
- So too weakness
- Momentum and trend-following are time-tested. - A multi-month rally begins with one up week...
- Meaningful moves last
- And can last longer than expected.
Computer Hardware
Computer Software & Services
Electronics
Internet
Telecommunications
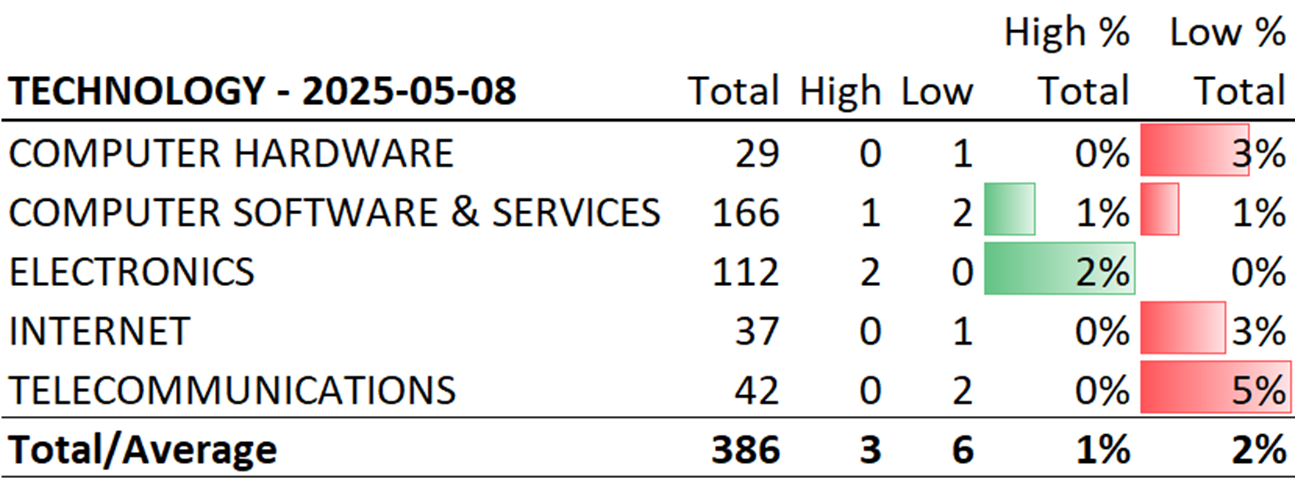
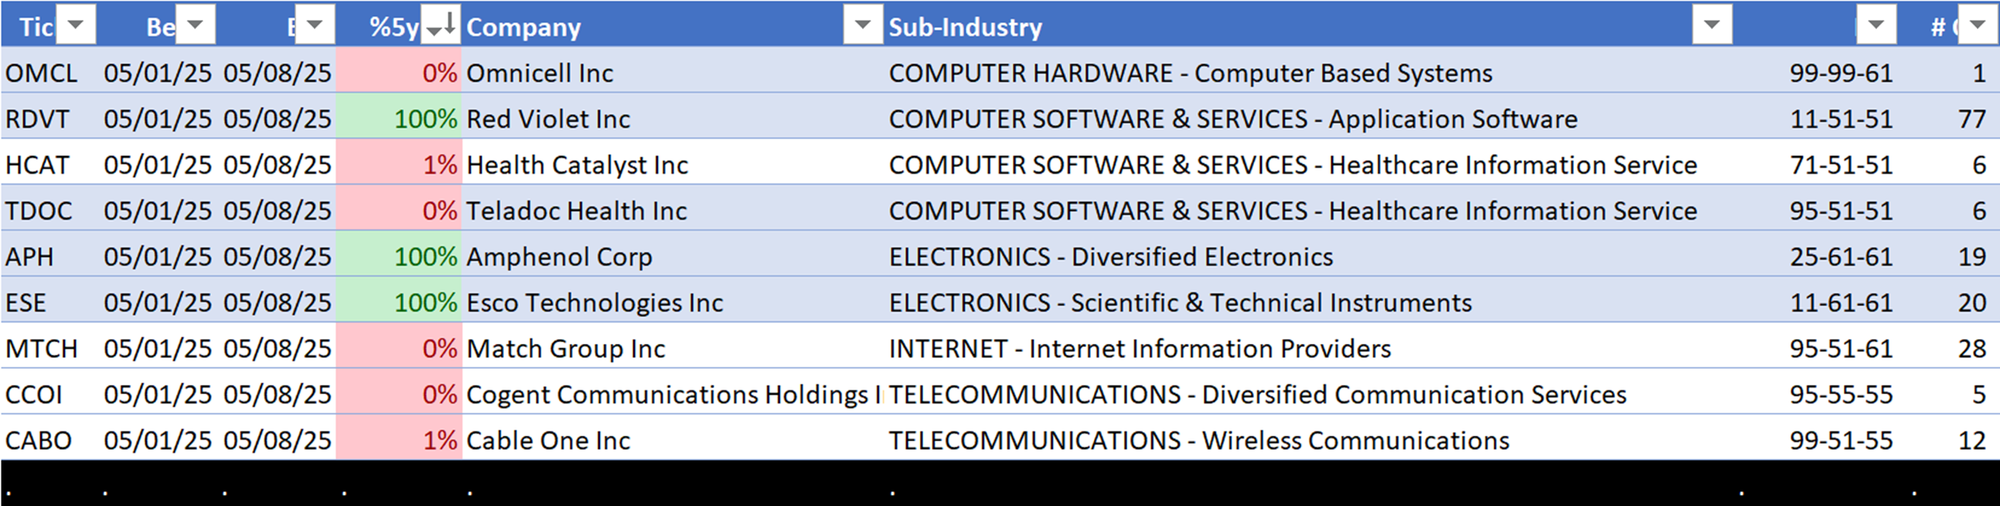
7. STOCKS Outliers: 5-Year Highs/Lows
Overview
What: stocks at 5-year highs and lows
Why: potential large and/or rapid price movement
This section shows the strongest of the strong and the weakest of the weak, hitting 5-year highs and lows, respectively. The strongest are the leaders of the market. Meanwhile, there is no rational reason to hold weak stocks that are at multi-year lows. There are far too many other attractive choices to waste time or capital on such candidates.