SPDR Sector ETFs Tue 2025-07-08: 4.4 Strength Score
What do you need to know about this?
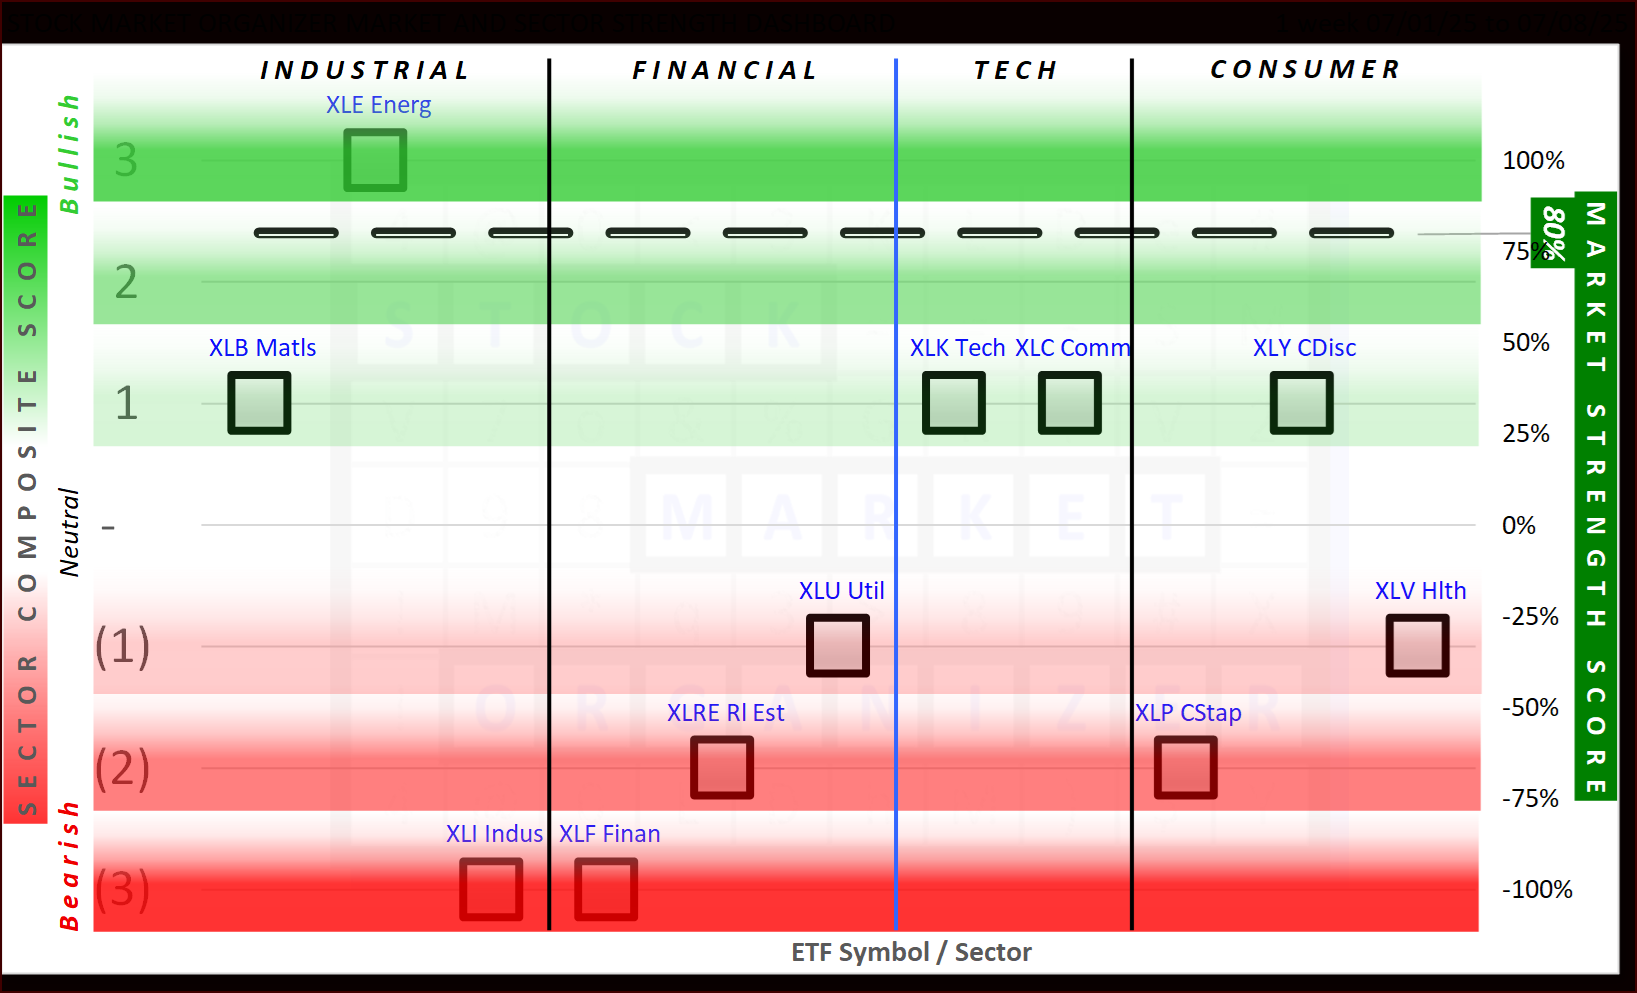
The market was mixed this past week as five ETFs are at or above +1 while six are at or below -1.
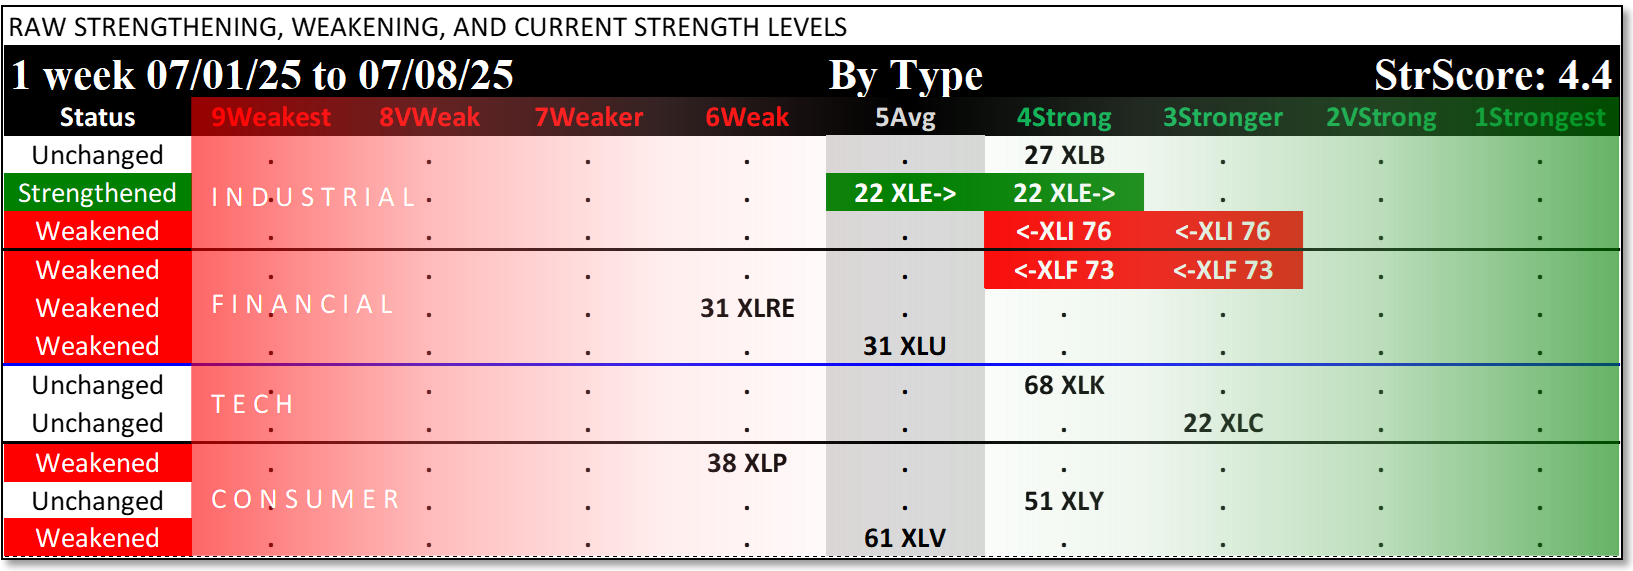
To stack strength, go long strong stocks (rated 1Strongest) in sectors with positive ratings.
To stack weakness, go short weak stocks (rated 9Weakest) in sectors with negative ratings.
Today the Market Strength Score is +80% and this supports strength stacking. (Market Strength Score was +74% Thursday, July 3.)
Background:
This dashboard combines the current Market Strength Score and Sector Risk Gauge analysis with practical scoring of the sectors so the user can objectively stack strength and weakness at all times through the changing market cycle.
This objective measurement is based upon the strengthening and weakening of stocks that comprise each sector.
For each sector, a positive reading means the sector is rising = Risk On:
- Higher is better, but there is no guarantee that from week to week a sector will remain positive. There is also no guarantee that the sector will NOT remain positive. Welcome to the uncertainty of the market.
A negative reading is Risk Off:
- Lower is weaker and, like for positive readings, readings can easily change from negative to positive week to week. There are no rating stability guarantees.
Strength Spectrum Analysis
The following analysis summary is the foundation for the Market and Sector Strength Dashboard:
Next Steps
Appropriately deploy available portfolio capital based on your desired long/short exposure given the current market phase as determined by the Market Strength Score/Sector Risk Gauge. For me, this requires knowing which stocks are strongest in strong sectors and weakest in weak sectors, thus allowing me to stack strength or weakness.