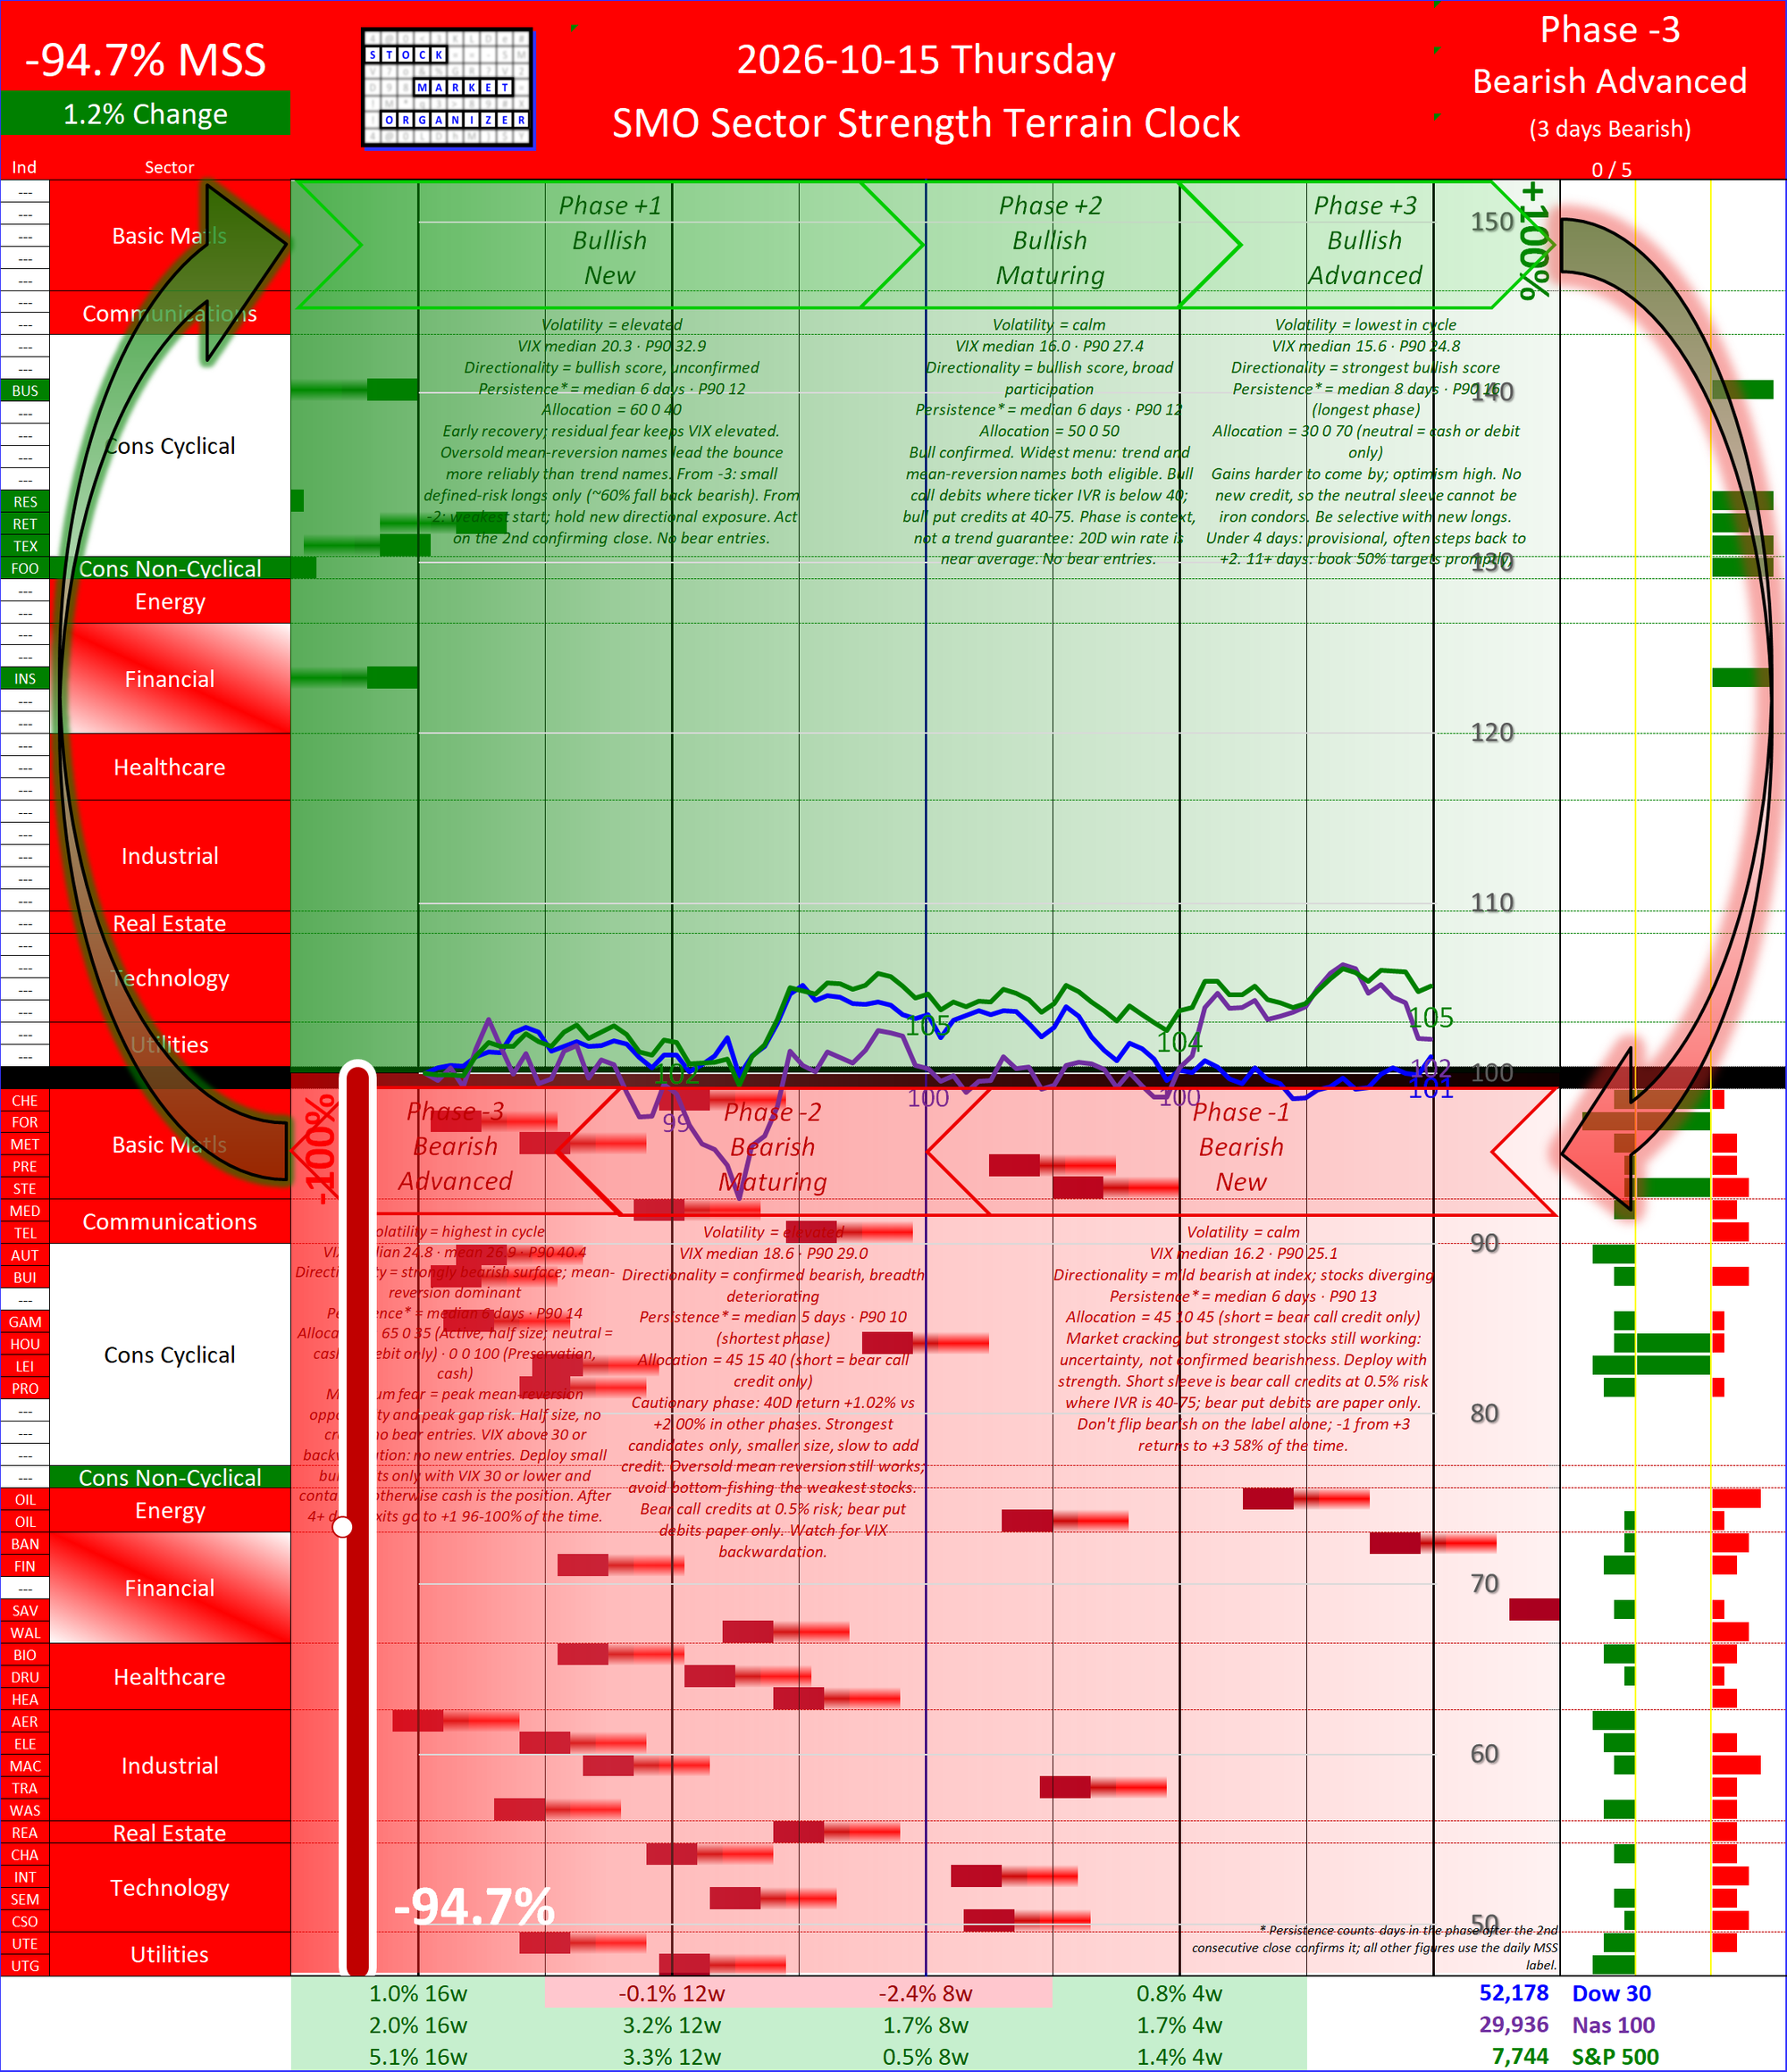
Sector Strength Terrain Clock showing Phase -3 Bearish Advanced, third day in a new bearish phase. Fourteen bearish industries are in Bearish Advanced and eleven are in Bearish Maturing. No bullish industries are on the verge of flipping to bearish and five bearish industries are close to switching to bullish. Consumer Non-cyclical is bullish, Consumer Cyclical is mixed, and Financial is mostly weak. All other sectors are uniformly weak.
See About for more detailed background to this analysis.
Third day of new Bearish Phase with Market Strength Score today at -94.7%, not far from the current 52-week low of 96.4% from October 1. The previous Bullish phase lasted six days and the previous bearish phase was seven days.
Goal: objectively determine what to do and when in the U.S. stock market How: top-down, inside-out, and bottom-up market, sector, industry, sub-industry, and stock analysis; three unique tools 1) Market Strength Score, 2) Sector Strength Terrain Clock, 3) Strength Spectrums Example actions:long vs. short, trend follow vs. mean revert, aggressive vs. conservative, days vs. weeks expected holding period Basis:where are there strength pockets and how much may remain
Tools: 1. Sector Strength Terrain Clock, a single-day snapshot plotting sector and industry strength and the current Market Strength Score within the Six-Phase framework 2. Market Strength Score Gauge, a one year comparison of the Market Strength Score and the S&P 500 3. Industry Strength Scores by Sectorshowing comparative alphabetical views of sector and industry strength 4. Industry Strength Scores Rankedwhich groups the strongest and weakest industries to identify pockets of least and most extended setups 5. Sector and Sector ETFs High-Level Reportsshowing Strength Spectrums for the 11 sectors and the 11 sector ETFs 6. Sector Mid-Level and Detailed Reportsshowing Strength Scores and Strength Spectrums for sectors, industries, and sub-industries 7. Ranked Reports clearly showing where is the strength and weakness at the sector ETF, industry, and sub-industry levels
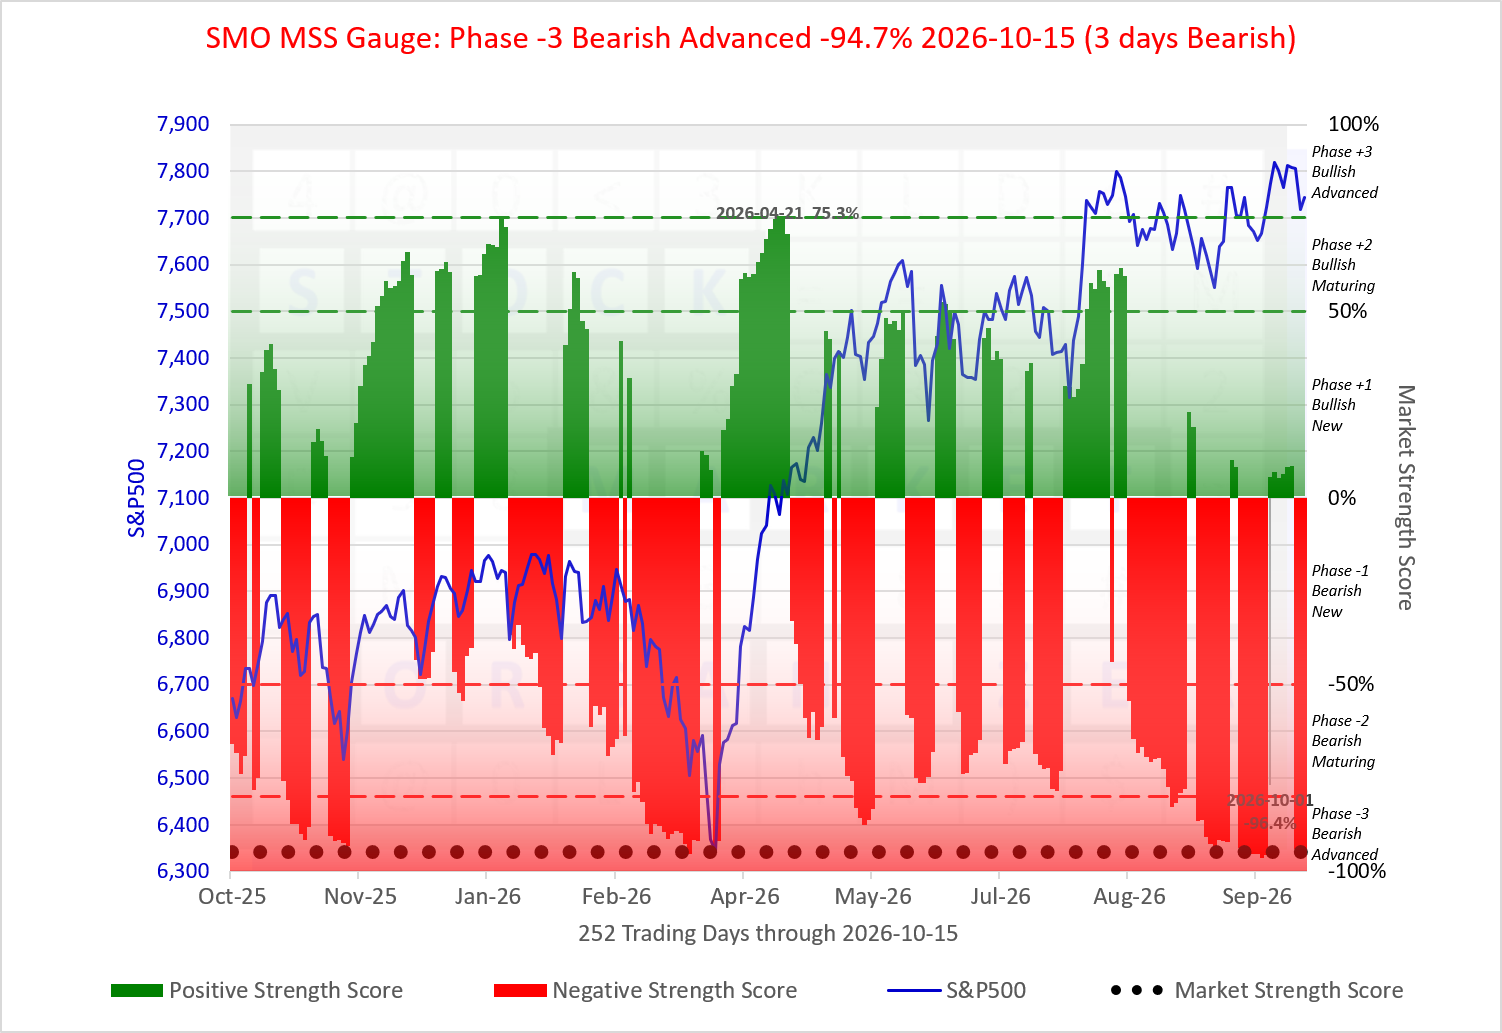
SMO Market Strength Score Gauge
Provides 12 month context against prior scores and the S&P 500 for today's MSS.
The one year MSS extremes are 75.2% on 2026-04-21 and -96.4% on 2026-10-01.
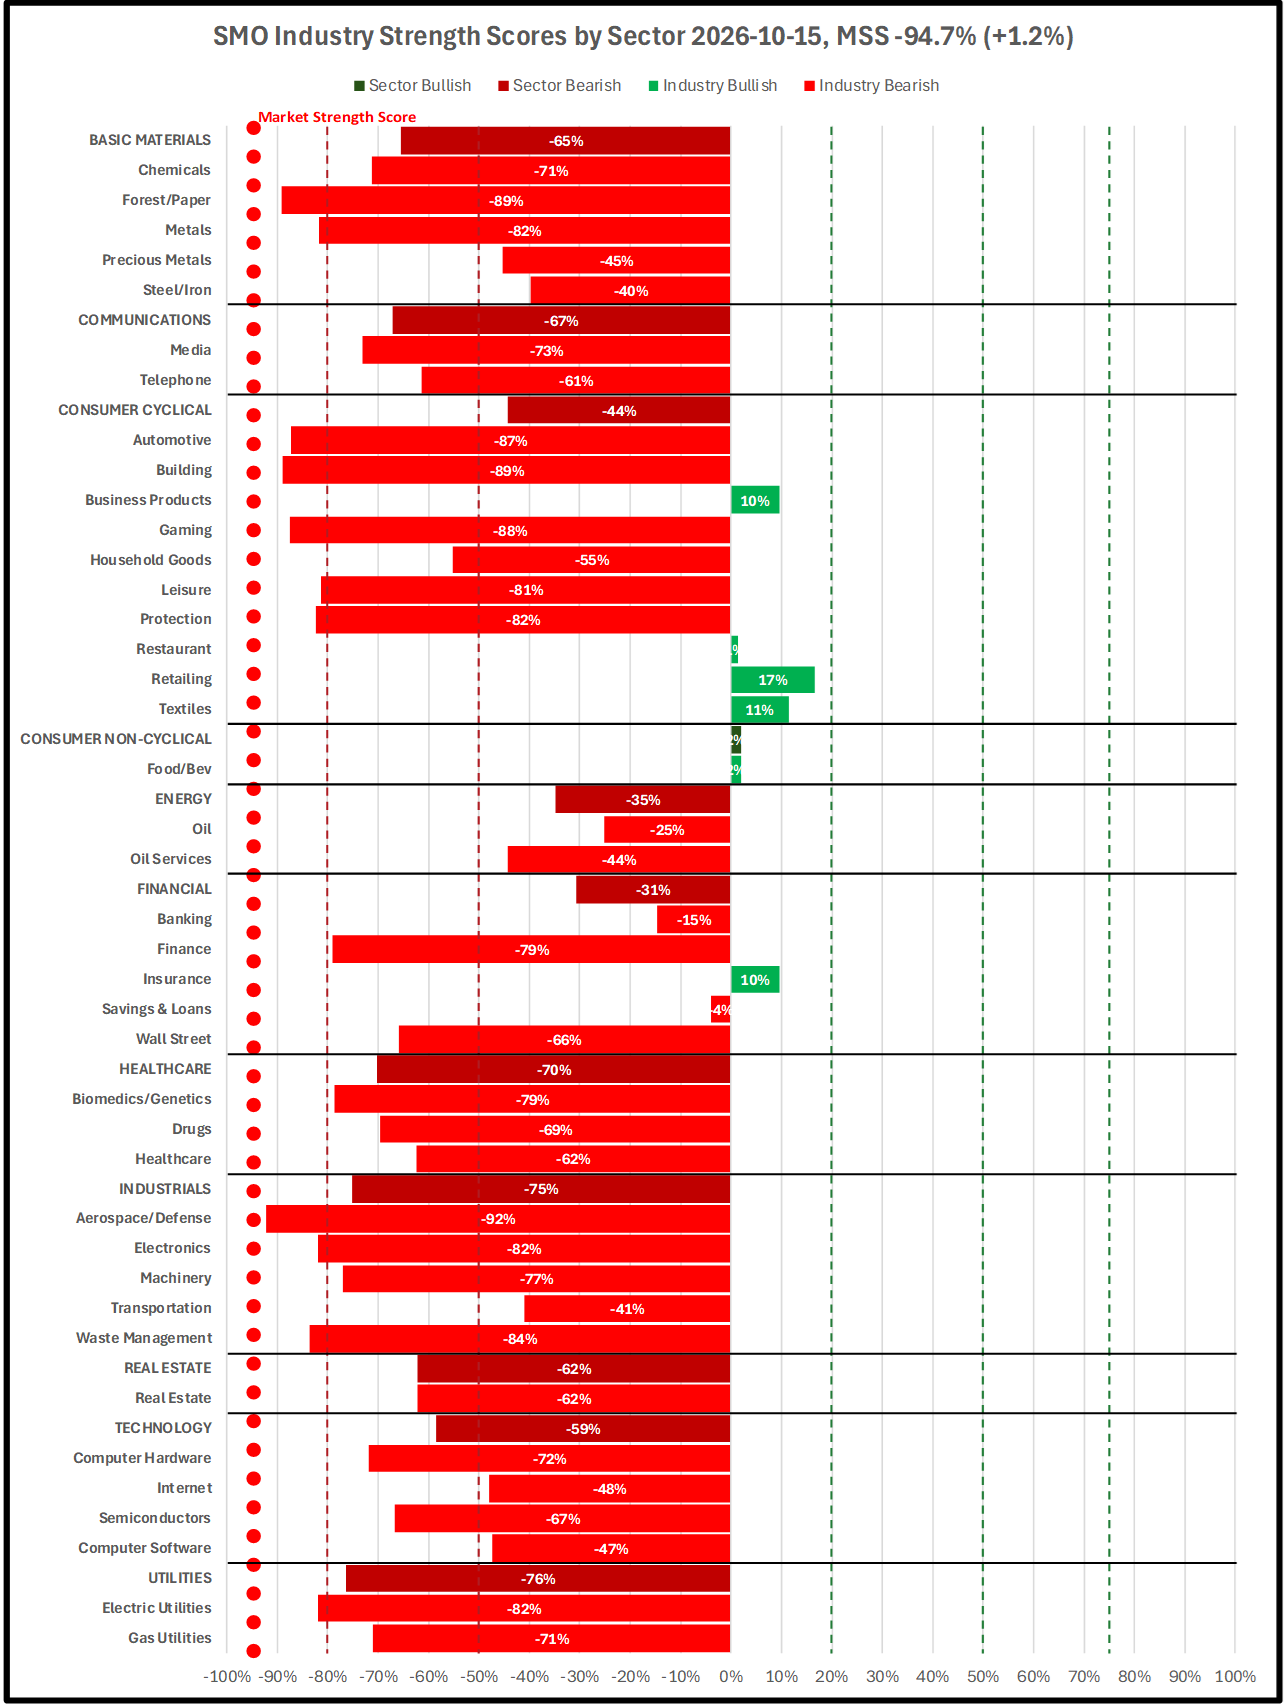
SMO Industry Strength Scores by Sector
The sectors are listed alphabetically and below each are their component industries listed alphabetically. The Six Phase thresholds are labeled along with the current Market Strength Score. This reveals sector strength breadth and depth.
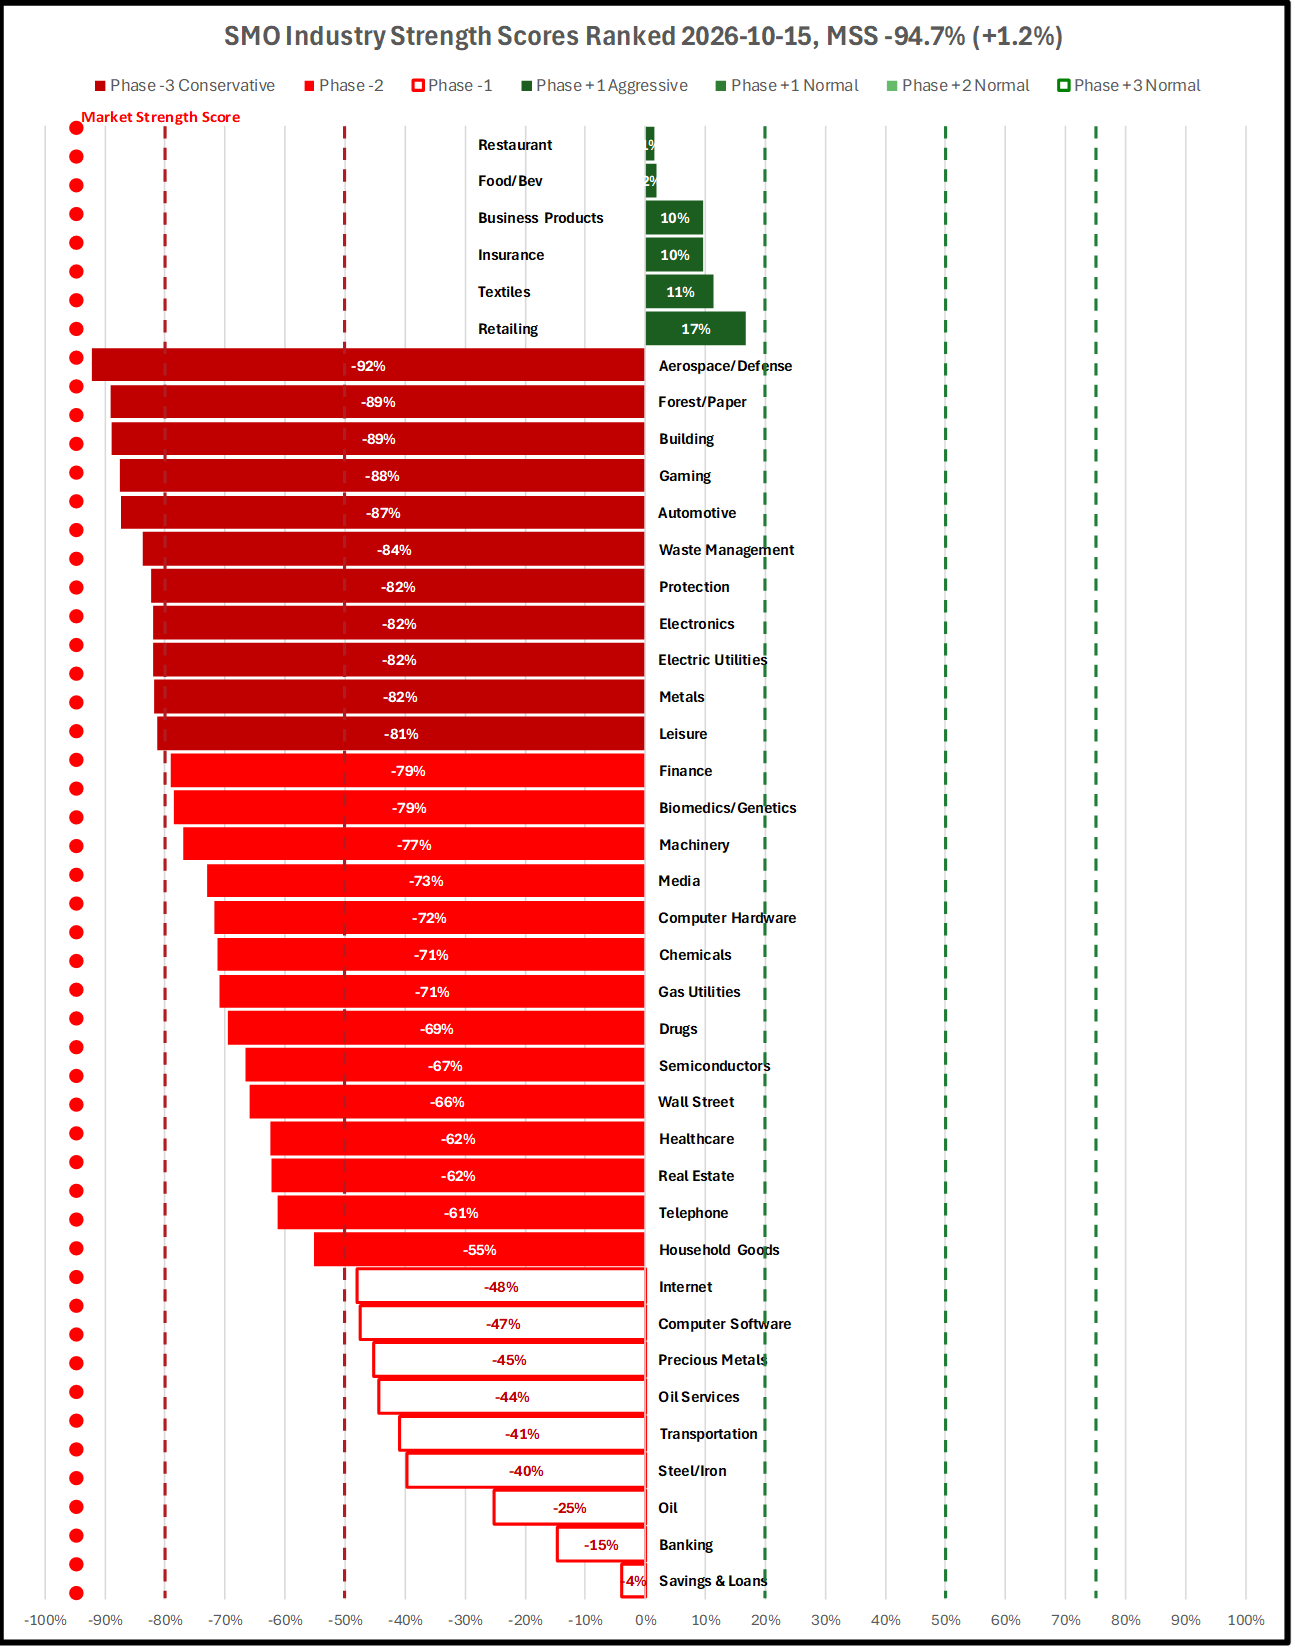
SMO Industry Strength Scores, 2026-10-15: The Market Strength Score is -94.7%. Of the 40 industries tracked, 6 are bullish and 34 are bearish. Bullish industry scores range from 1% to 17%, led by Retailing. Bearish industry scores range from -4% to -92%, with Aerospace/Defense the weakest. At the sector level, 1 of 11 sectors is bullish and 10 are bearish.
SMO Industry Strength Scores Ranked
The industries are listed based on strength score, first strengthening industries then weakening industries. The Six Phase thresholds are labeled along with the current Market Strength Score. This reveals the least and most extended industries.
SMO Industry Strength Scores Ranked, 2026-10-15: With the Market Strength Score at -94.7%, the 40 industries rank from Retailing at the top (17%) to Aerospace/Defense at the bottom (-92%). Bullish phases: 6 in Phase +1 Bullish Aggressive. Bearish phases: 9 in Phase -1 Bearish Normal, 14 in Phase -2 Bearish Normal, 11 in Phase -3 Bearish Conservative. Strongest 3: Retailing (17%), Textiles (11%), Insurance (10%). Weakest 3: Aerospace/Defense (-92%), Forest/Paper (-89%), Building (-89%).
SMO Sector and Sector ETFs High-Level Reports
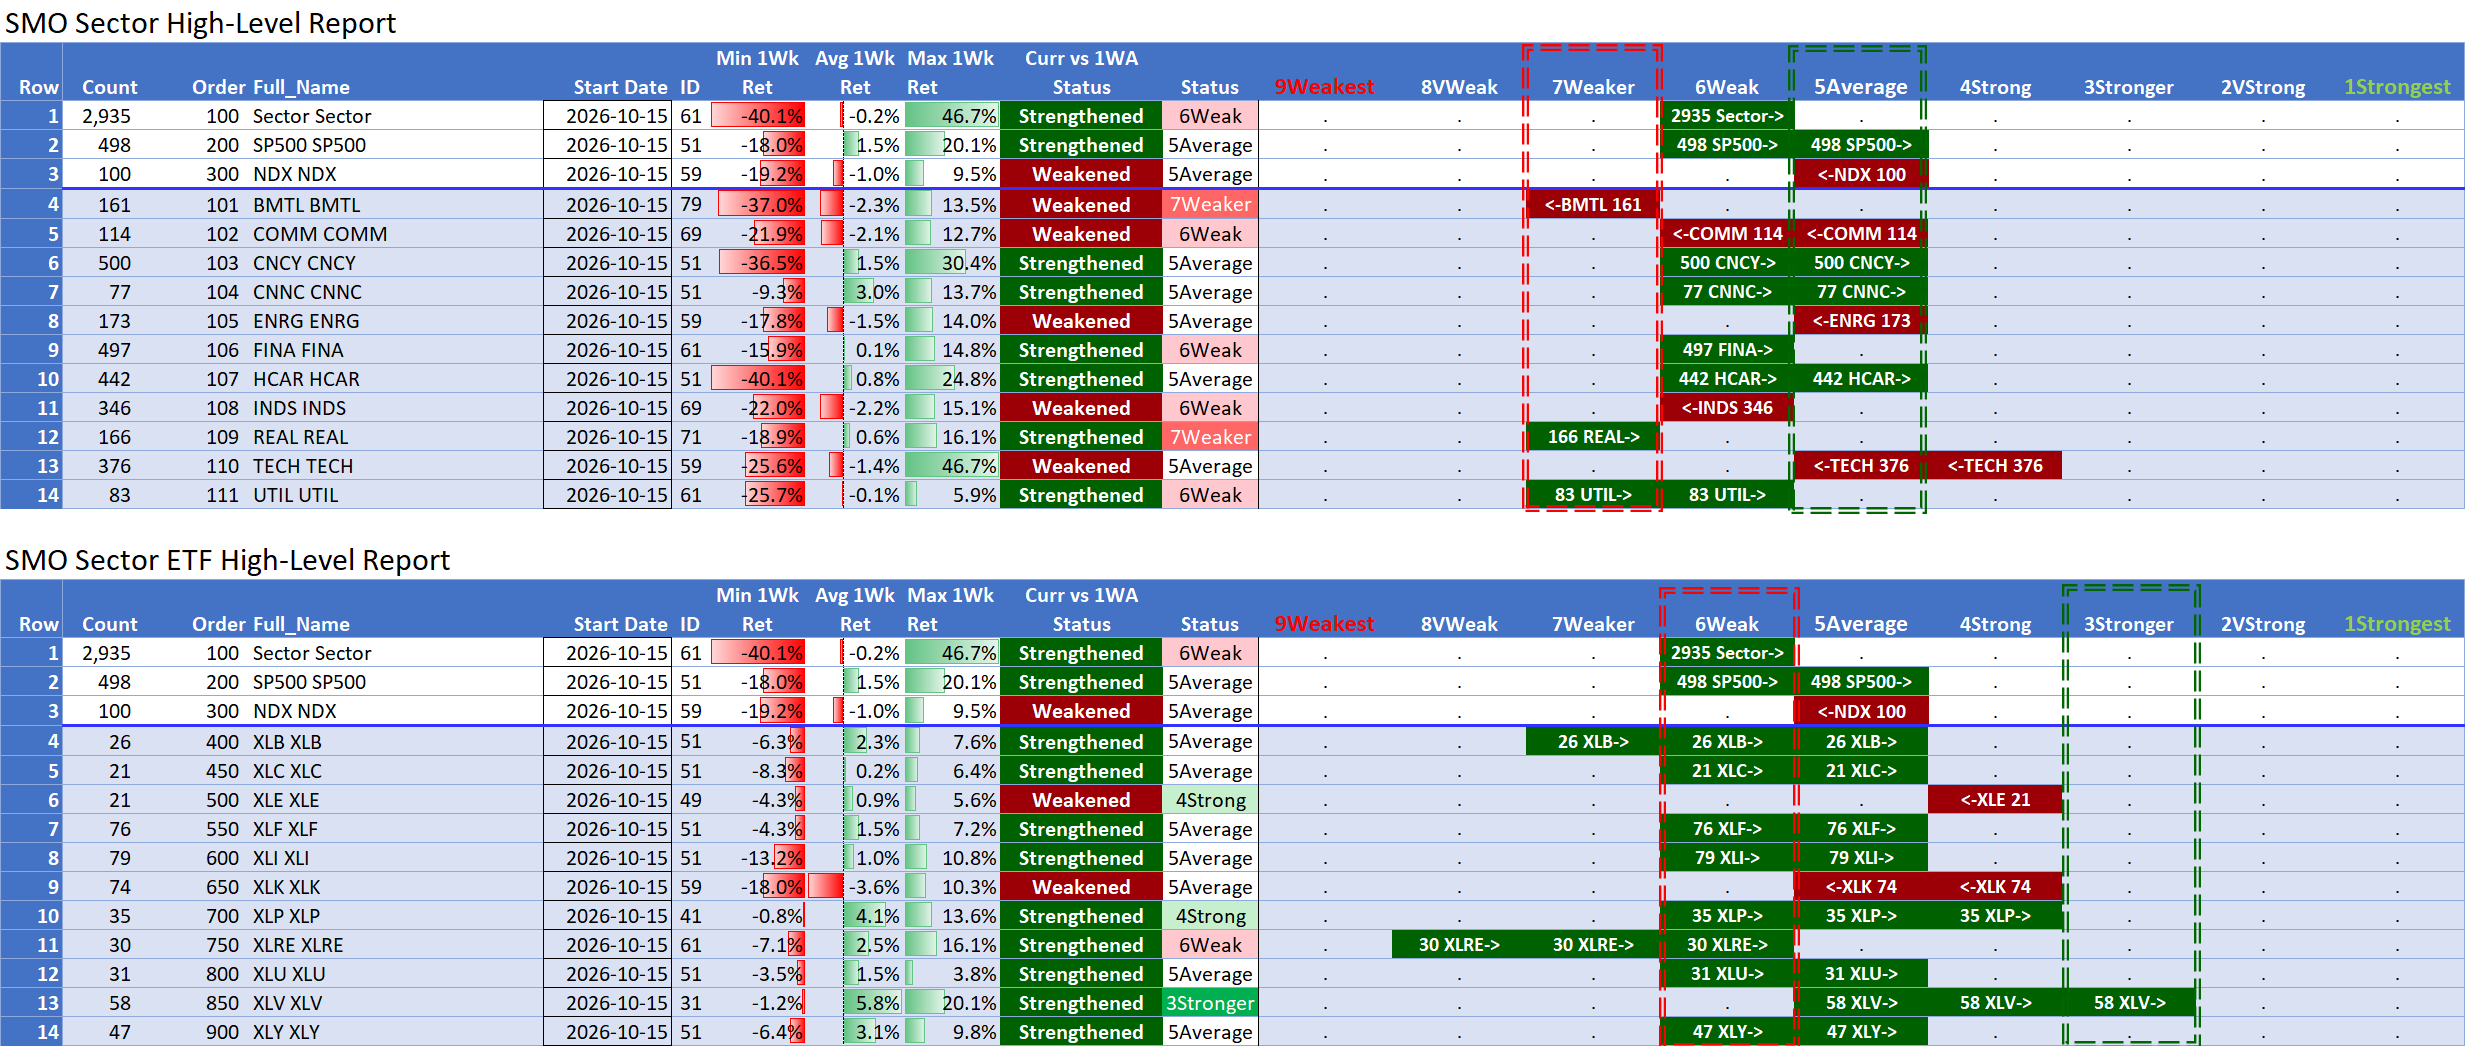
The Sector Report lists the strength spectrum readings for the 11 sectors. The Sector ETFs Report lists the strength spectrum readings for the 11 sector ETFs. Each report also shows the combined strength spectrum for all stocks in this universe and for the major indexes S&P 500 and NDX.
This provides a broad overview of market strength and weakness pockets.
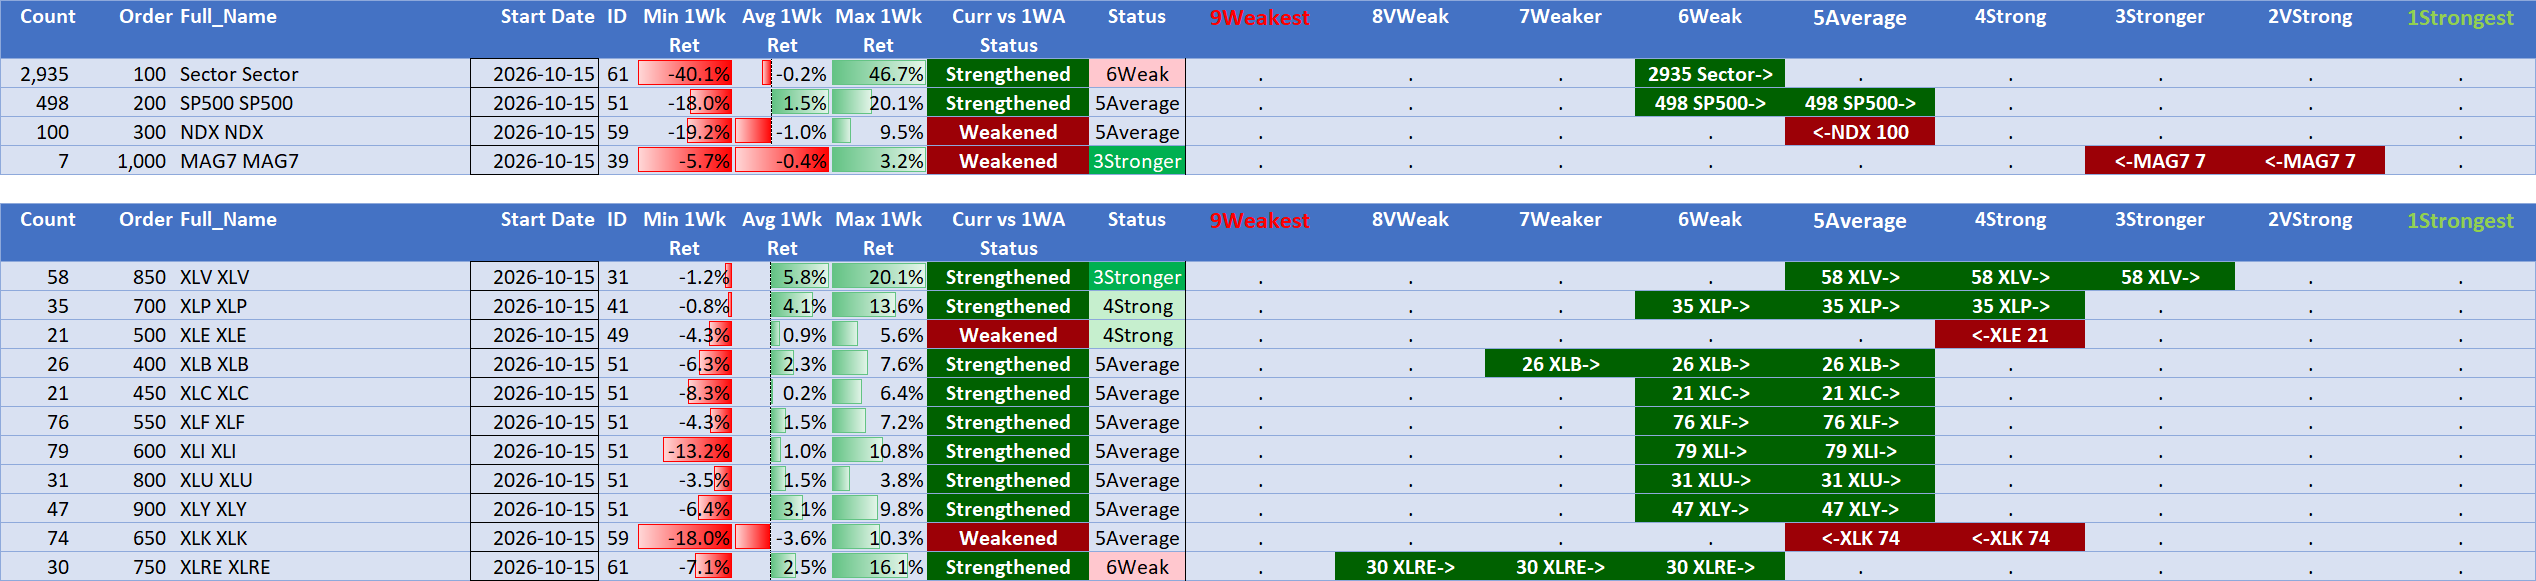
SECTORS (all stocks): Strongest 5Average = CNCY, CNNC, ENRG, HCAR, TECH | Weakest 7Weaker = BMTL, REAL | 6 strengthened / 5 weakened vs prior week | 1-wk avg return best CNNC +3.0%, worst BMTL -2.3%.SECTOR ETFs (constituents only): Strongest 3Stronger = XLV | Weakest 6Weak = XLRE | 9 strengthened / 2 weakened | 1-wk avg return best XLV +5.8%, worst XLK -3.6%. Avg rating 4.7 vs 5.7 for all stocks (1=Strongest, 9=Weakest): ETF constituents are STRONGER than the broad sector universe.
SMO Sector Mid-Level and Detailed Reports
The following Sector Mid-Level and Detailed Reports provide more refined market strength pockets, potential relative lasting power for these strengths, and a logical foundation for potential stock-/option-specific actions.
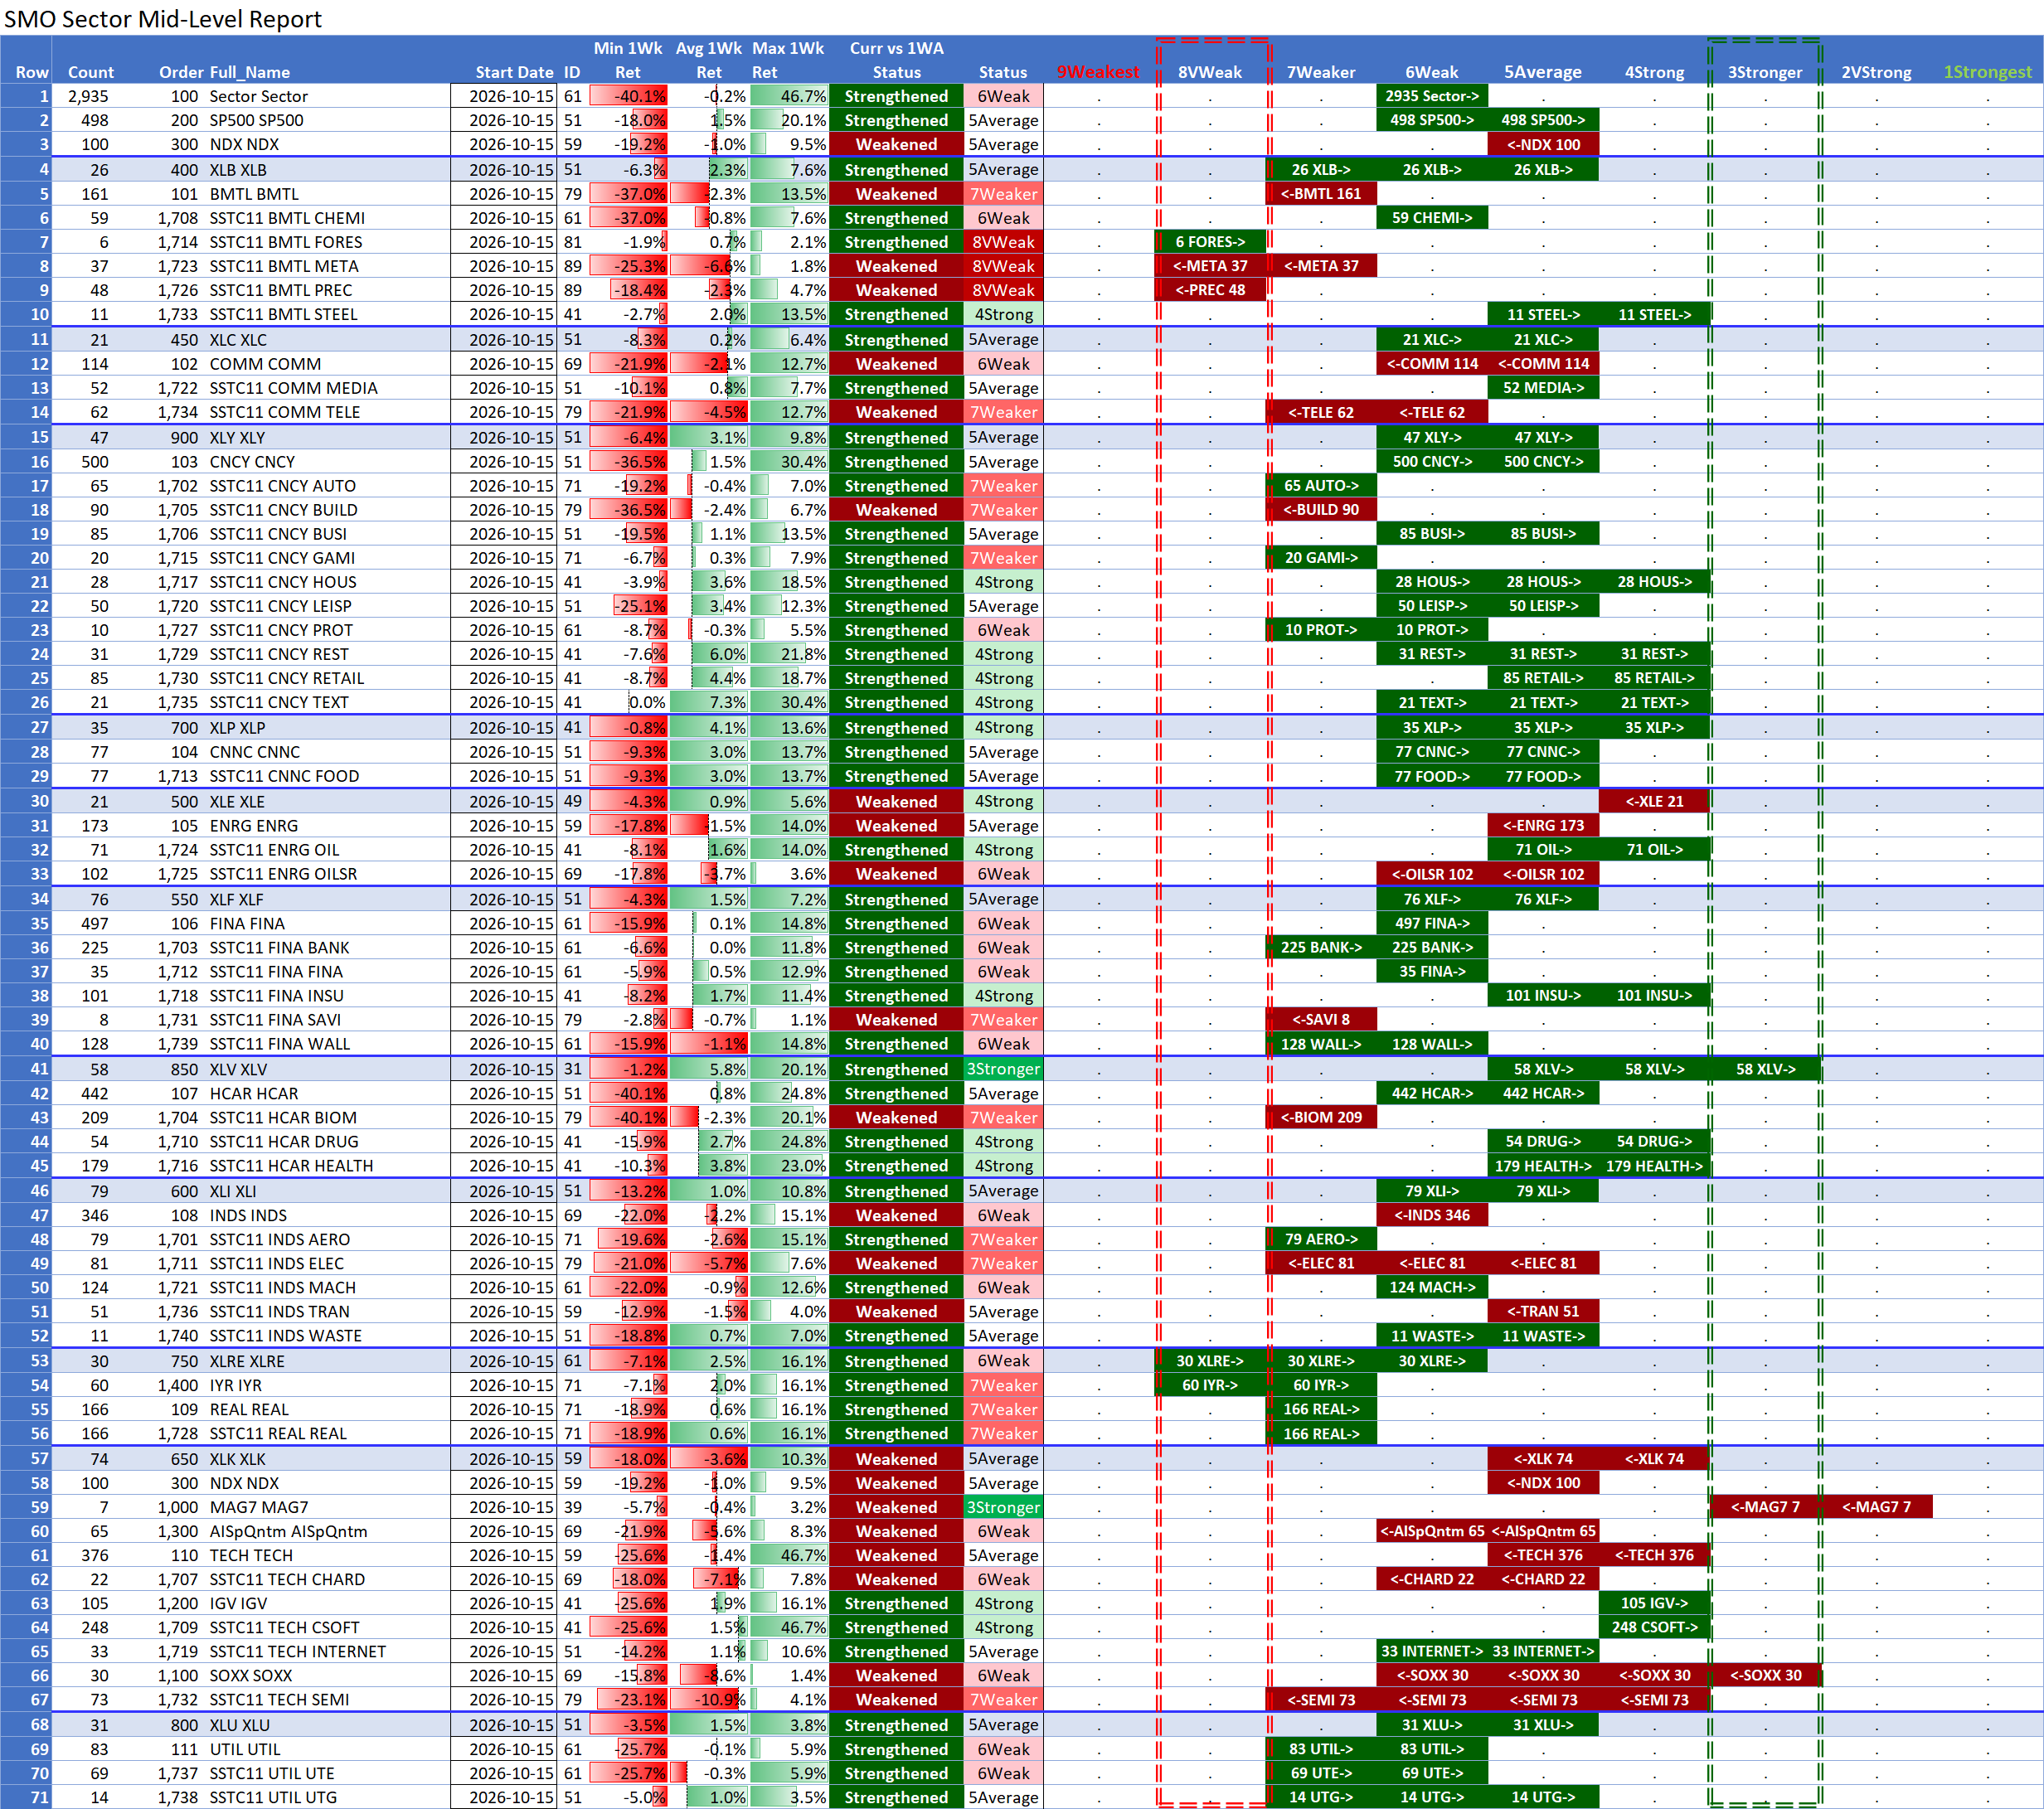
The Sector Mid-Level Report below lists the strength spectrum readings for all stocks and the major indexes S&P 500 and NDX, then lists the same for key sectors and sector ETFs.
MID-LEVEL SUMMARY (2026-10-15): 40 sub-industries | Strongest 4Strong = STEEL (BMTL), HOUS (CNCY), REST (CNCY), RETAIL (CNCY), TEXT (CNCY), OIL (ENRG), INSU (FINA), DRUG (HCAR), HEALTH (HCAR), CSOFT (TECH) | Weakest 8VWeak = FORES (BMTL), META (BMTL), PREC (BMTL) | 29 strengthened / 11 weakened / 0 unchanged vs prior week.1-WK AVG RETURN: Best TEXT +7.3%, REST +6.0%, RETAIL +4.4% | Worst SEMI -10.9%, CHARD -7.1%, META -6.6%.VS PARENT SECTOR: Standouts (2+ levels stronger) STEEL 4Strong vs BMTL 7Weaker, INSU 4Strong vs FINA 6Weak | Laggards (2+ levels weaker) AUTO 7Weaker vs CNCY 5Average, BUILD 7Weaker vs CNCY 5Average, GAMI 7Weaker vs CNCY 5Average, BIOM 7Weaker vs HCAR 5Average, SEMI 7Weaker vs TECH 5Average.SPECIALTY GROUPS: IYR 7Weaker↑, MAG7 3Stronger↓, AISpQntm 6Weak↓, IGV 4Strong↑, SOXX 6Weak↓ (↑ strengthened, ↓ weakened vs prior week).
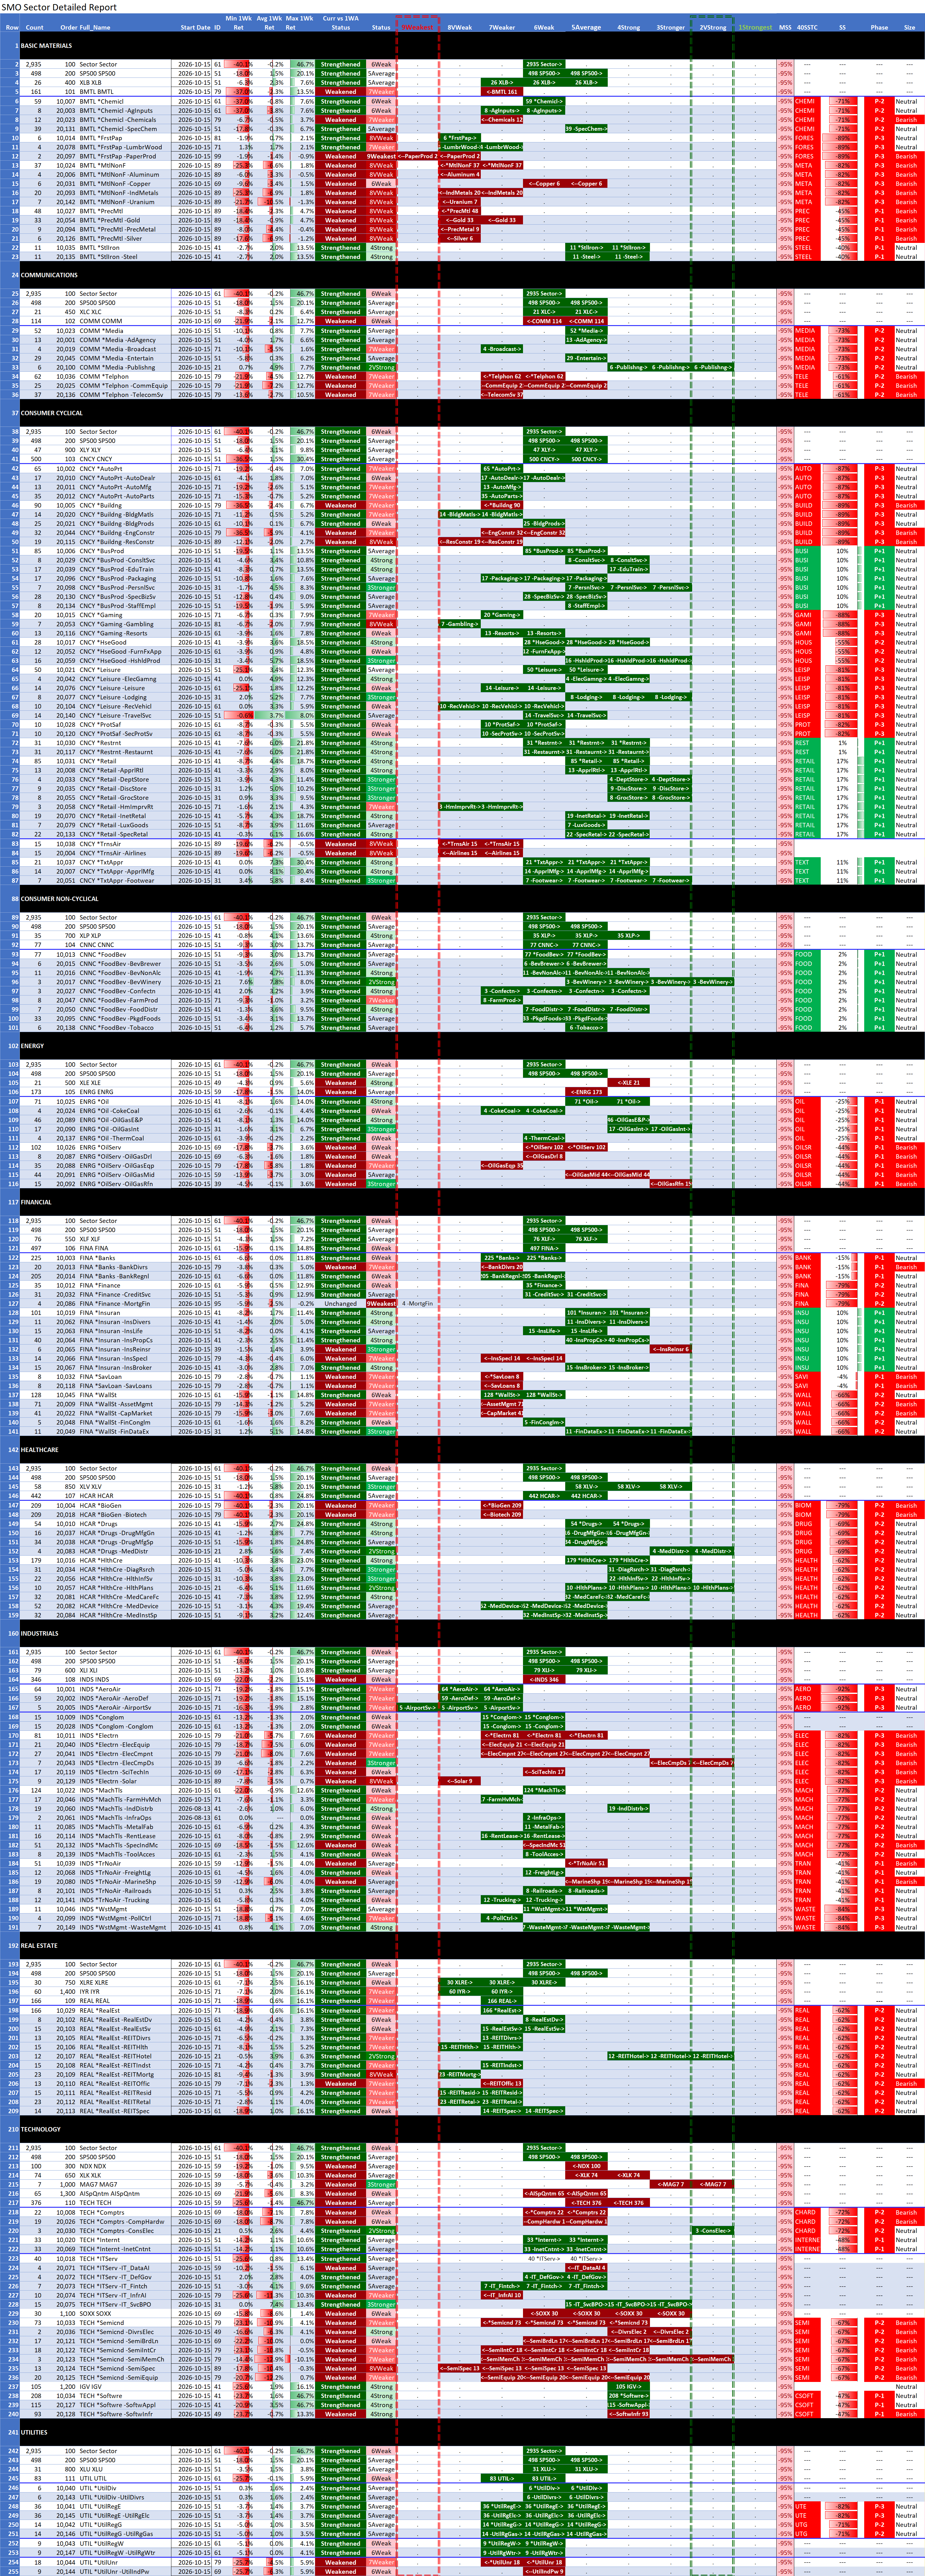
The Sector Detailed Report below expands upon the Sector Mid-Level Report by overlaying the Sector Strength Terrain Clock Industry Strength Scores and adding industry and sub-industry detail.
The following provide strongest to weakest ranked views of the 11 Sector ETFs, 46 industries, and 149 sub-industries.
Sector ETFs Ranked Report
Nine of the 11 ETFs strengthened for the week with XLE Energy and XLK Technology the weakeners as XLV Healthcare takes over the strongest ranking at 3Stronger. XLRE Real Estate is weakest at 6Weak.
Industry Ranked Report
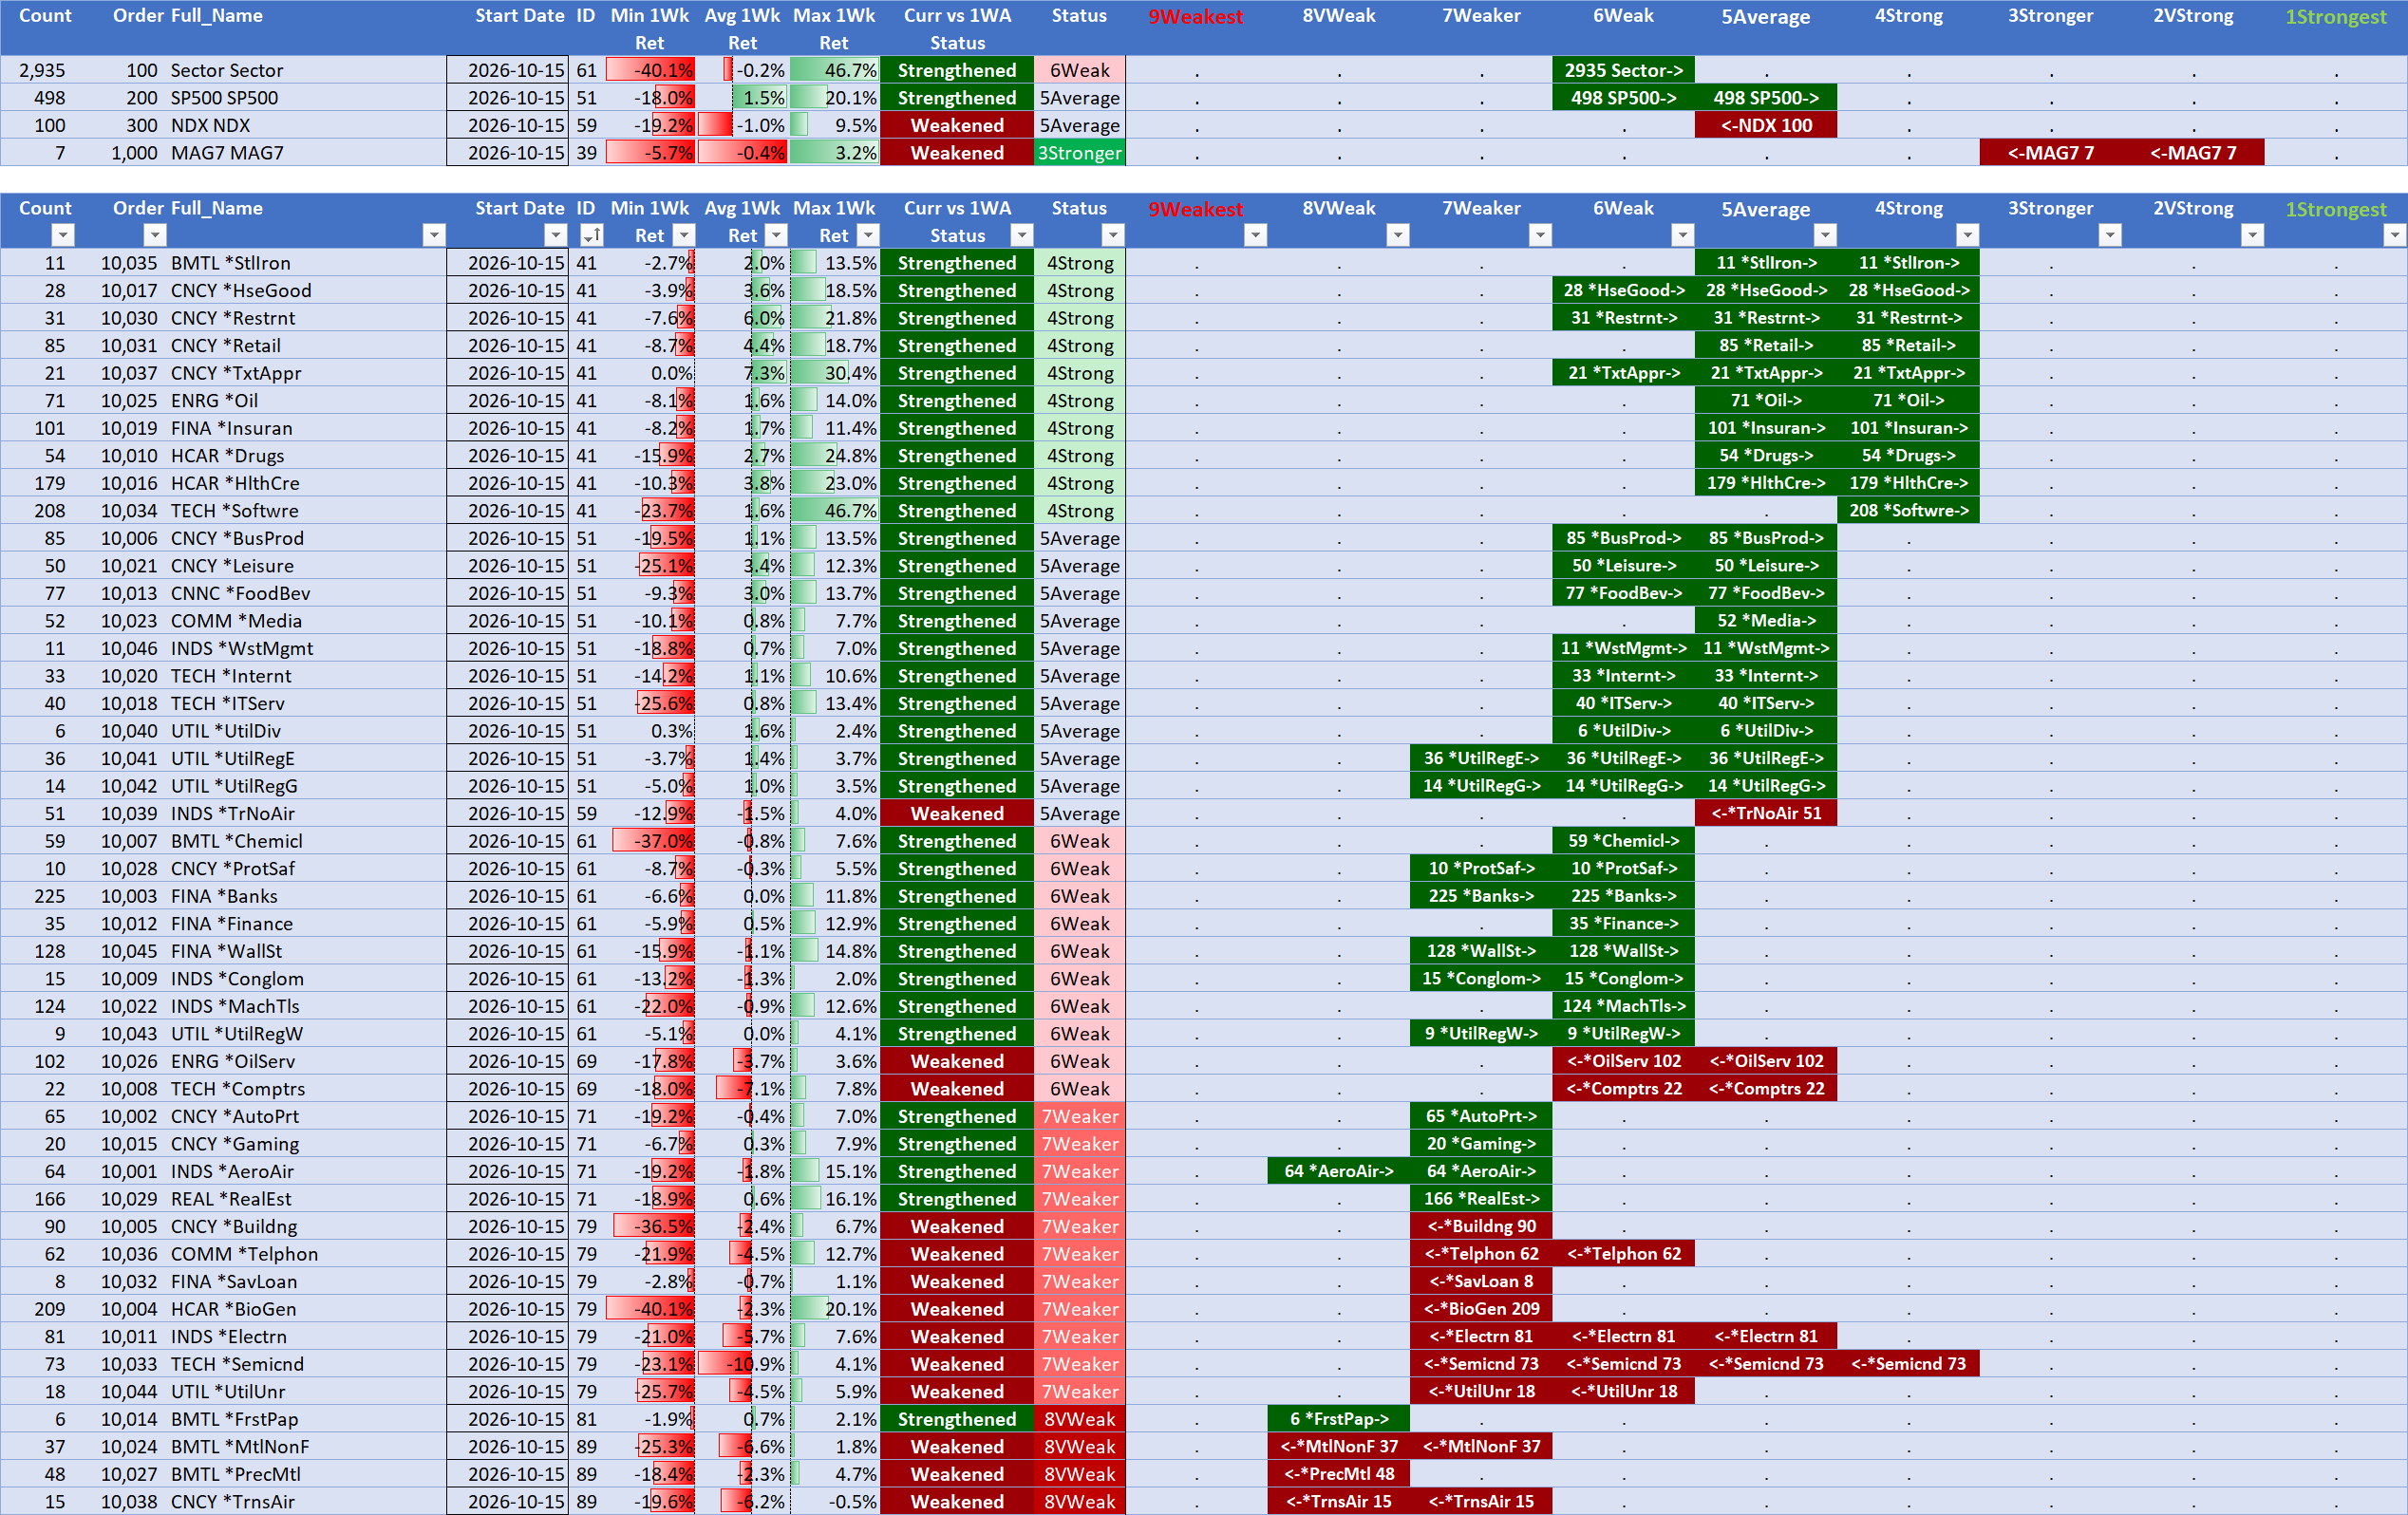
Strongest industries are 4Strong of which there are 10. Four 8Very Weak industries (Forest Paper, Metals Non-Ferrous, Precious Metals, and Transportation Airlines).
Sub-Industry Ranked Report, Strongest and Weakest Only
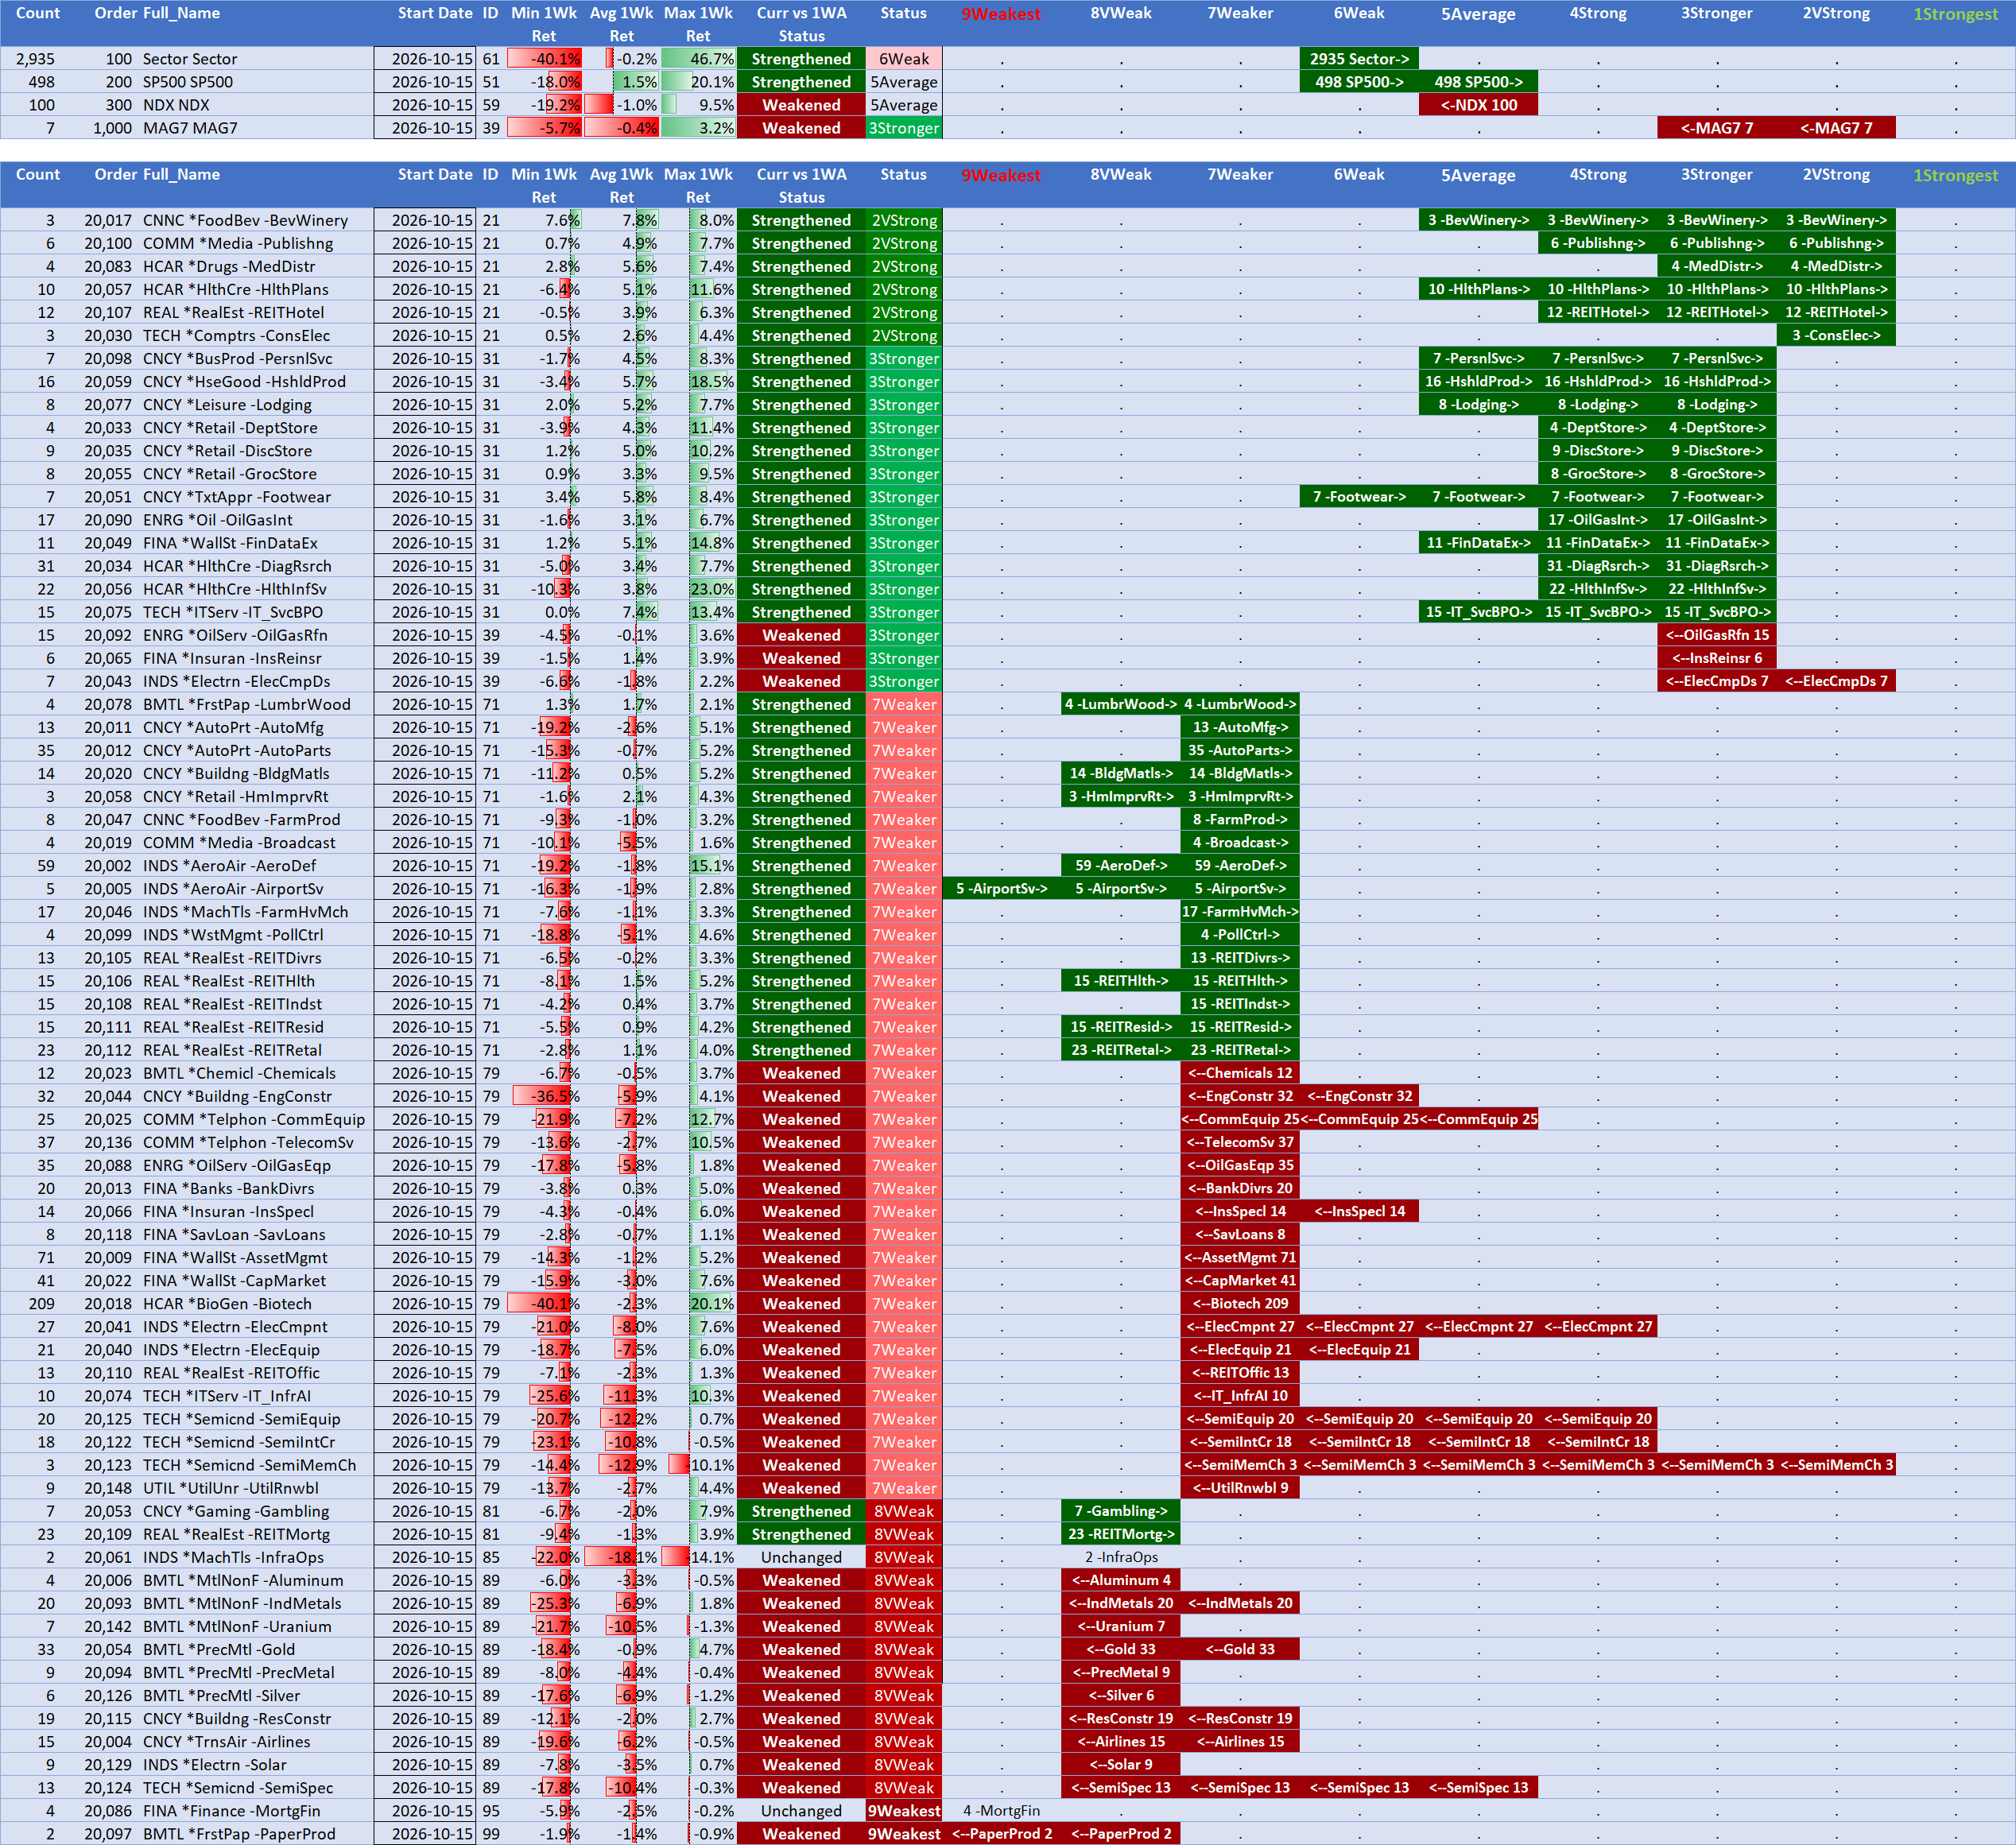
The sub-industries report shows only those ranked 3Stronger, 2Very Strong, 1Strongest, 7Weaker, 8Very Weak, and 9Weakest.
For educational purposes only. These are not stock or investment recommendations. See this disclaimer.