SMO Full Report Tue 2025-07-29 (Phase -1, Risk Off Early)
Market Summary
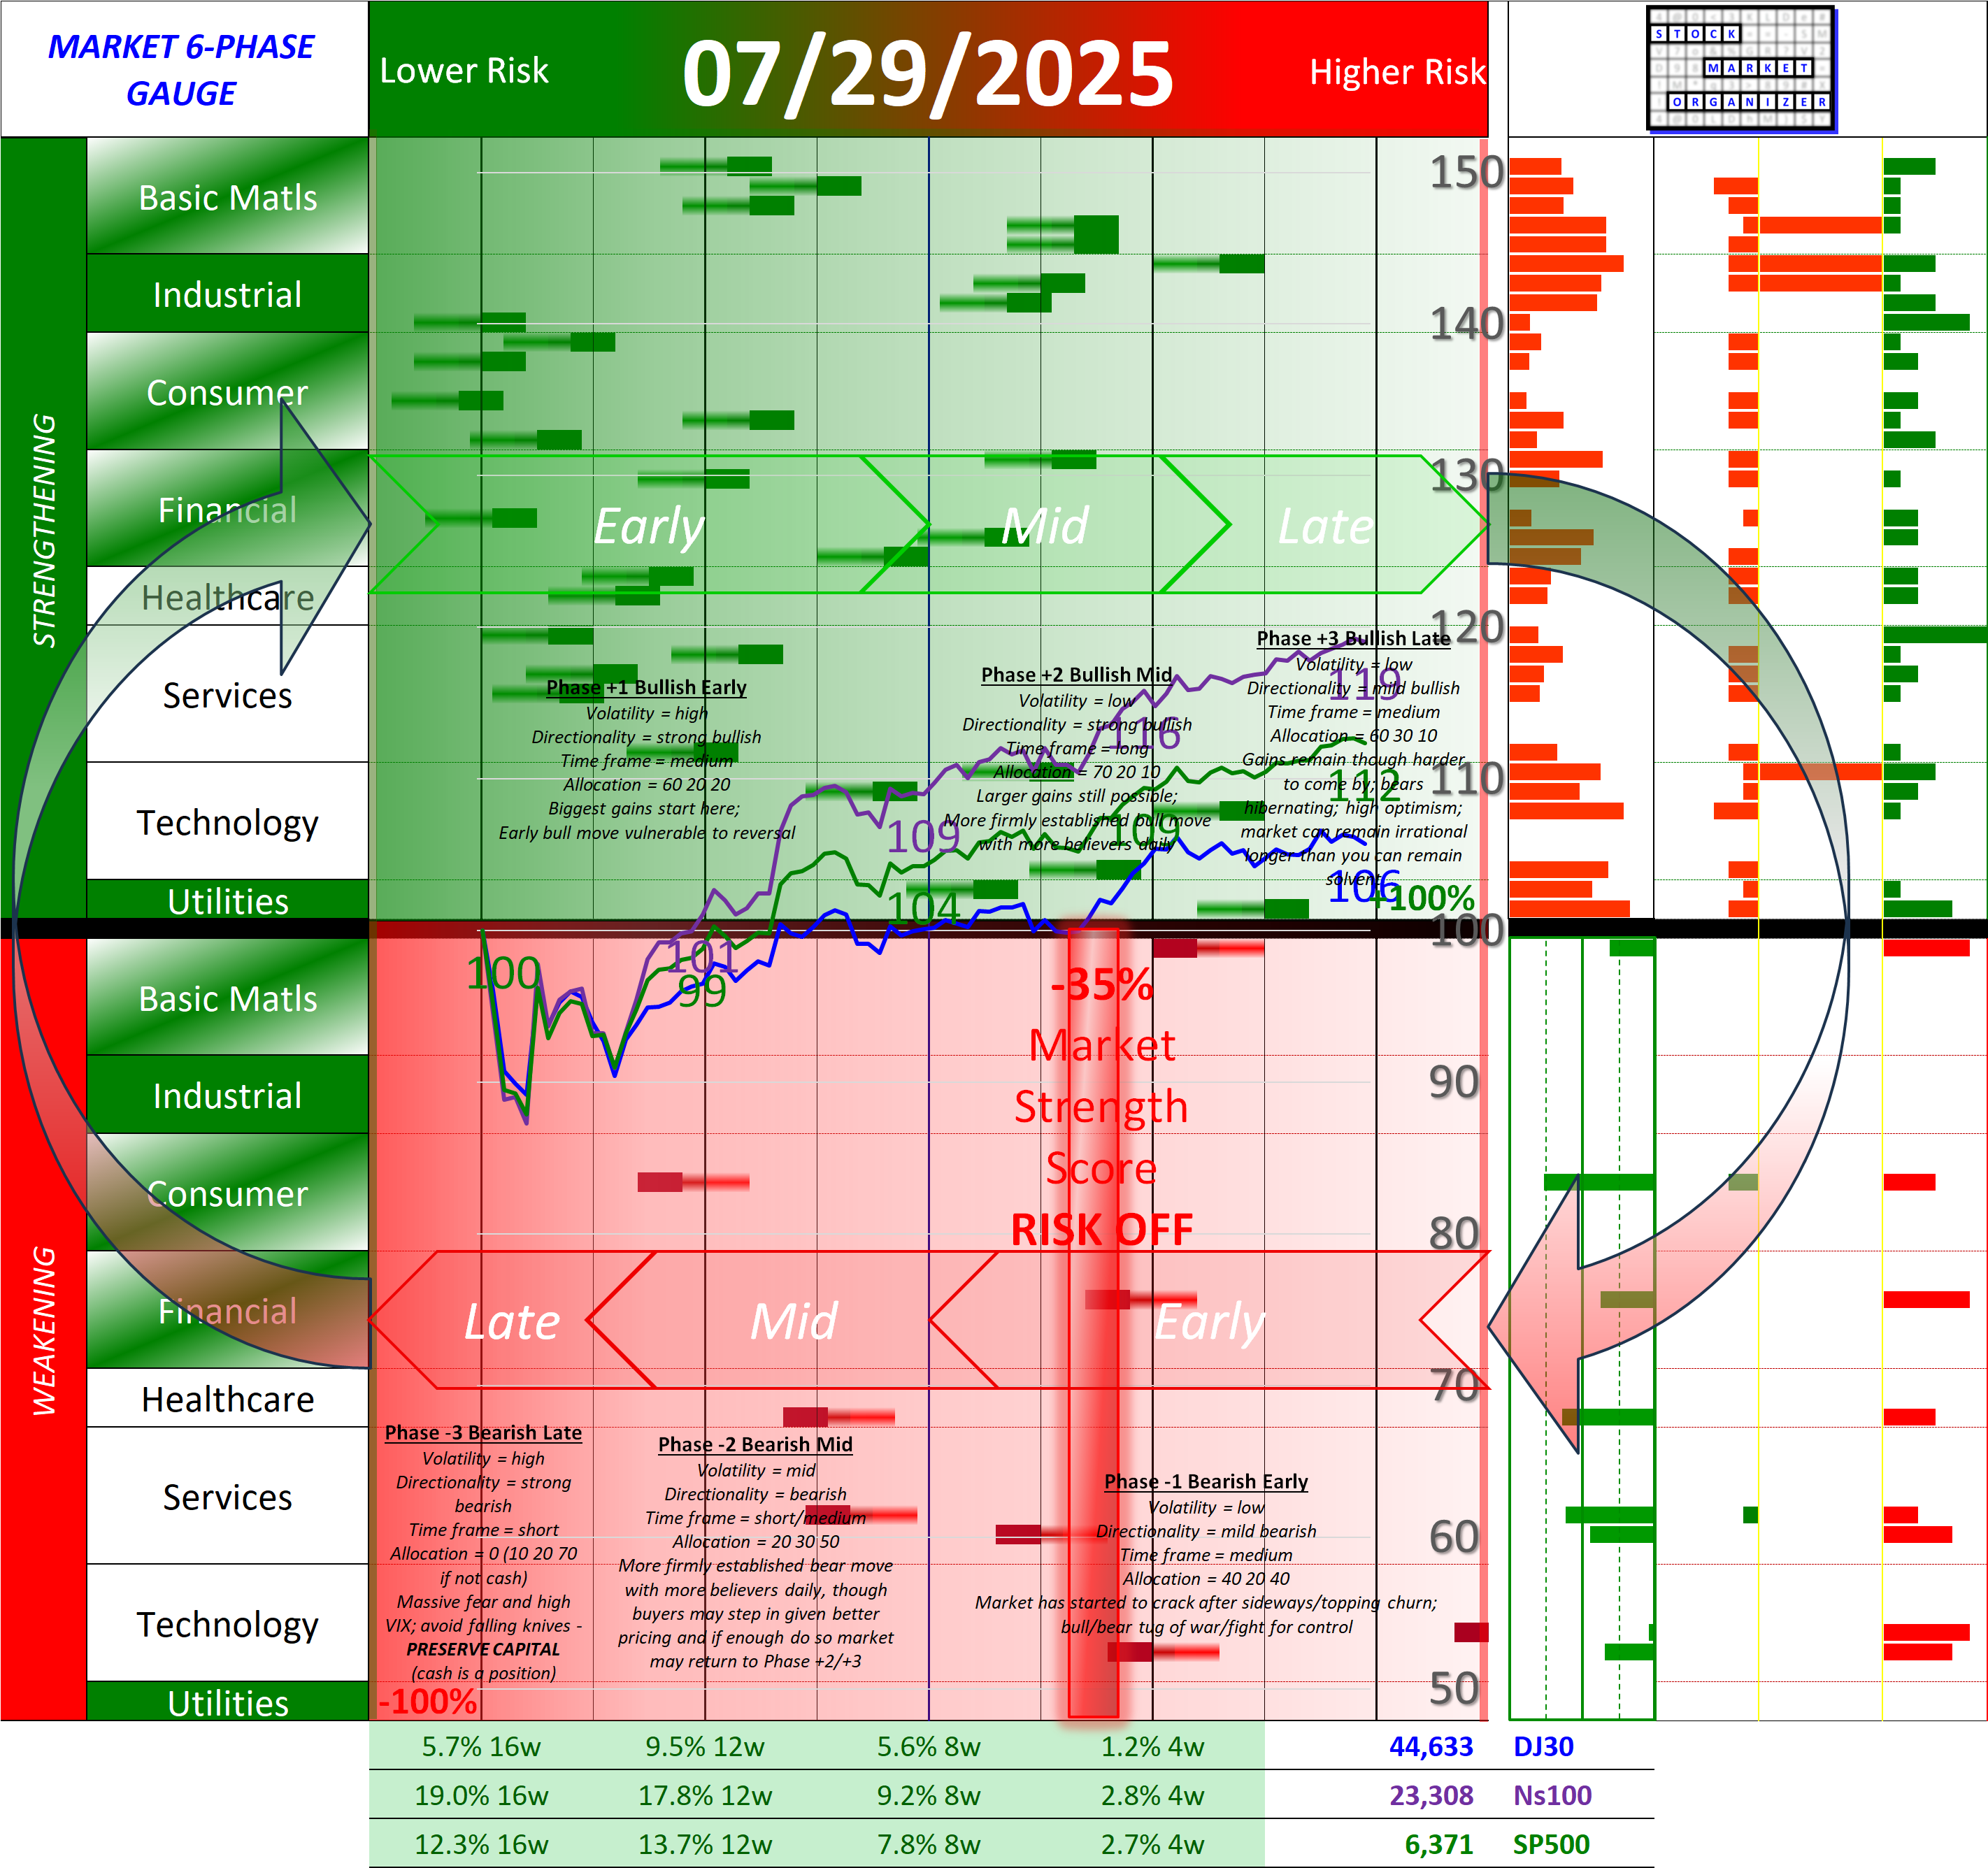
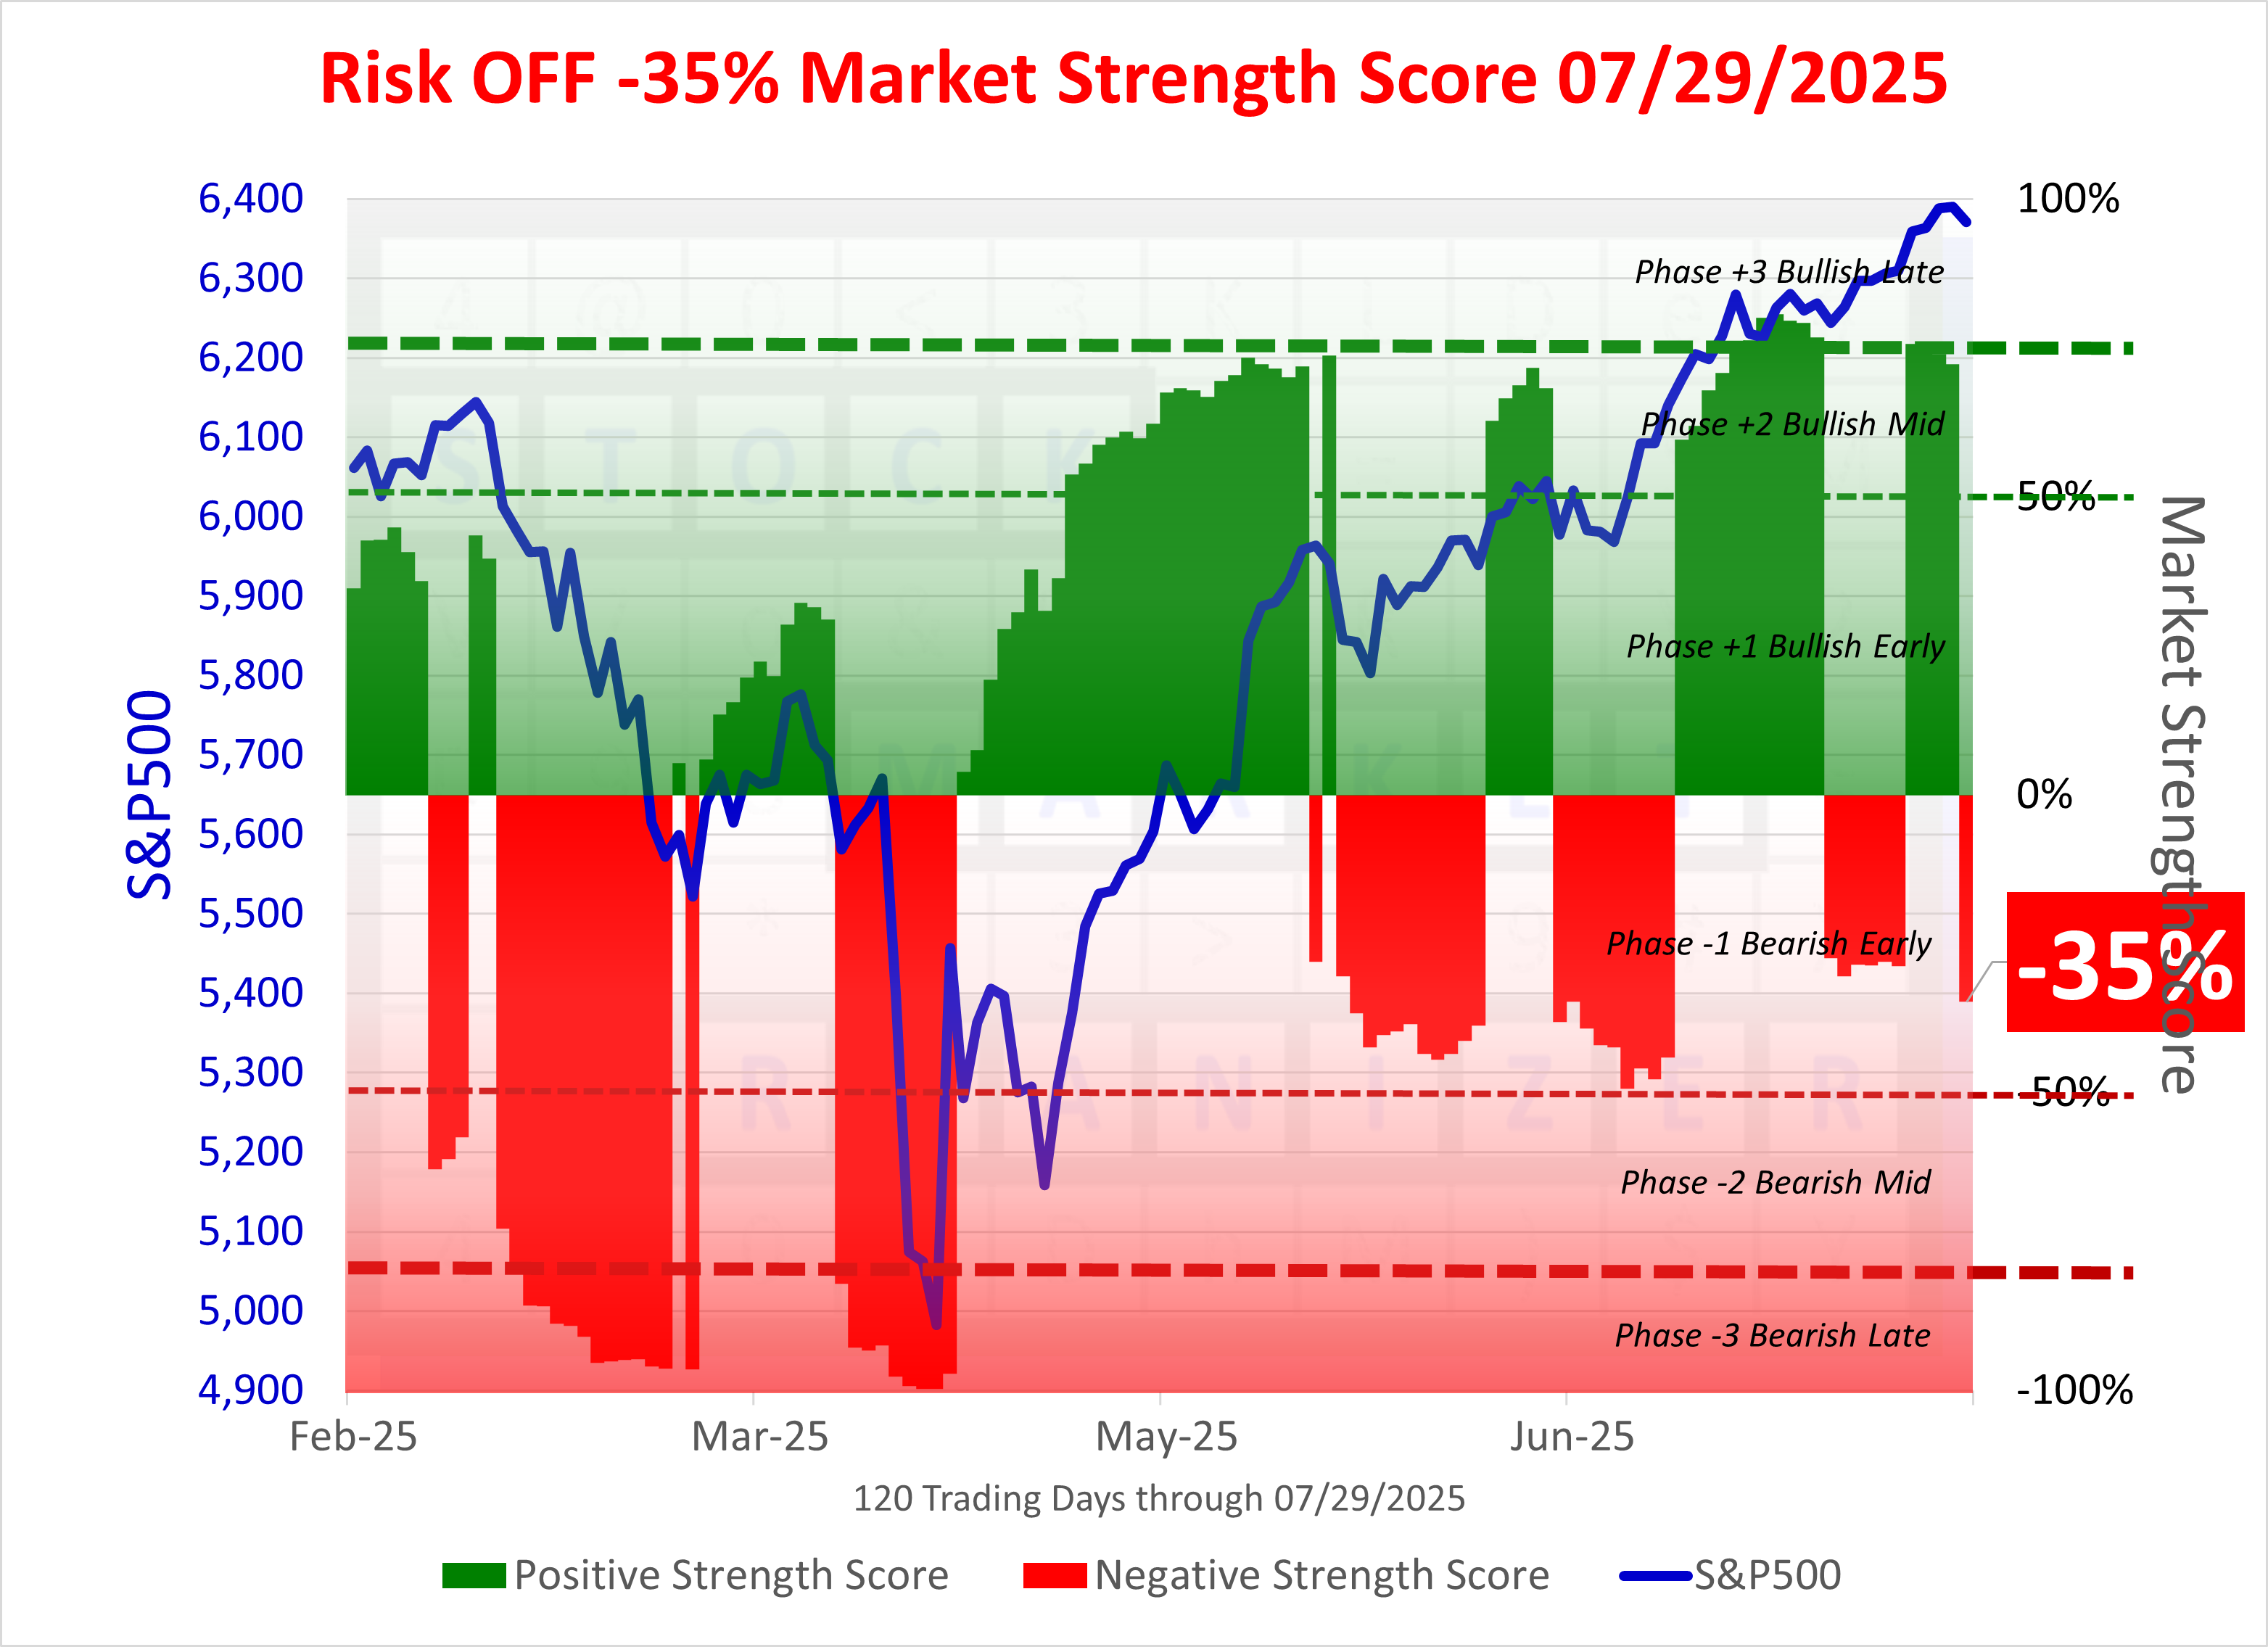
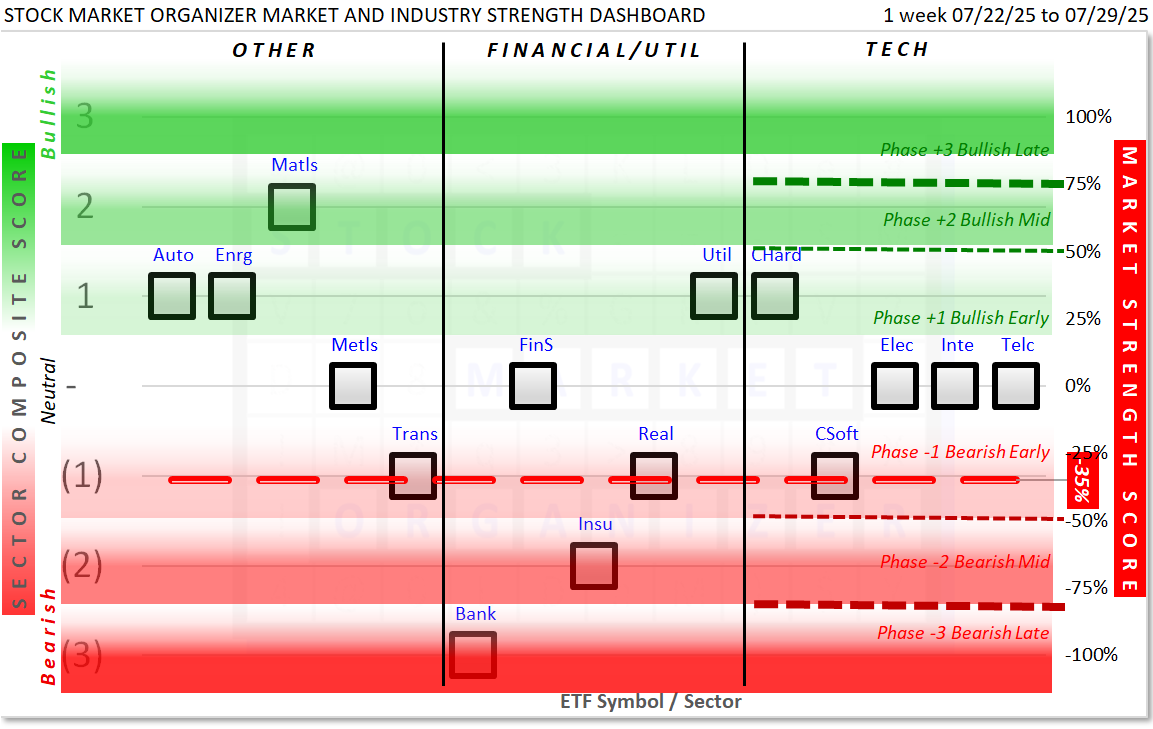
The Market 6-Phase Gauge + the following Market Strength Score = unique current market environment depiction.
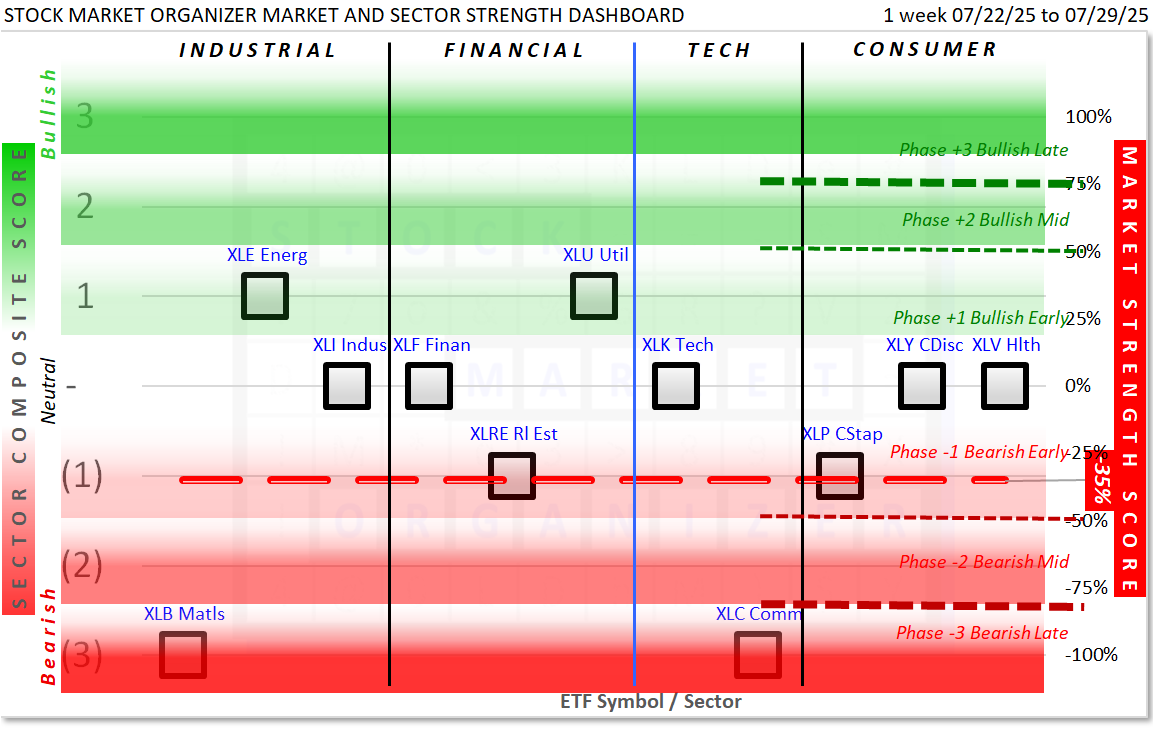
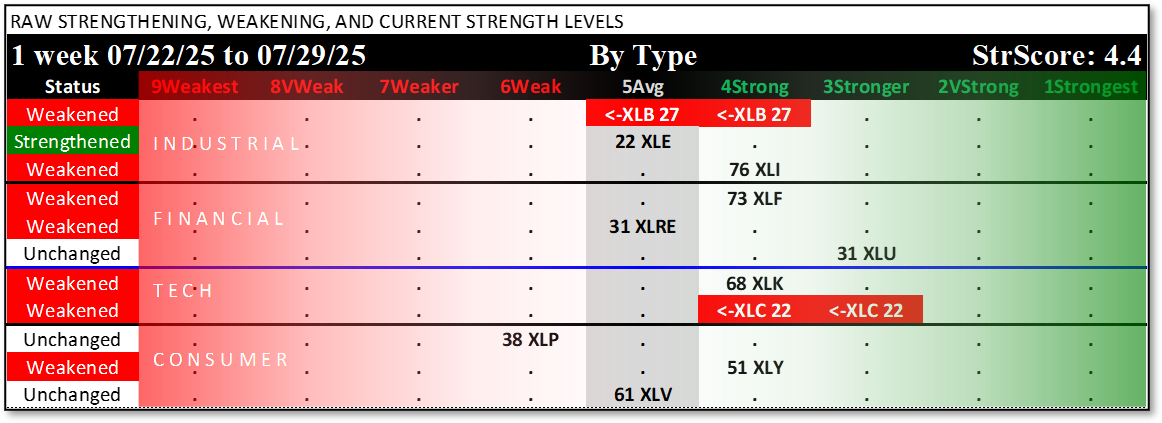
Sectors Summary
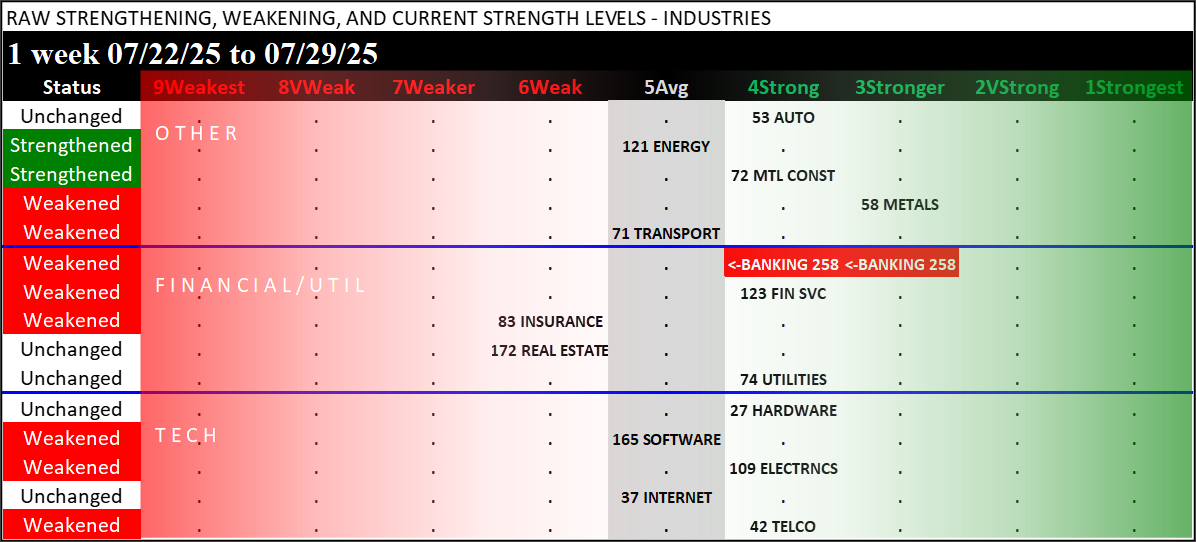
Select Industries Summary
Selected key industries are presented below in Dashboard and Spectrum format similar to the ETFs/Sectors summary above. The underlying information here is the full component stock populations, not just the 500 ETF stocks. Thus, it provides a broader view of underlying strength and weakness and should be used to enhance the ETF Sector insights.
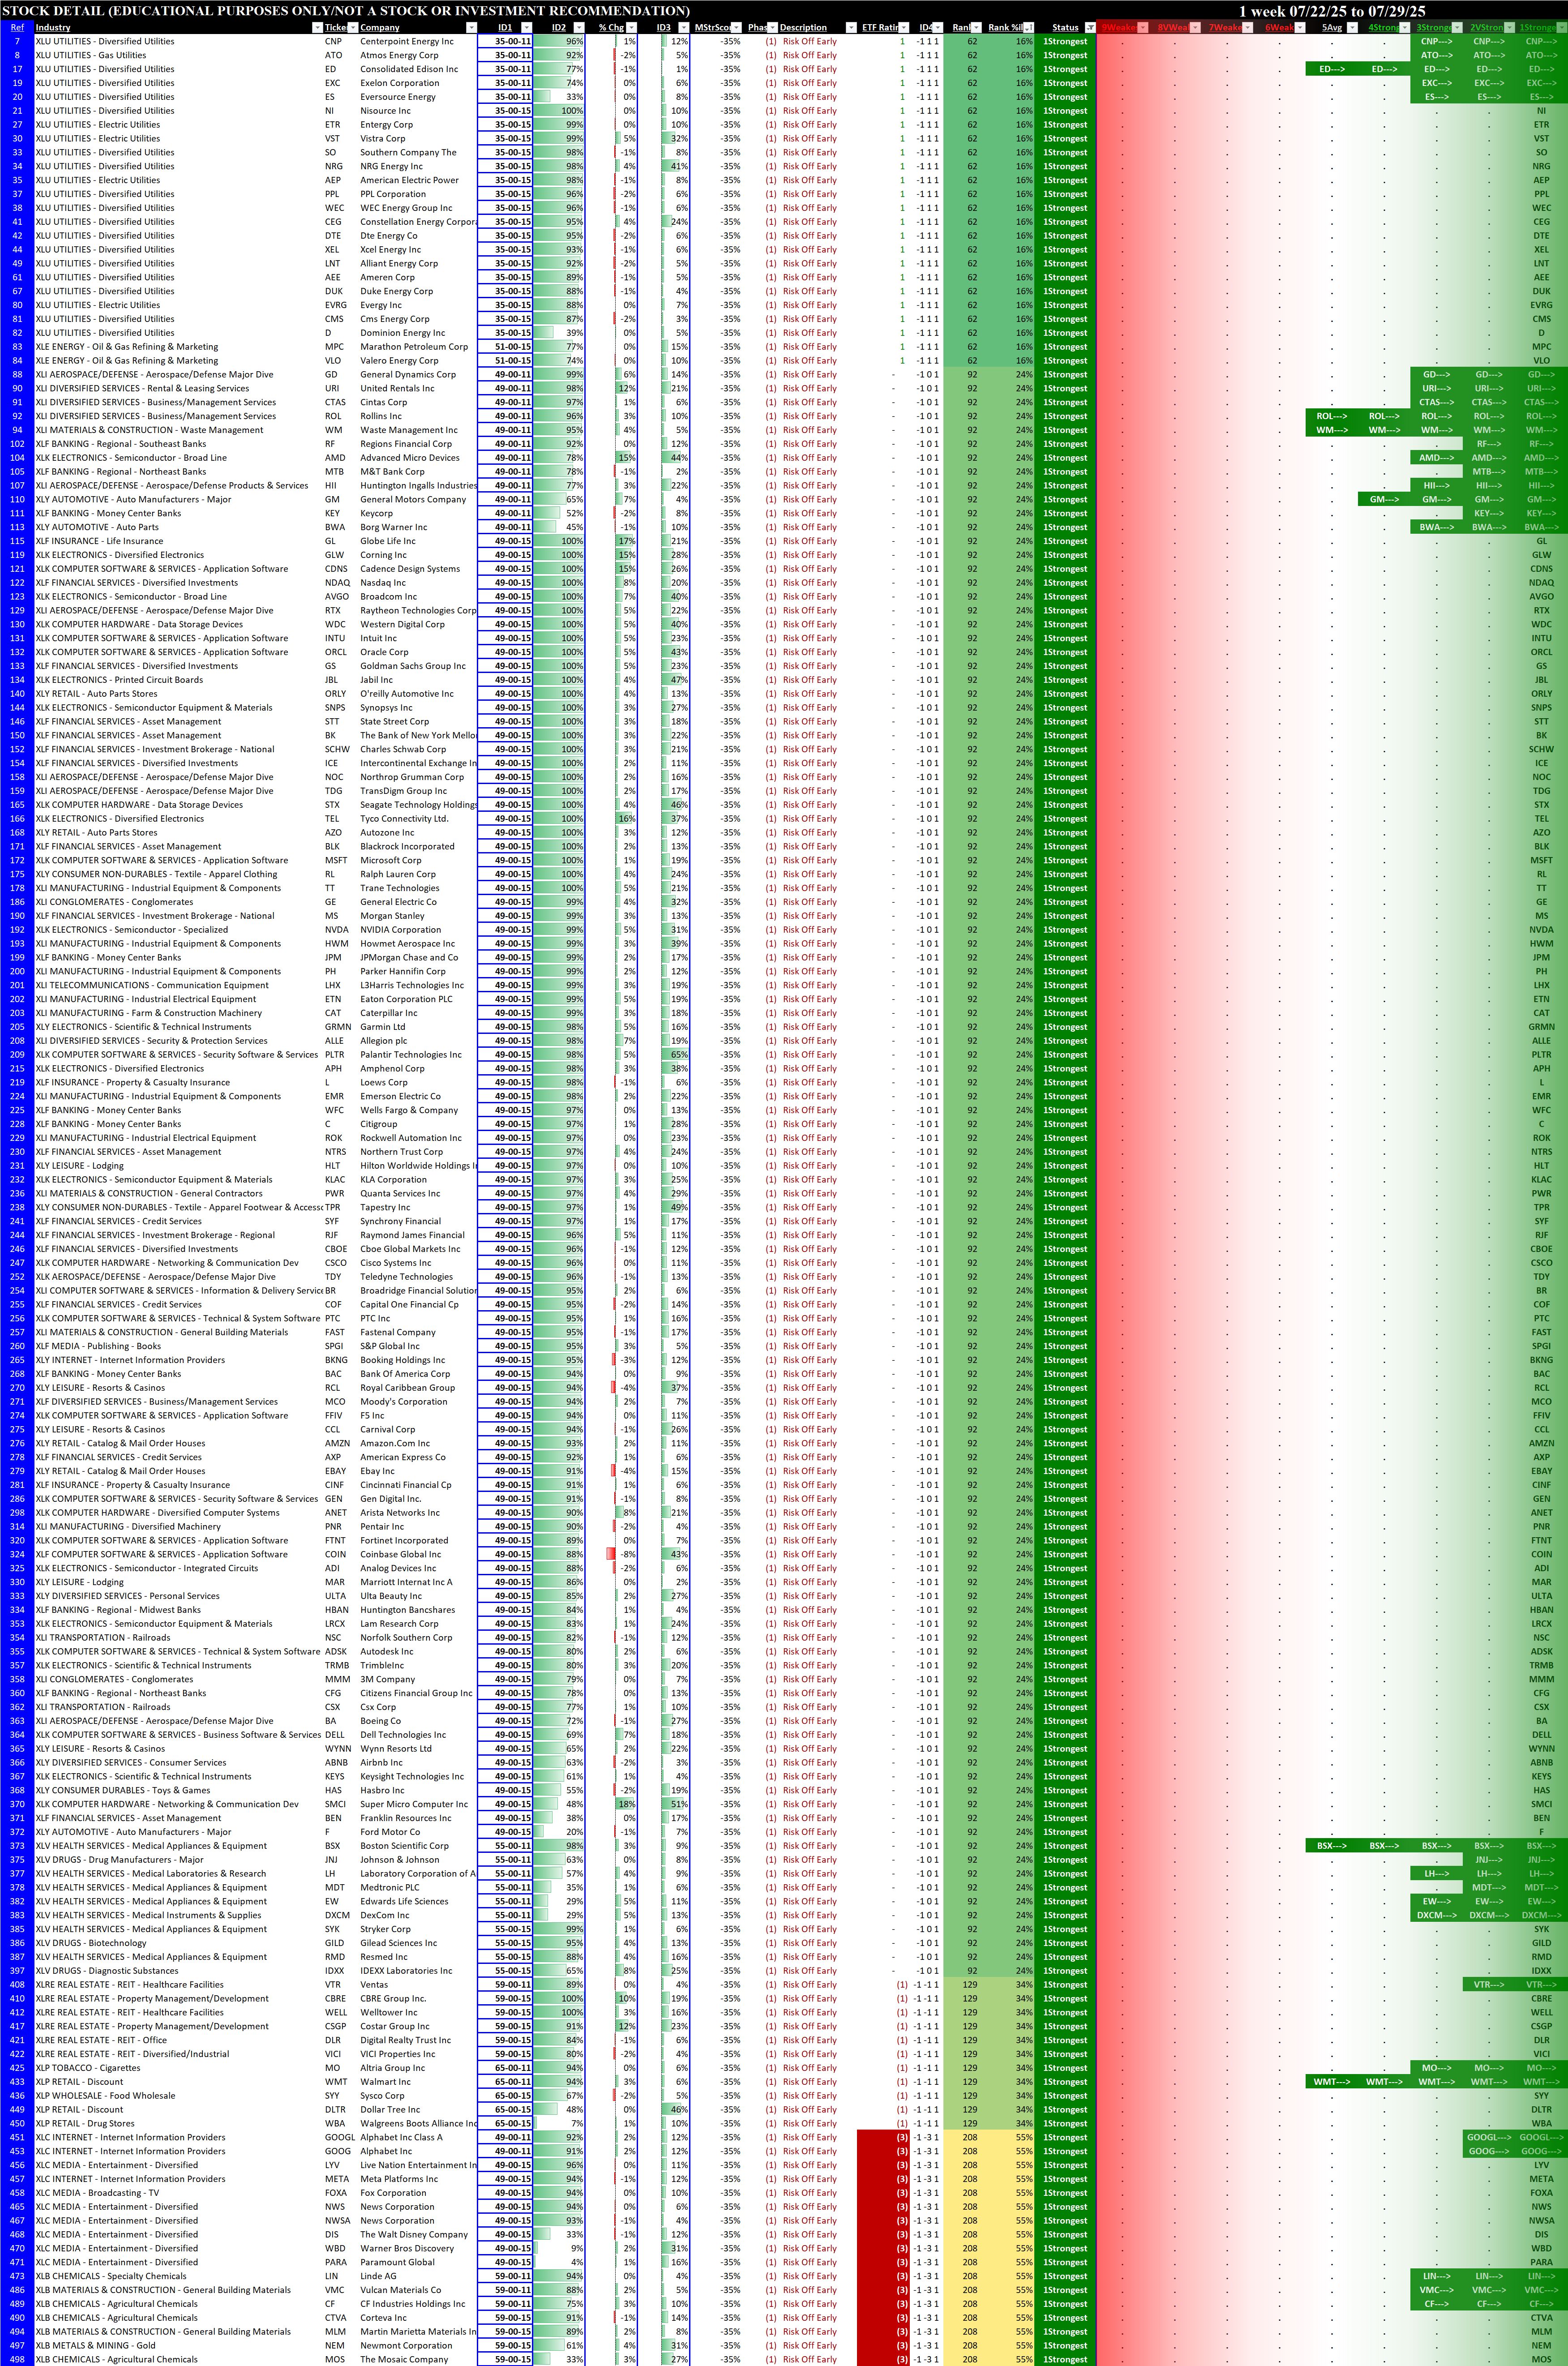
Stocks Summary
Below are the stocks rated 1Strongest (for long possibilities), 5Average (for non-directional option possibilities), and 9Weakest (for short possibilities).
1Strongest Stocks
Potentially stack strength with these candidates.
5Average Stocks
Potentially deploy neutral options strategies with these candidates.
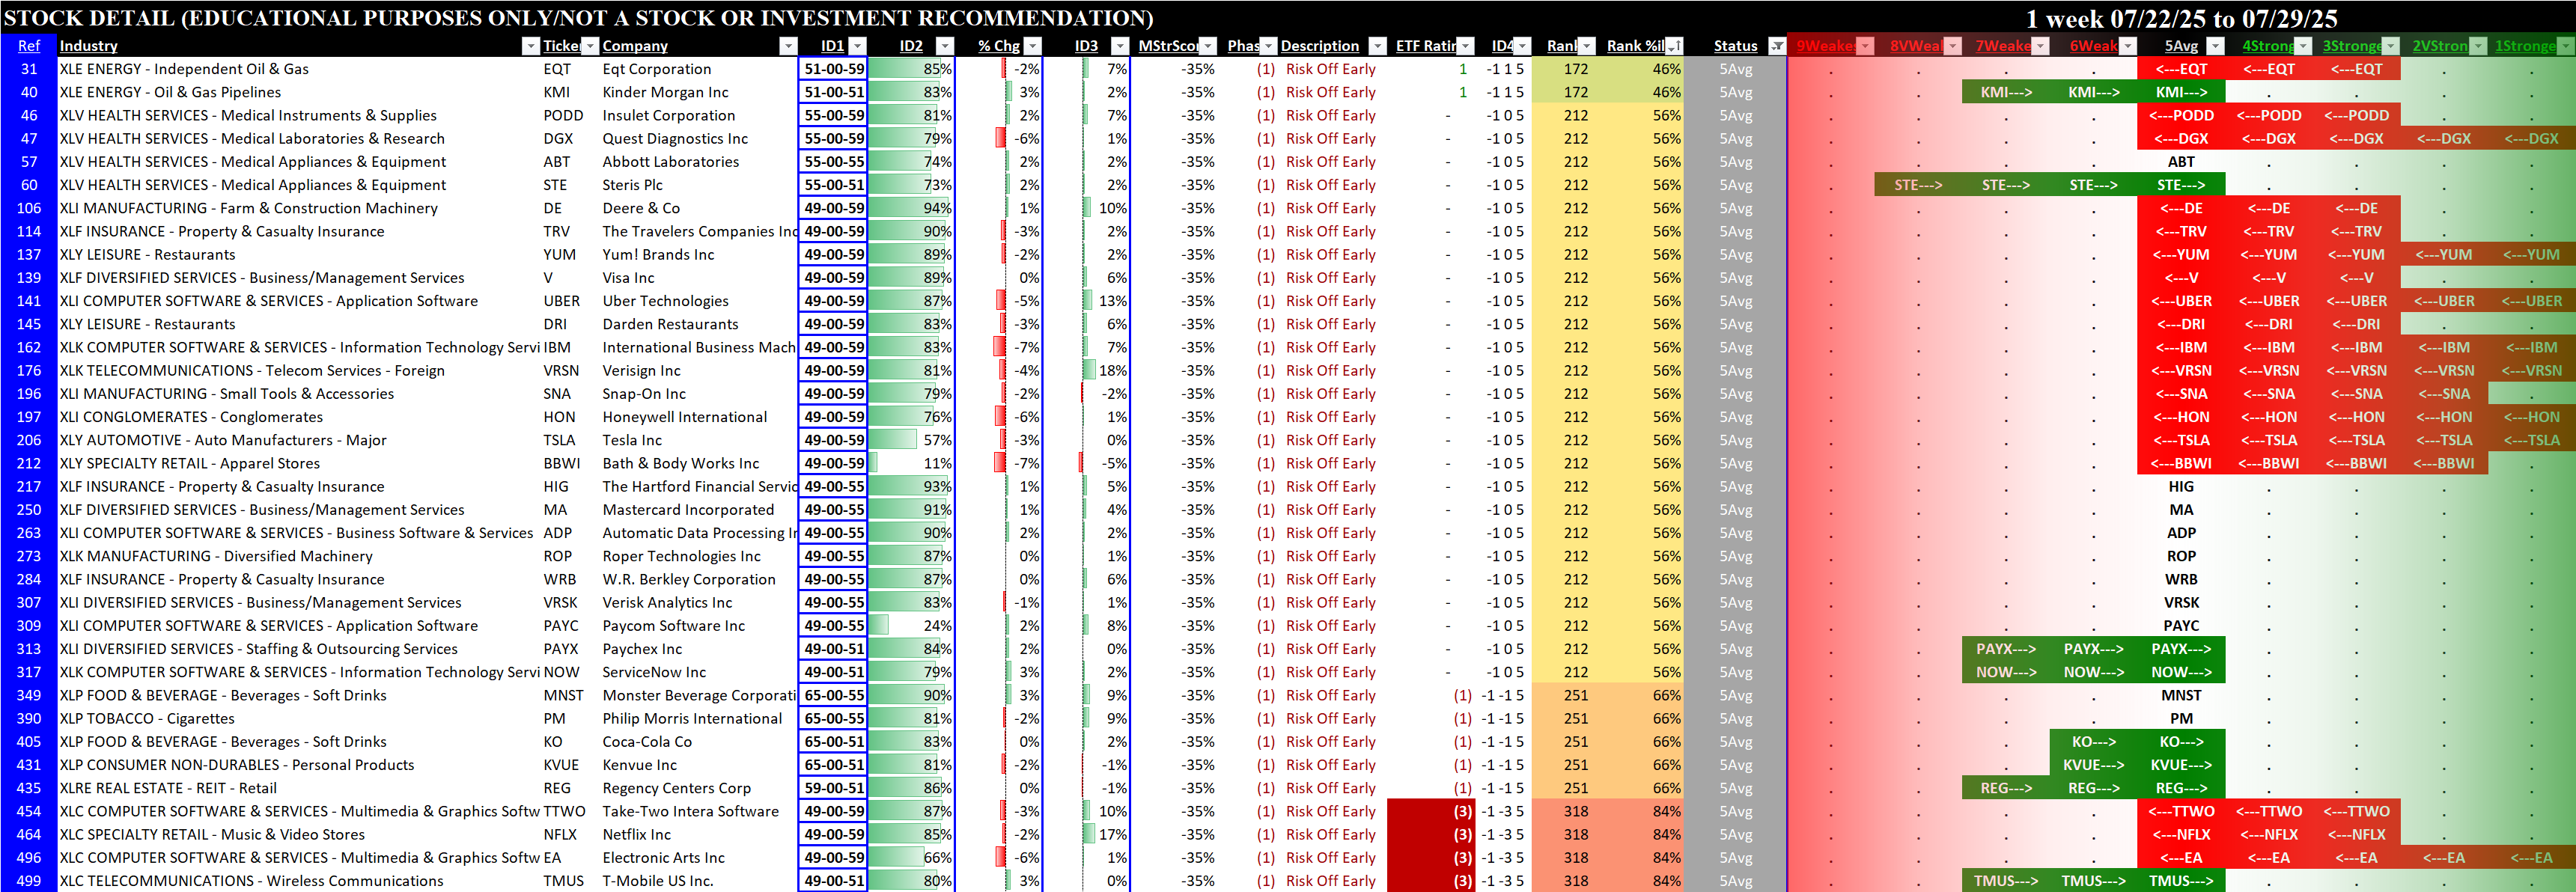
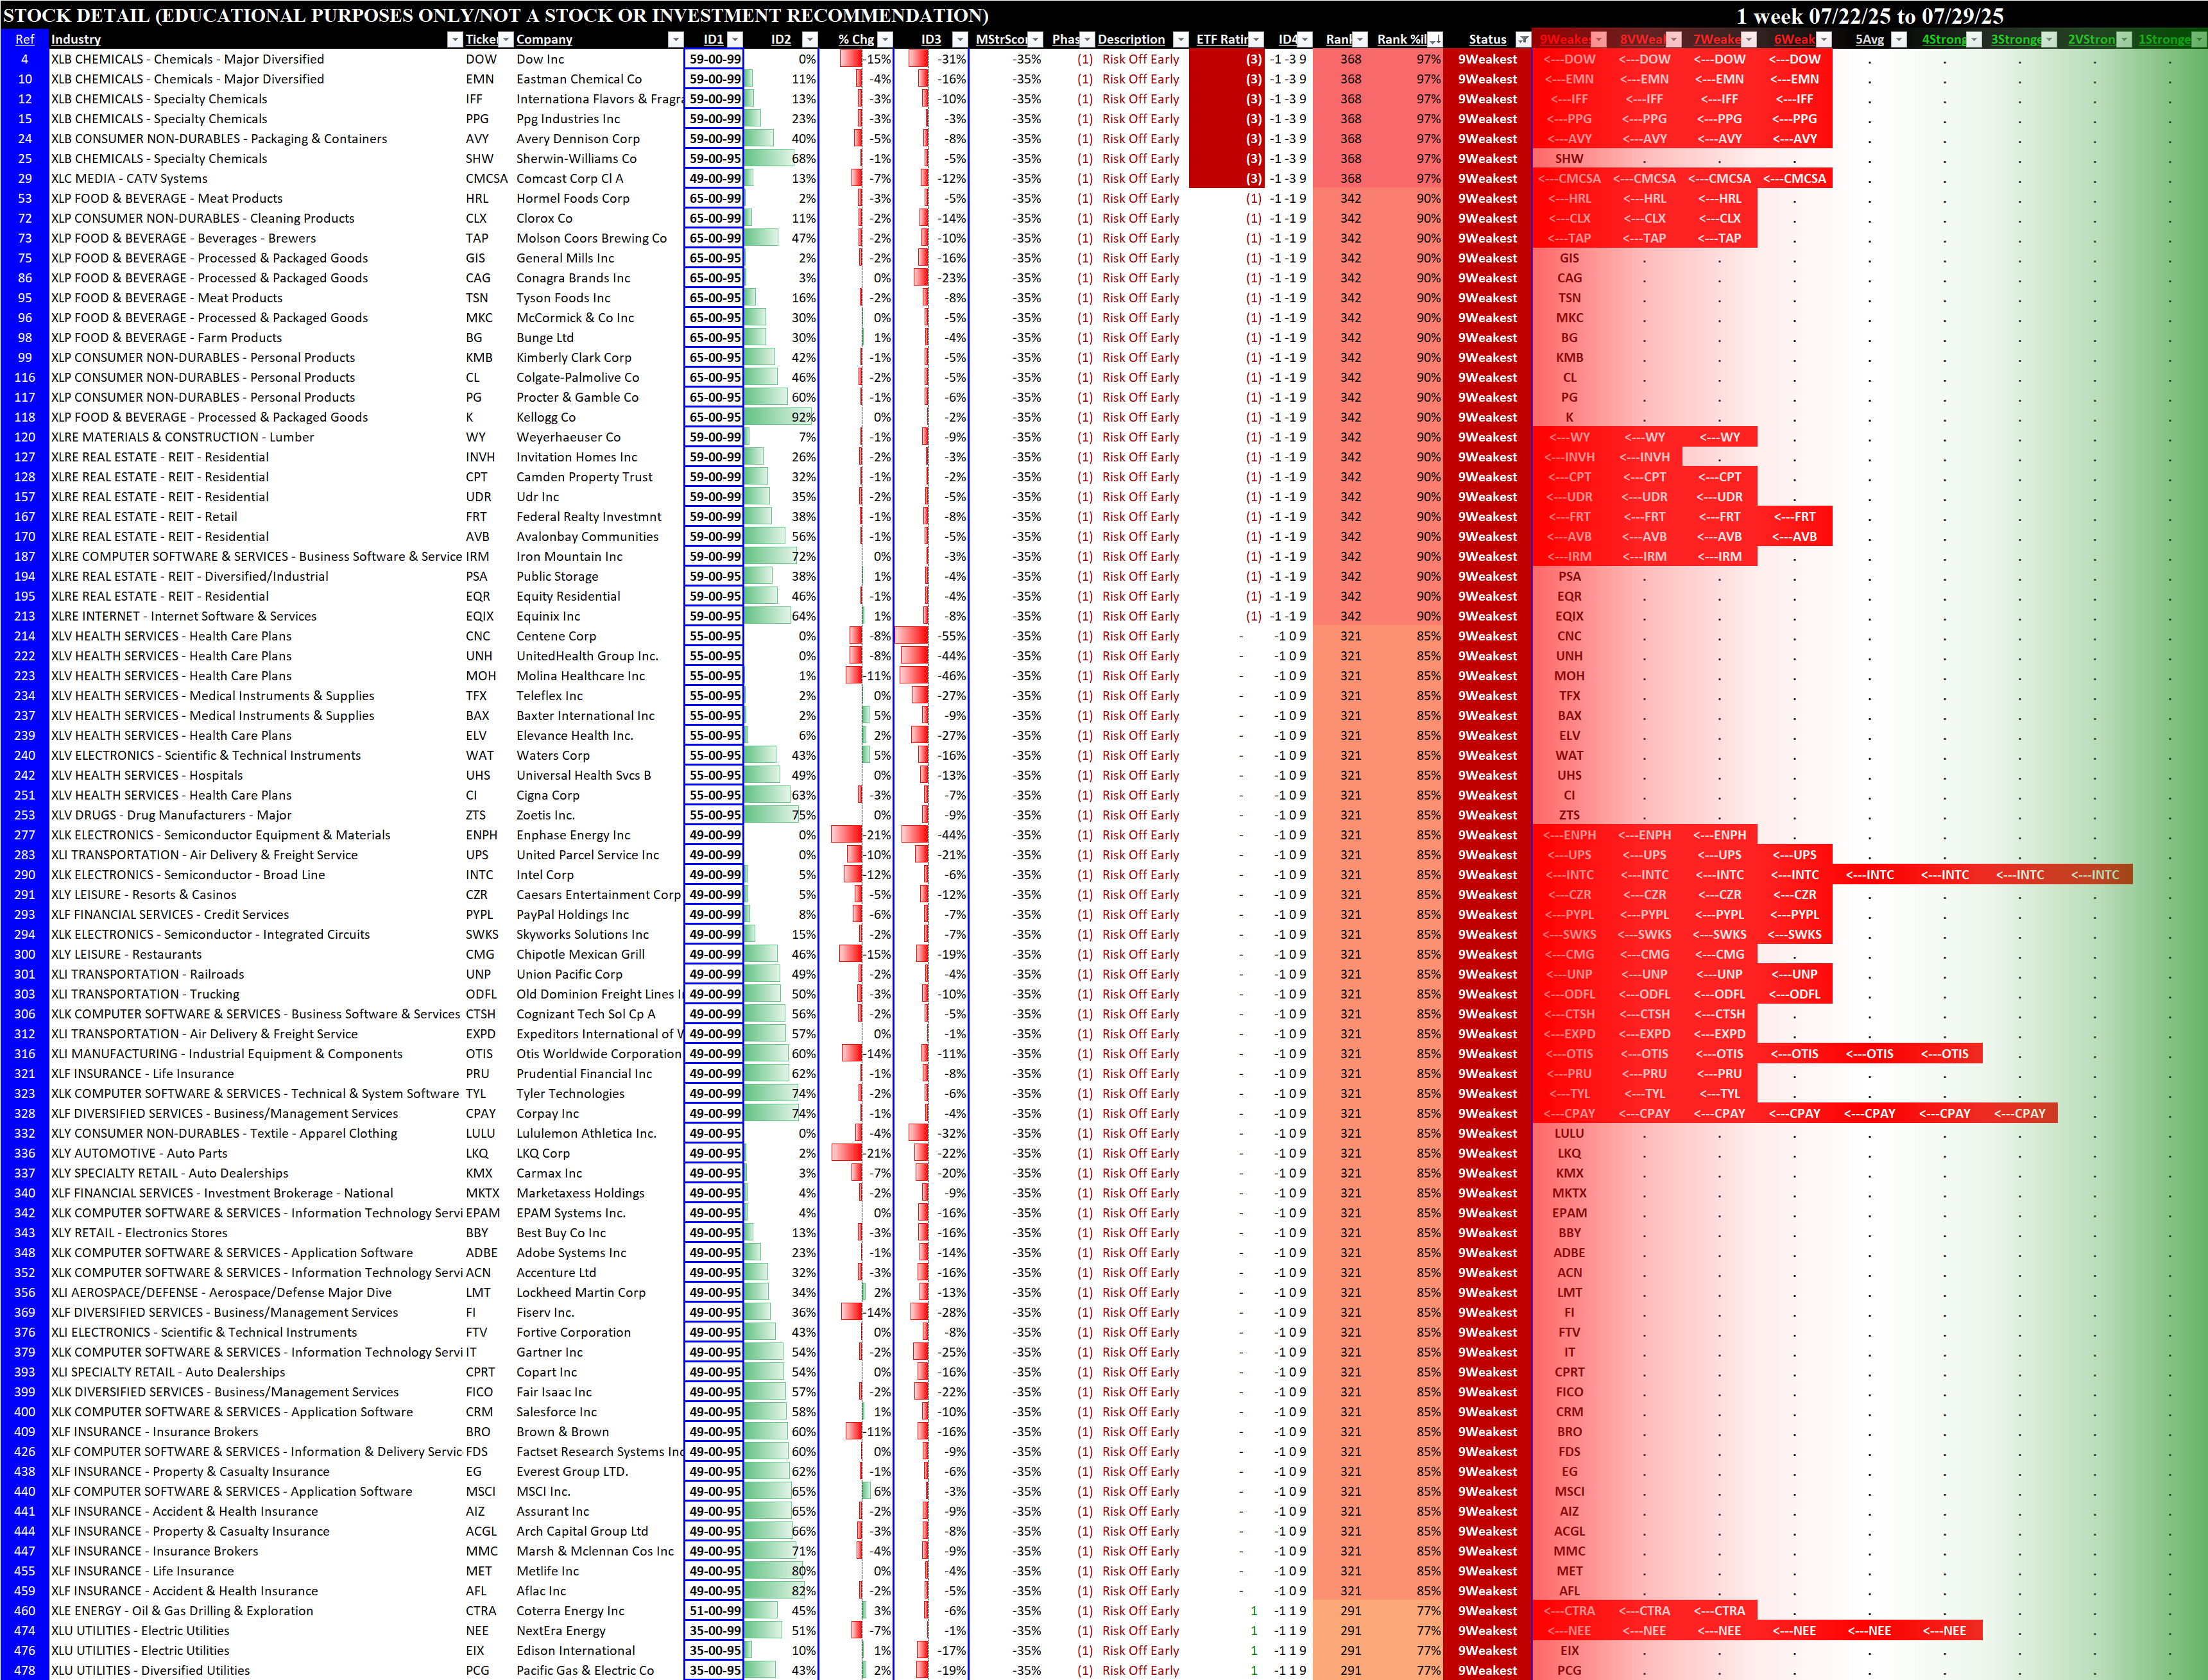
9Weakest Stocks
Potentially stack weakness with these candidates.
Underlying Key Concepts
🔹 Signal duration depends solely on objective market action measurement.
🔹 It conveys what “is” – not “why,” or for how long.
🔹 It is an objective, repeatable, and reliable tool to
- enforce discipline,
- prevent unforced errors,
- eliminate emotion and confusion, and
- make sound decisions in all market environments.
This enforced discipline ensures new positions are opened only in the direction of market strengthening or weakening.
If strengthening, only new long positions can be opened.
If weakening, only new short positions can be opened.
Why? Trend respect.
Market weakening does not mean “exit existing long positions.” Only potential new positions are impacted by the critical question of “what is the market doing now?”
Existing open positions are closed when their behavior negates the entry thesis.