SMO Exclusive: Strength Report Group 3 2024-03-15
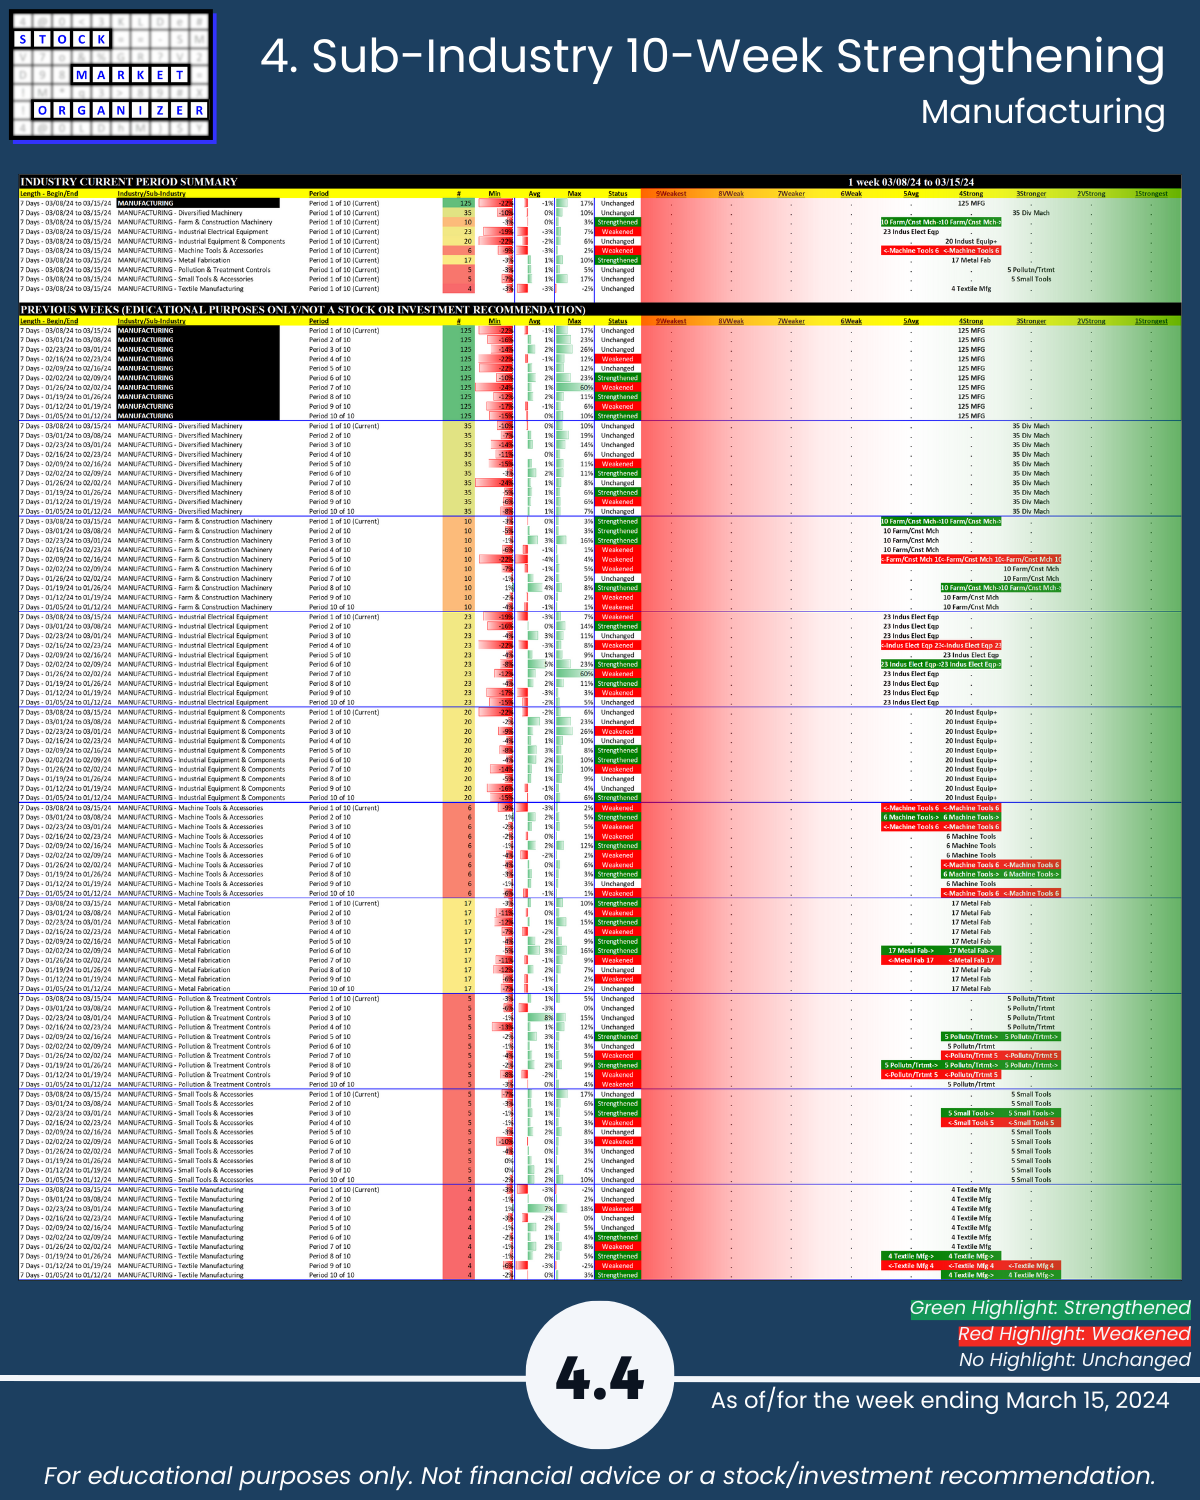
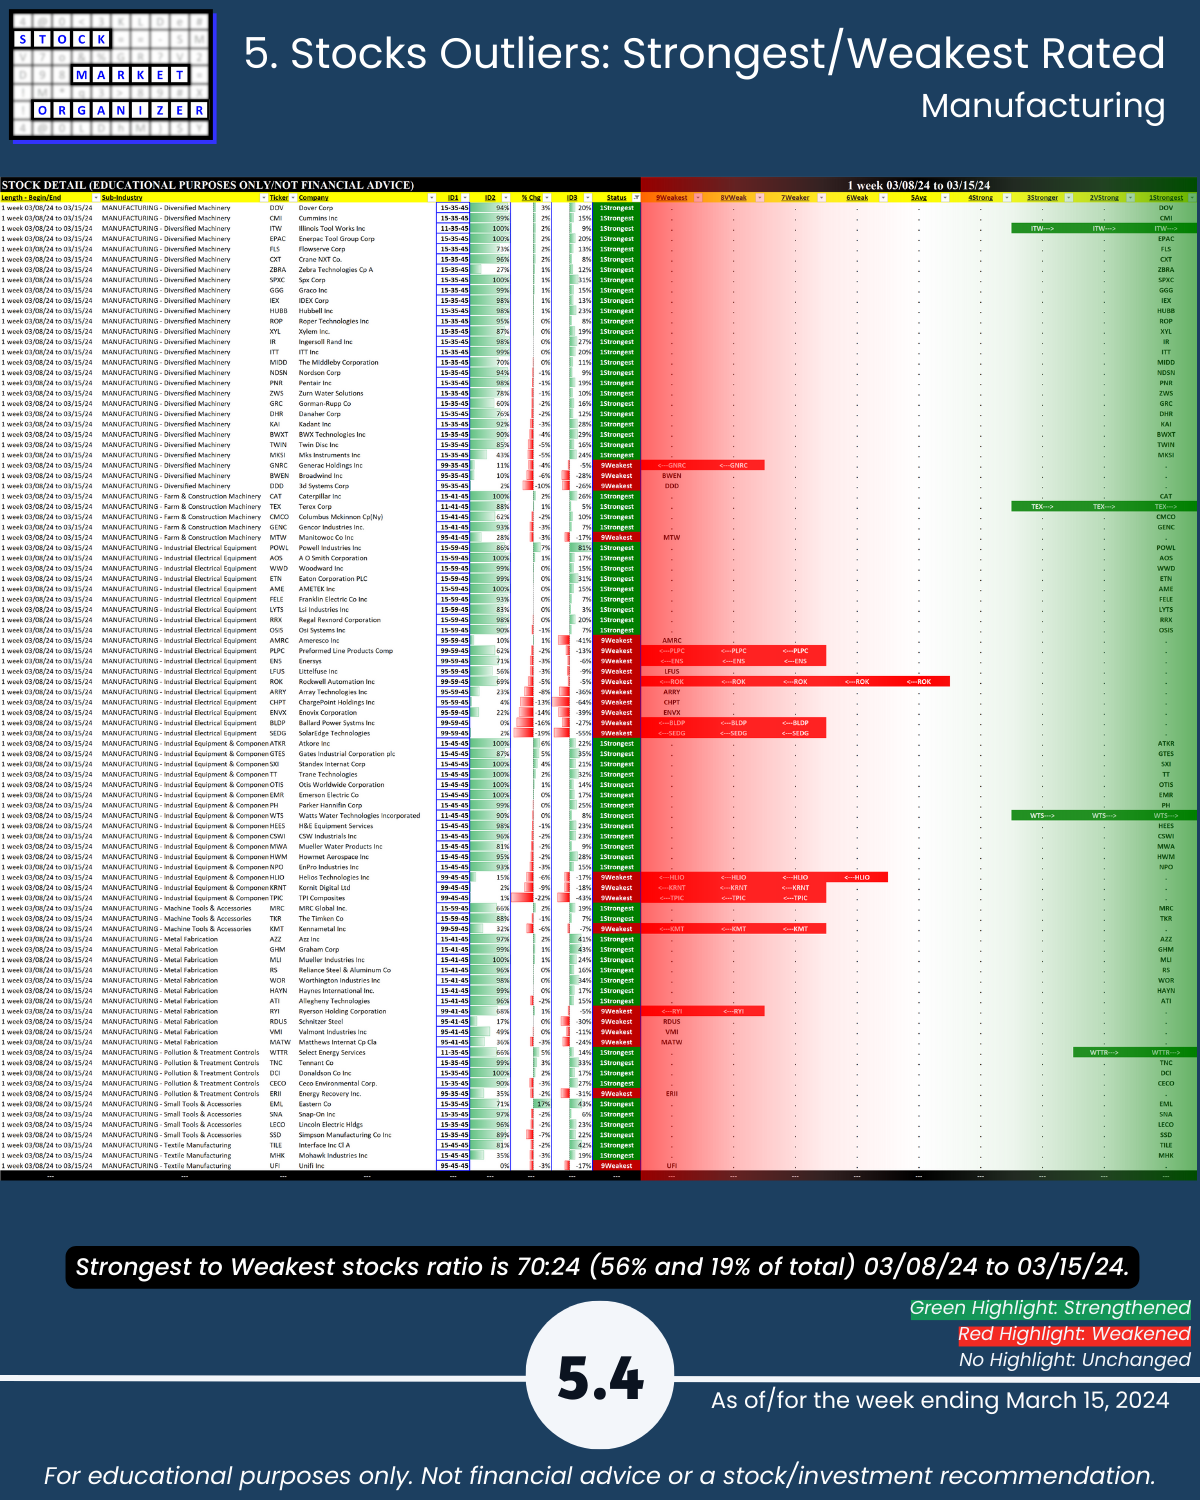
What you probably didn’t know, U.S. stock market strength 3/15/24 Group 3 industries: Manufacturing industry = strong. 🔹 1-year leader POWL +293% 🔹 1-year 32% of the industry’s stocks >40% 🔹 56% of its stocks rated Strongest (highest of 9 strength levels) 🔹 14% of its 125 stocks at 5+ year highs w/1-year 43% average returns (range +17% to +76%).
You won’t find strength if you aren’t looking for it.
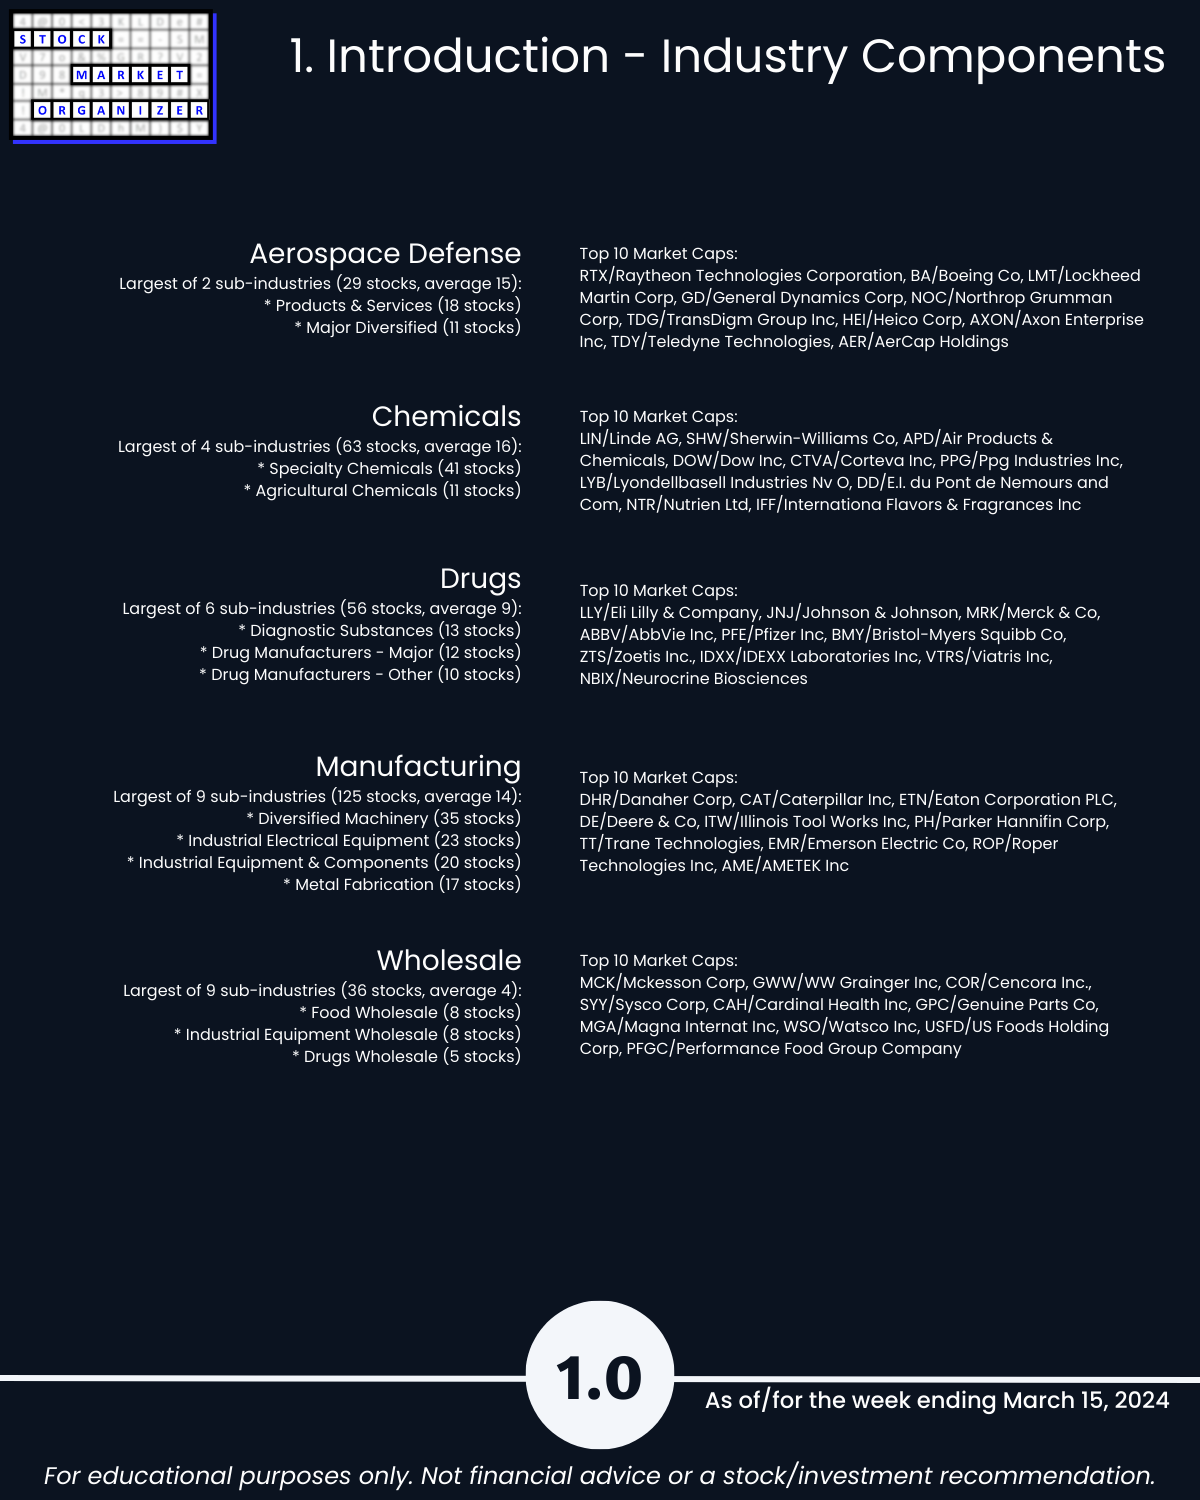
Cats and dogs industry review of Group 3 - Aerospace Defense, Chemicals, Drugs, Manufacturing, and Wholesale including Strongest-/Weakest-rated Stock Market Organizer stocks and objective strengthening/weakening measurements for each industry.
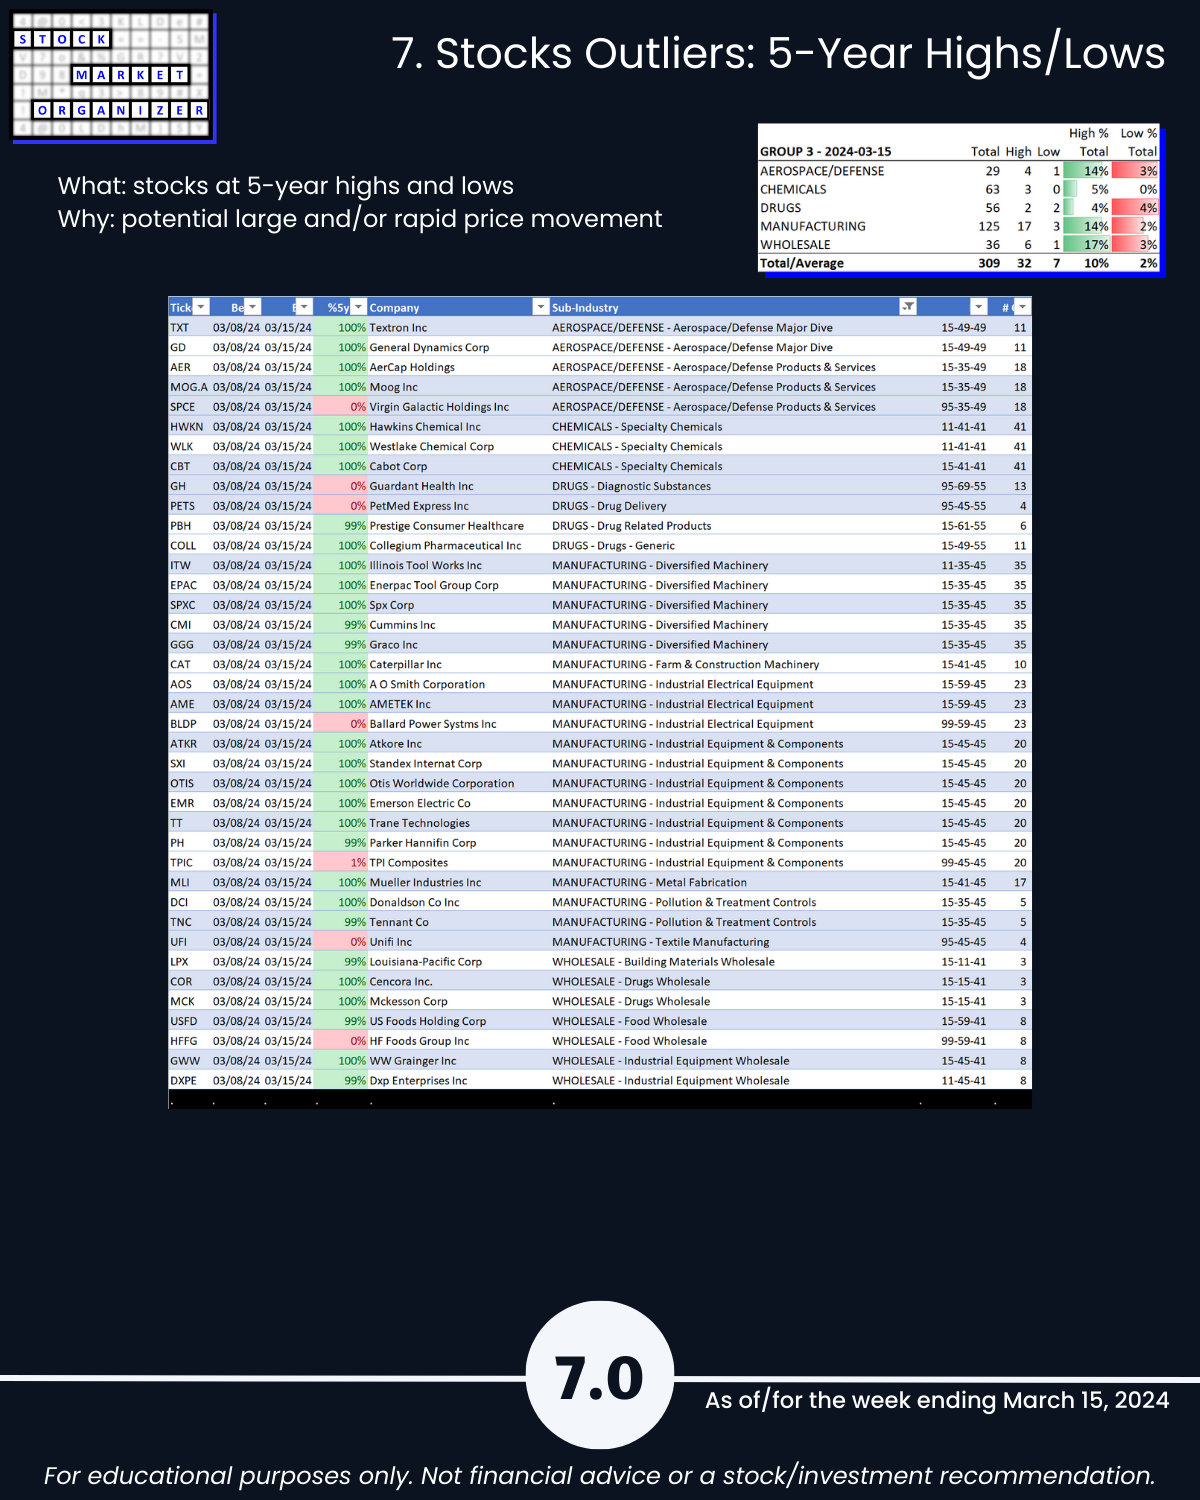
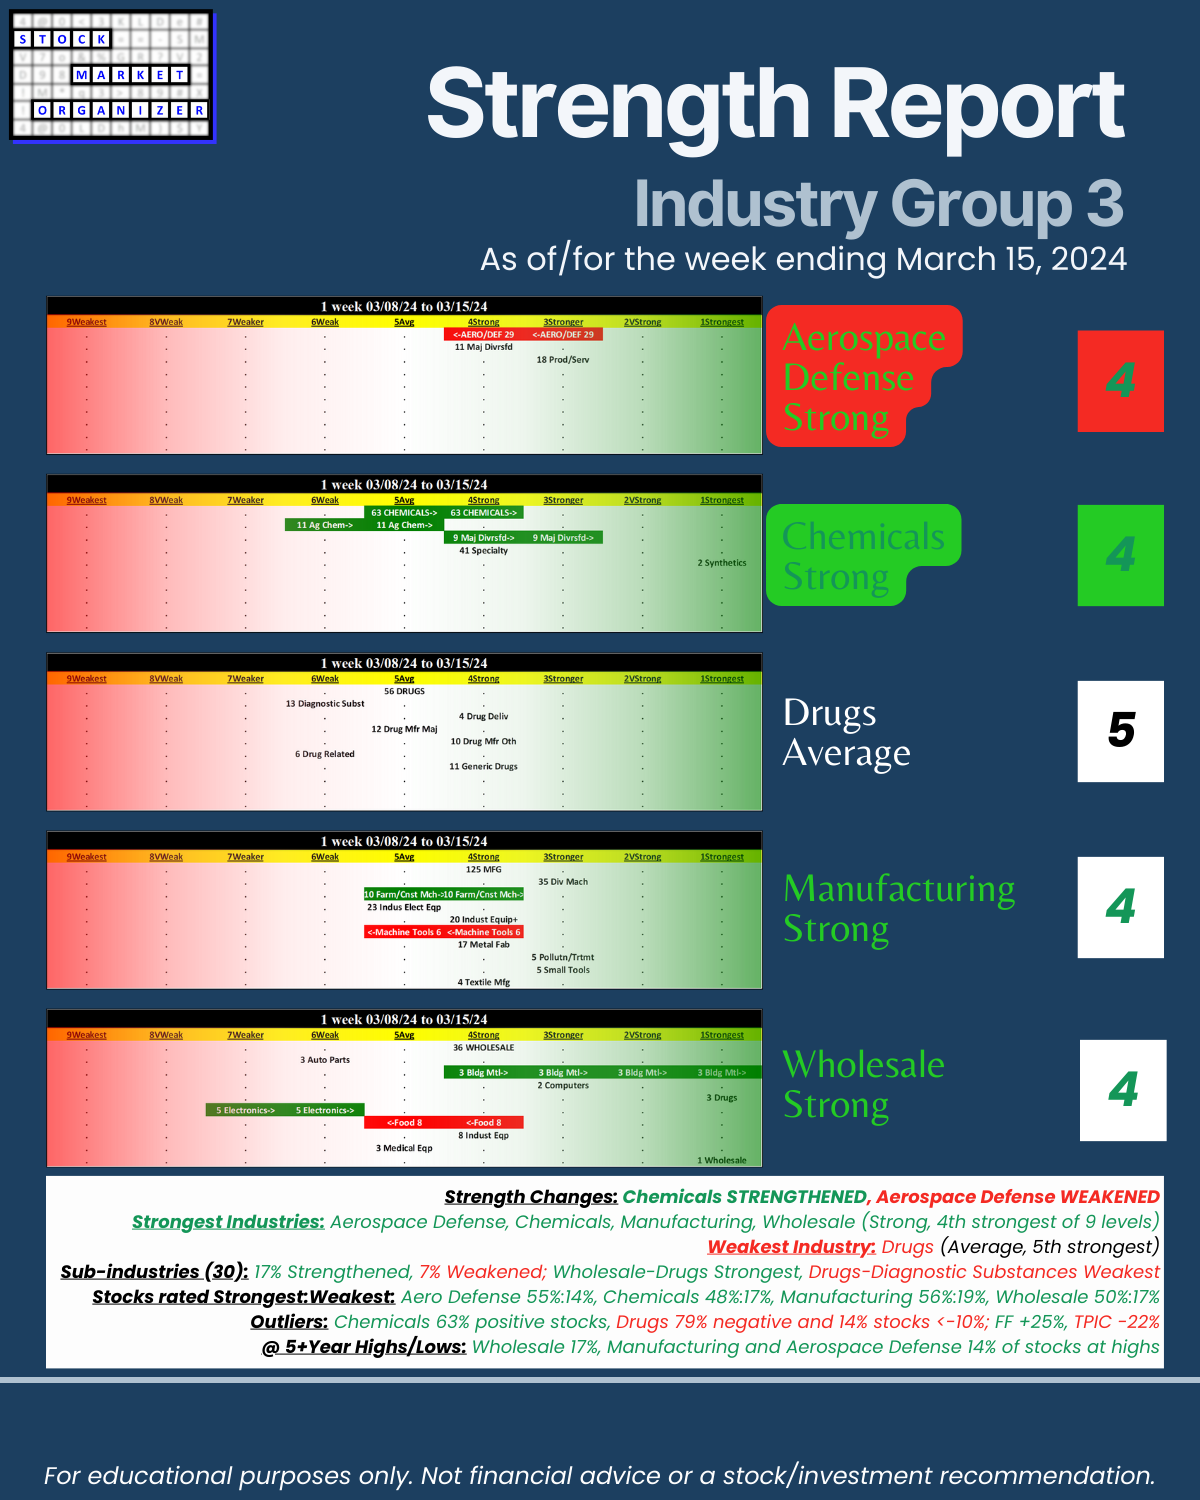
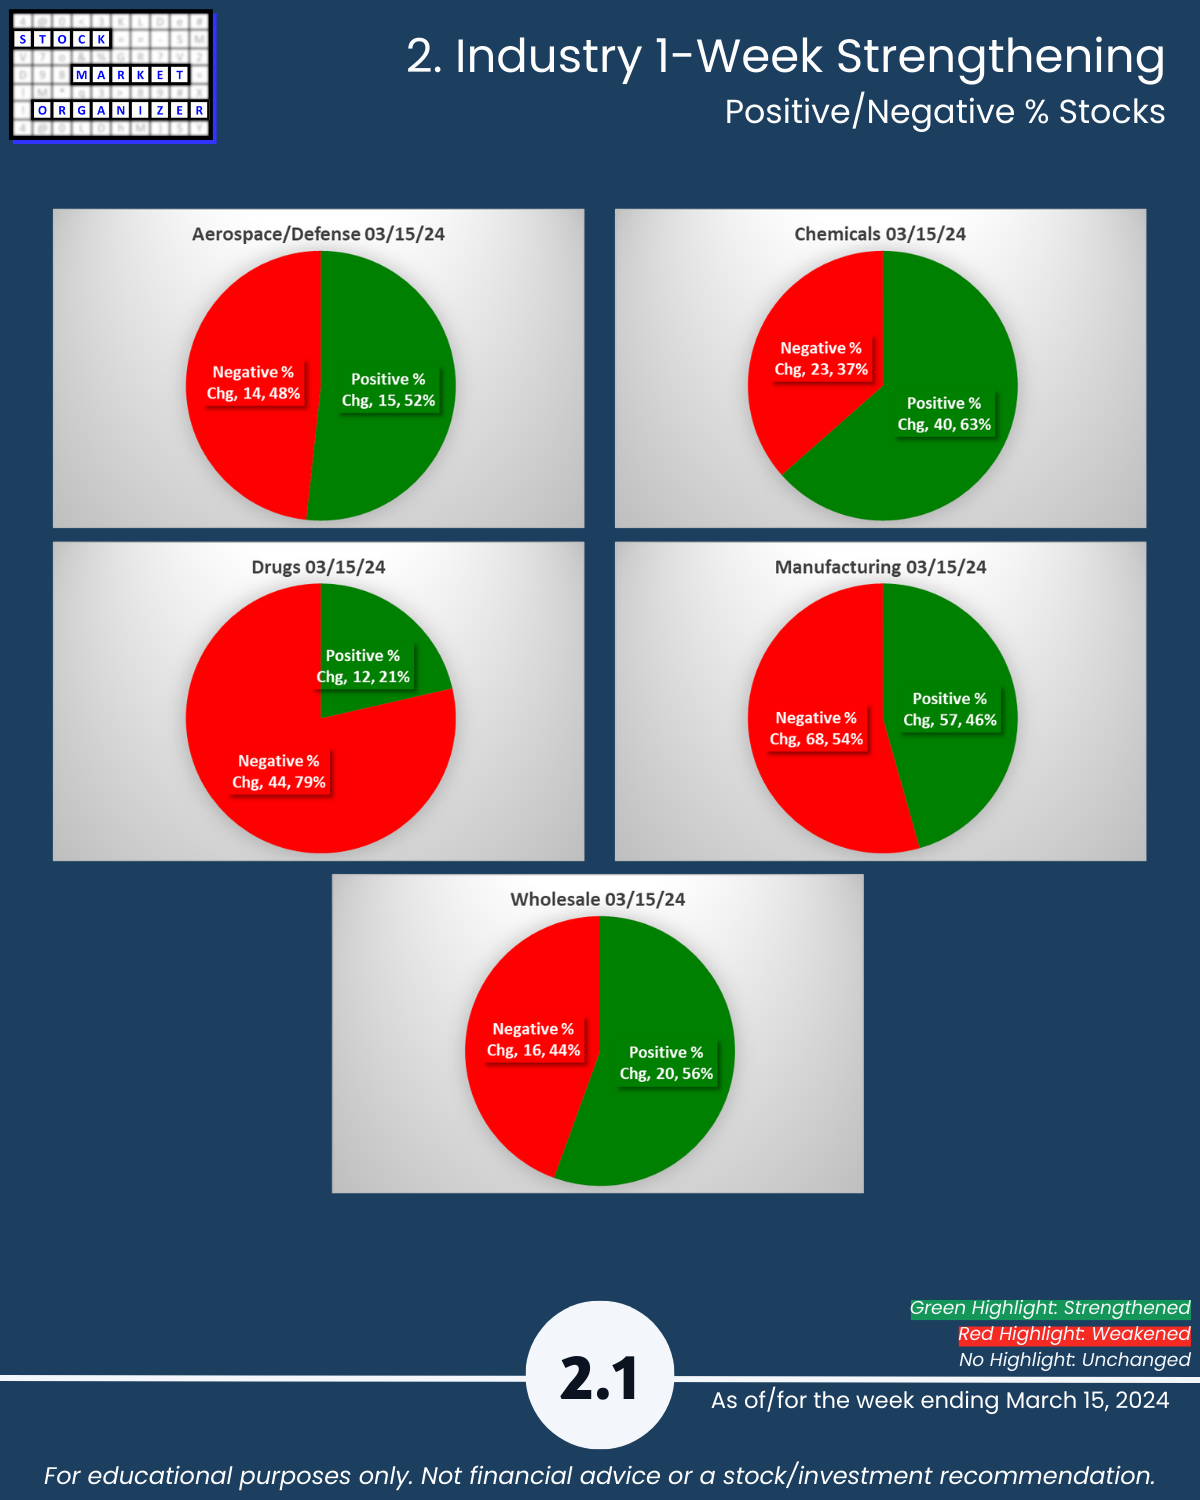
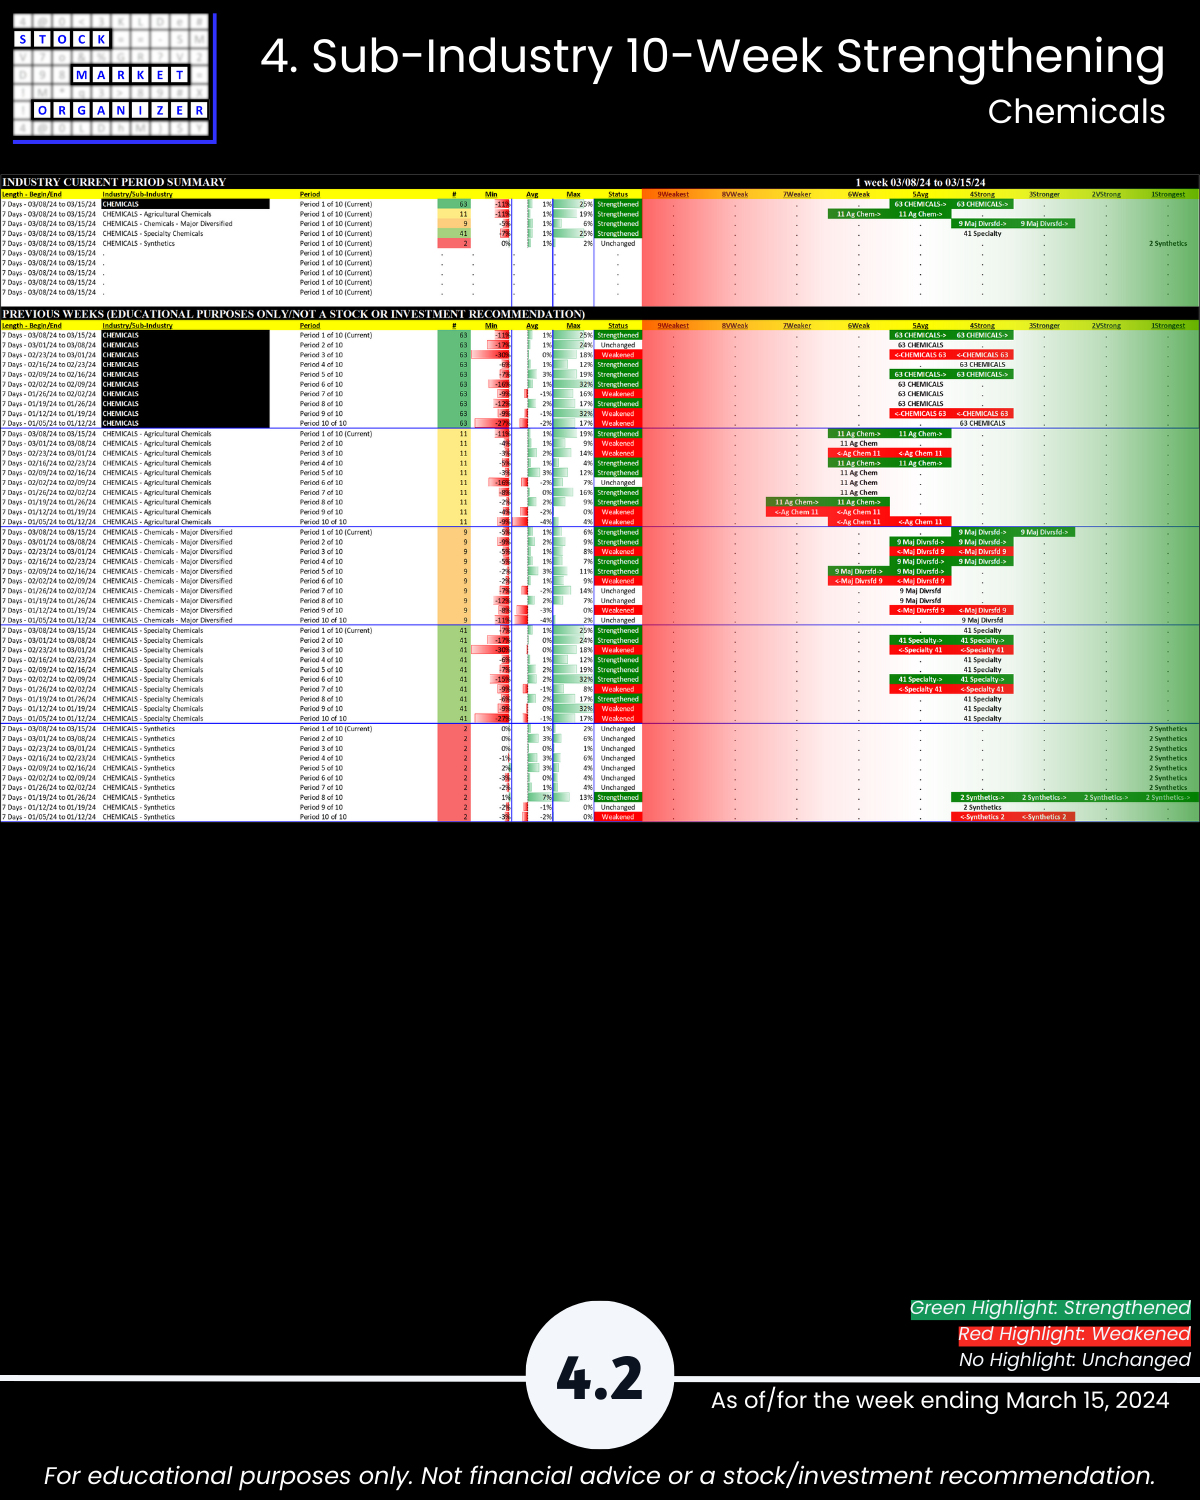
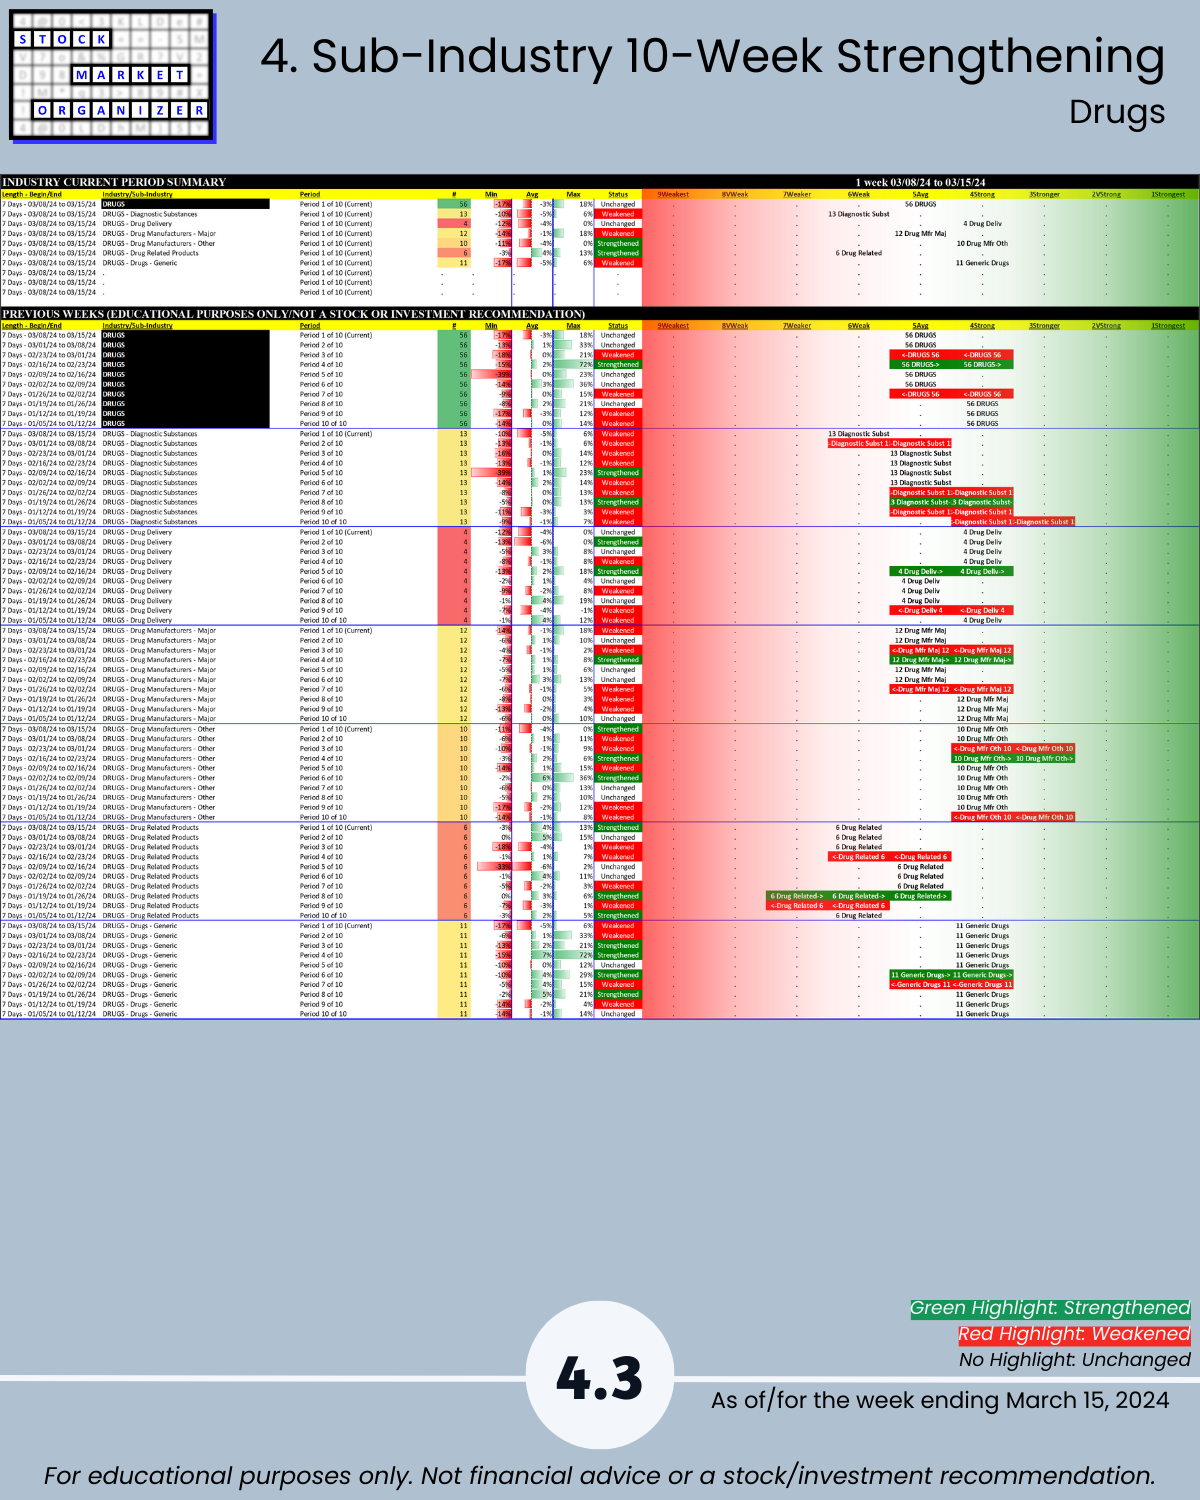
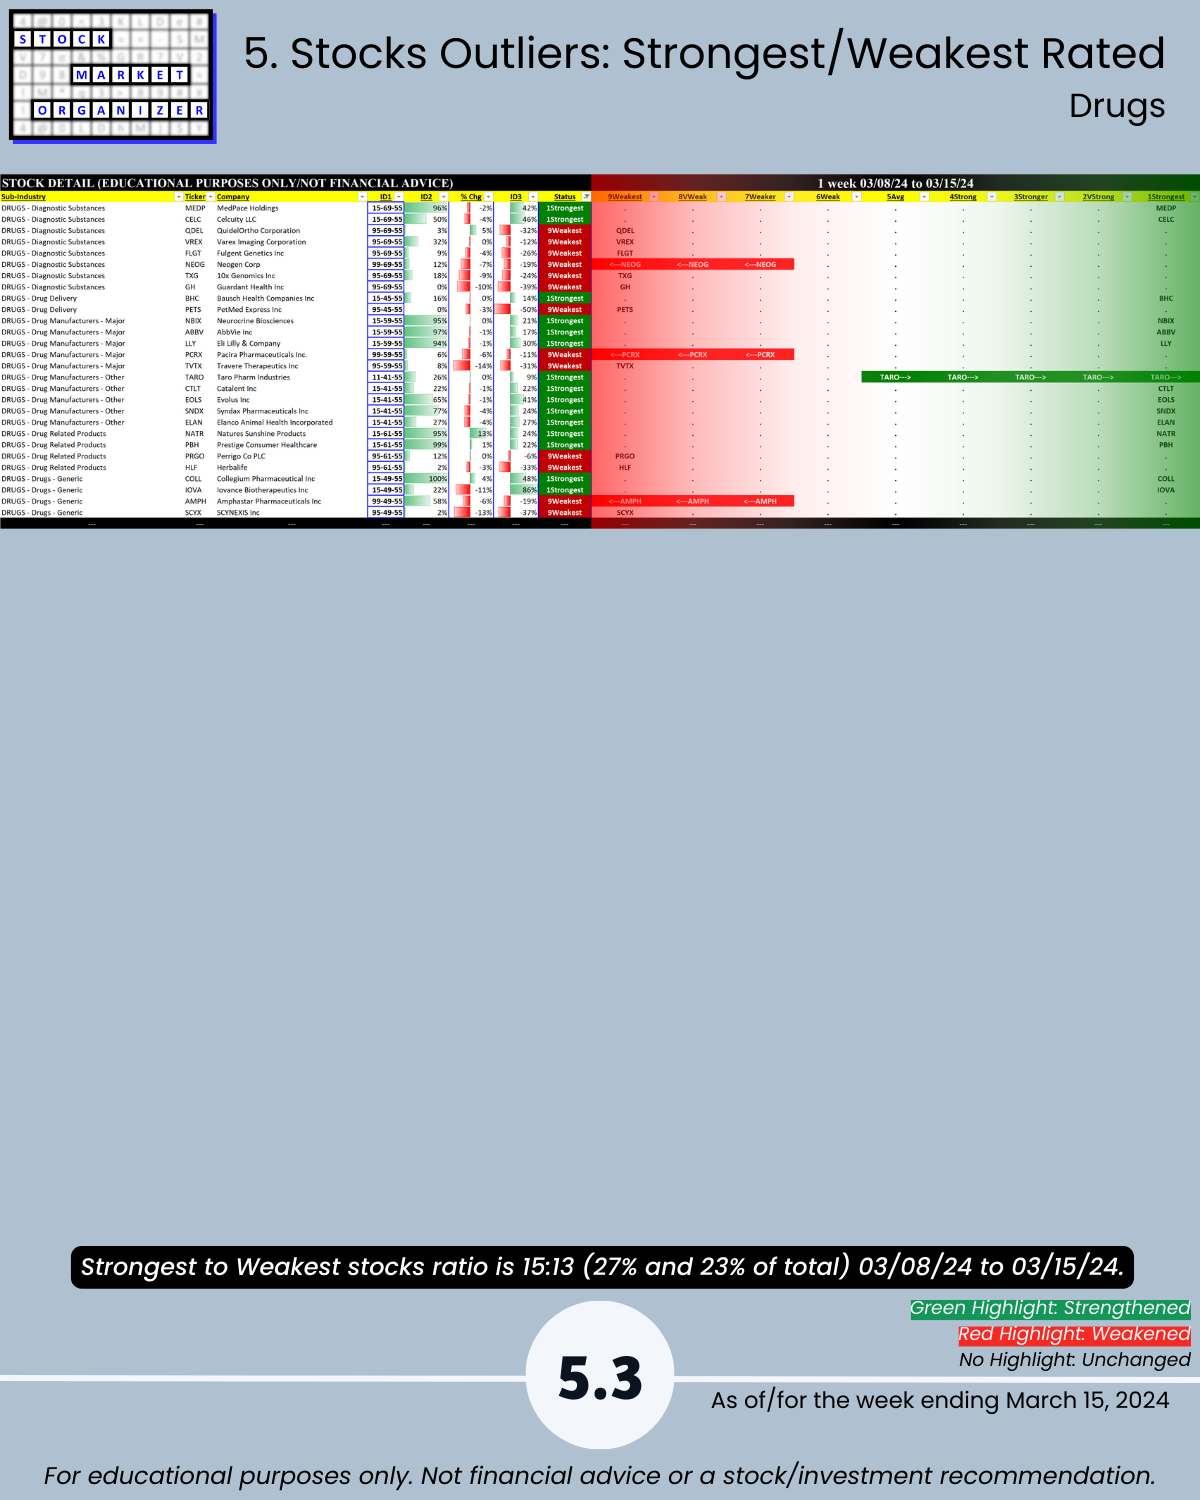
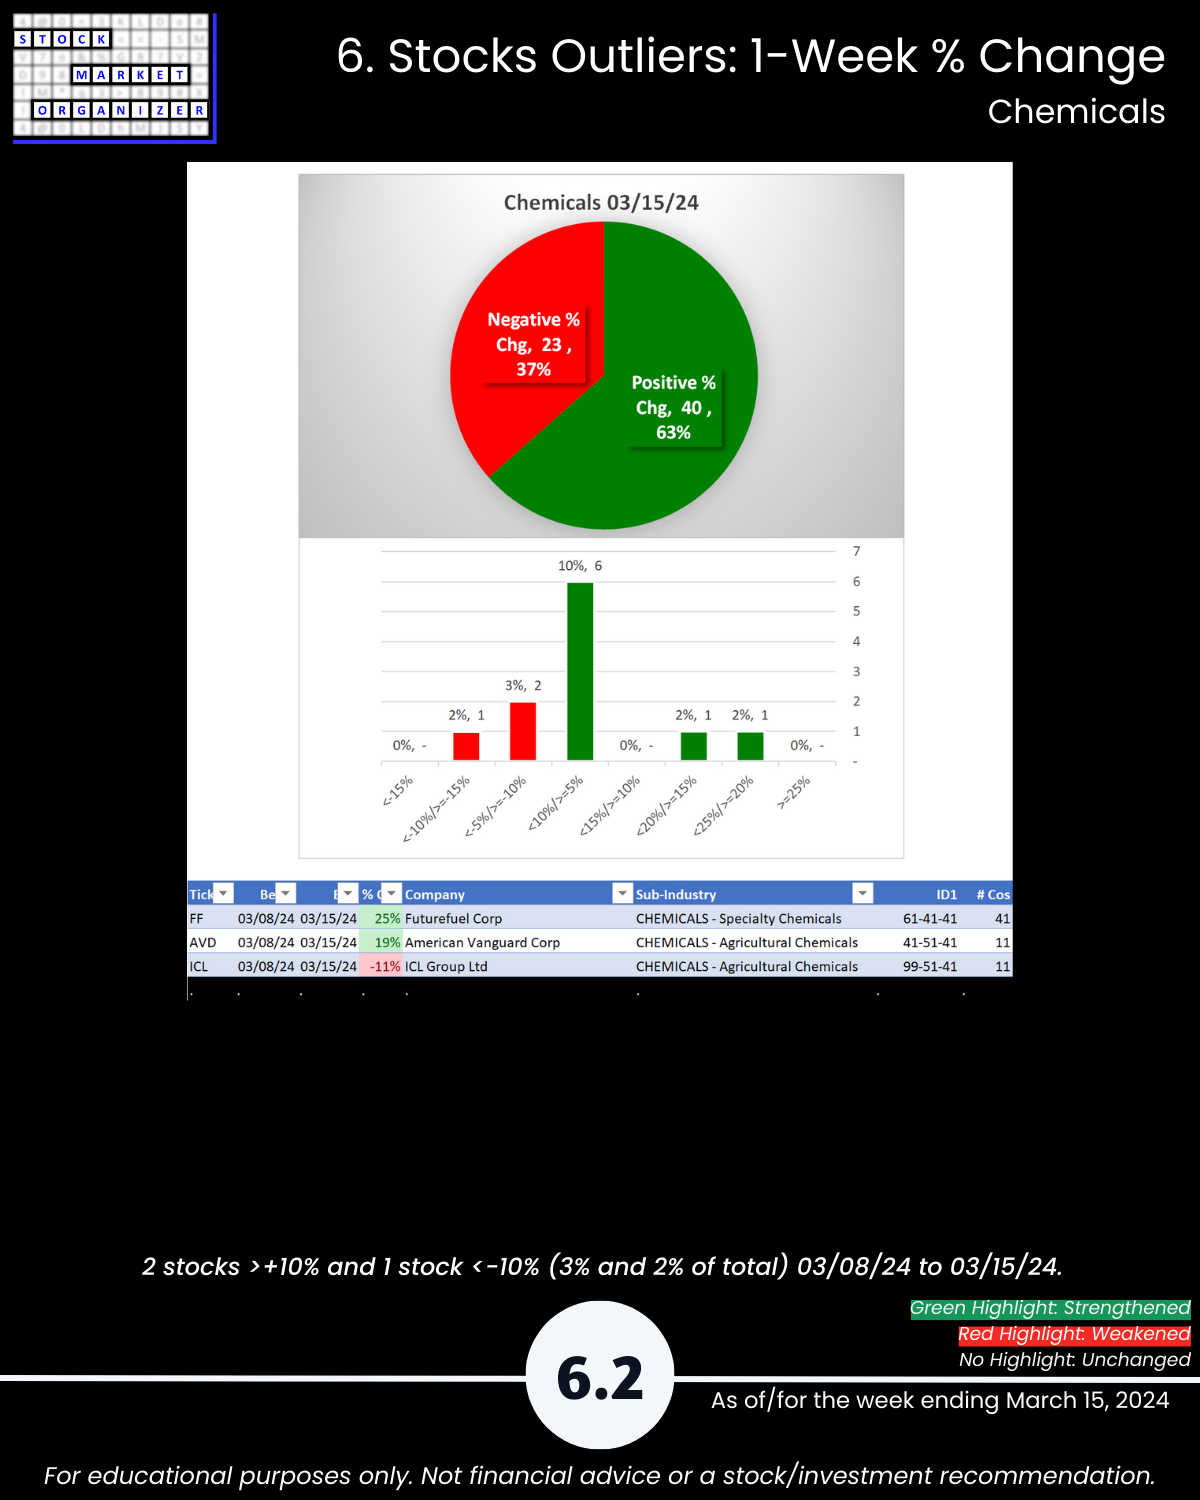
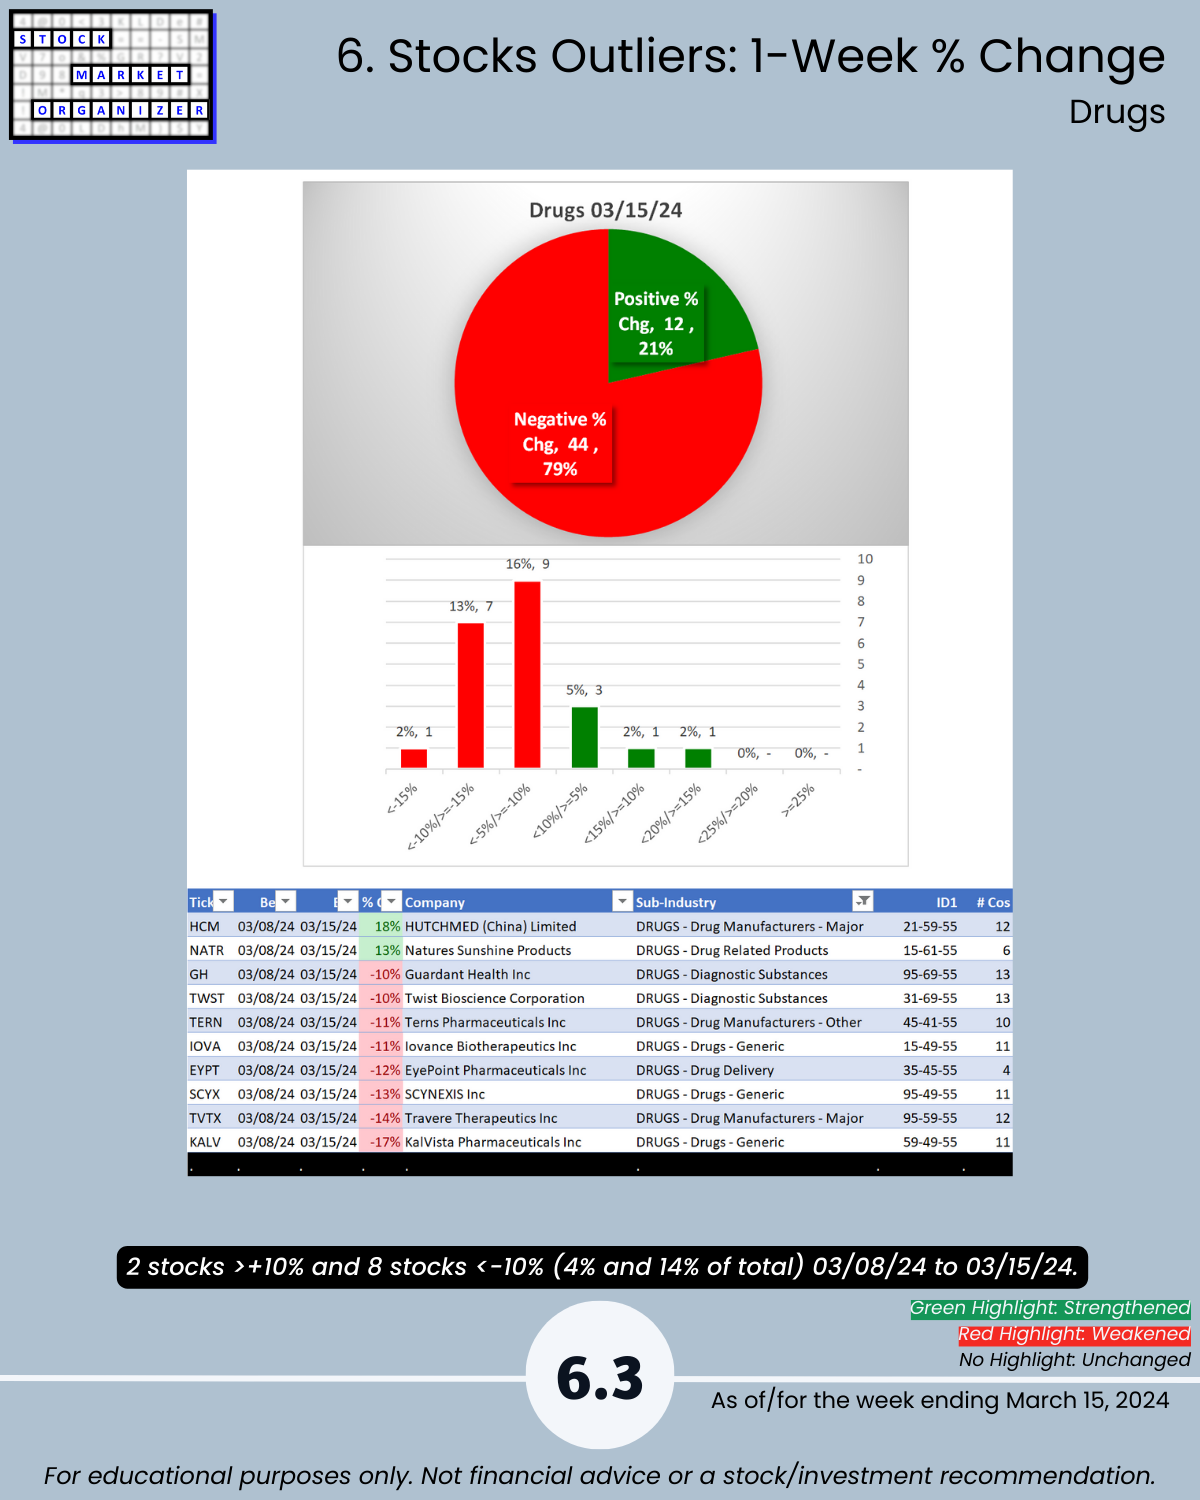
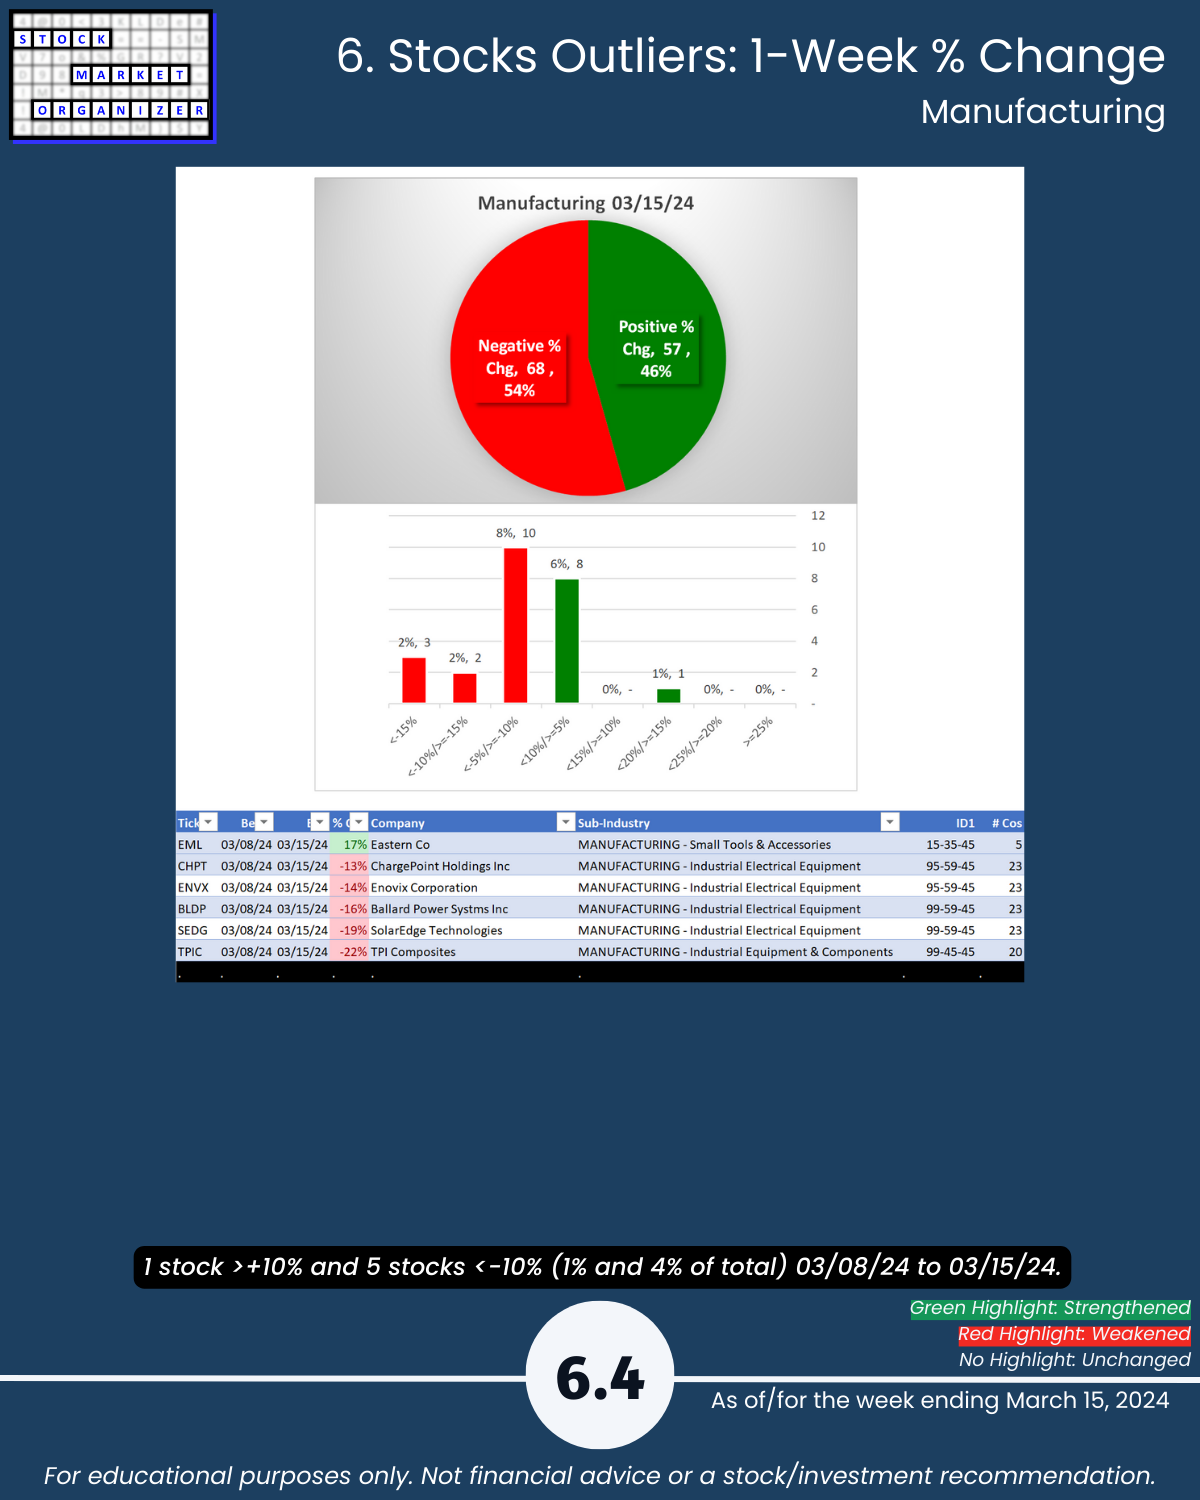
🔹 Outliers: Chemicals 63% positive stocks, Drugs 79% negative and 14% stocks <-10%; FF +25%, TPIC -22%
HIGHLIGHTS
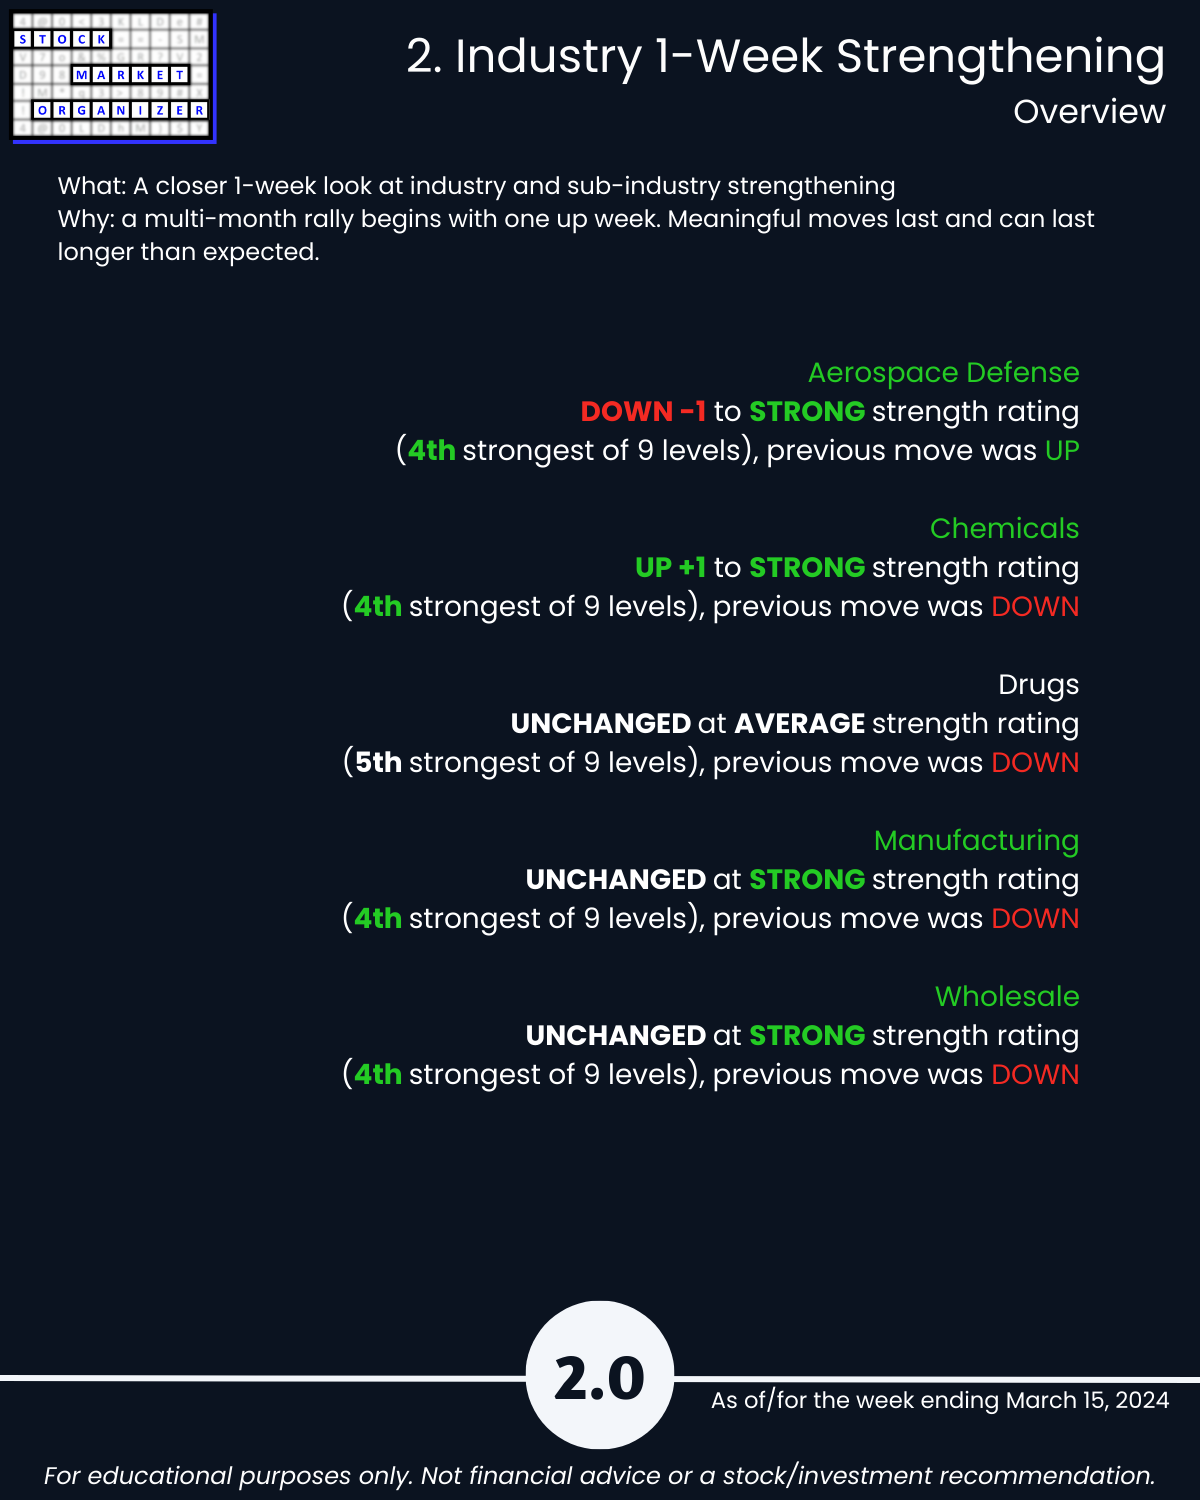
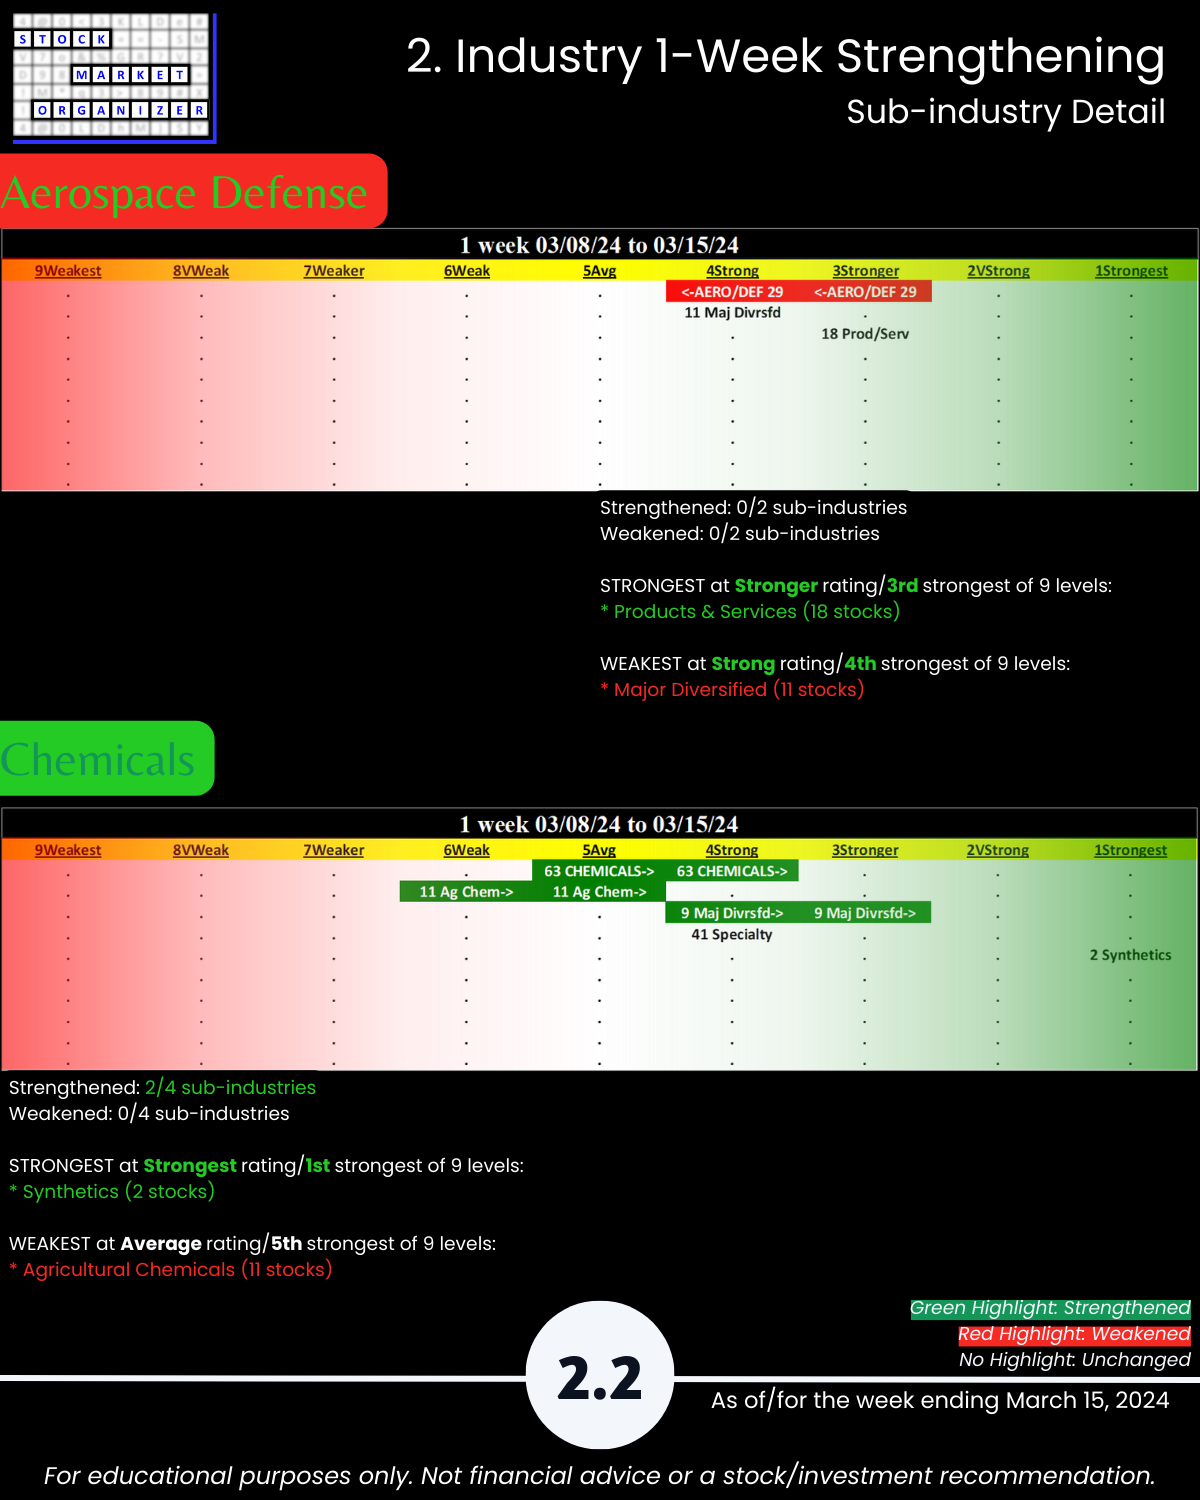
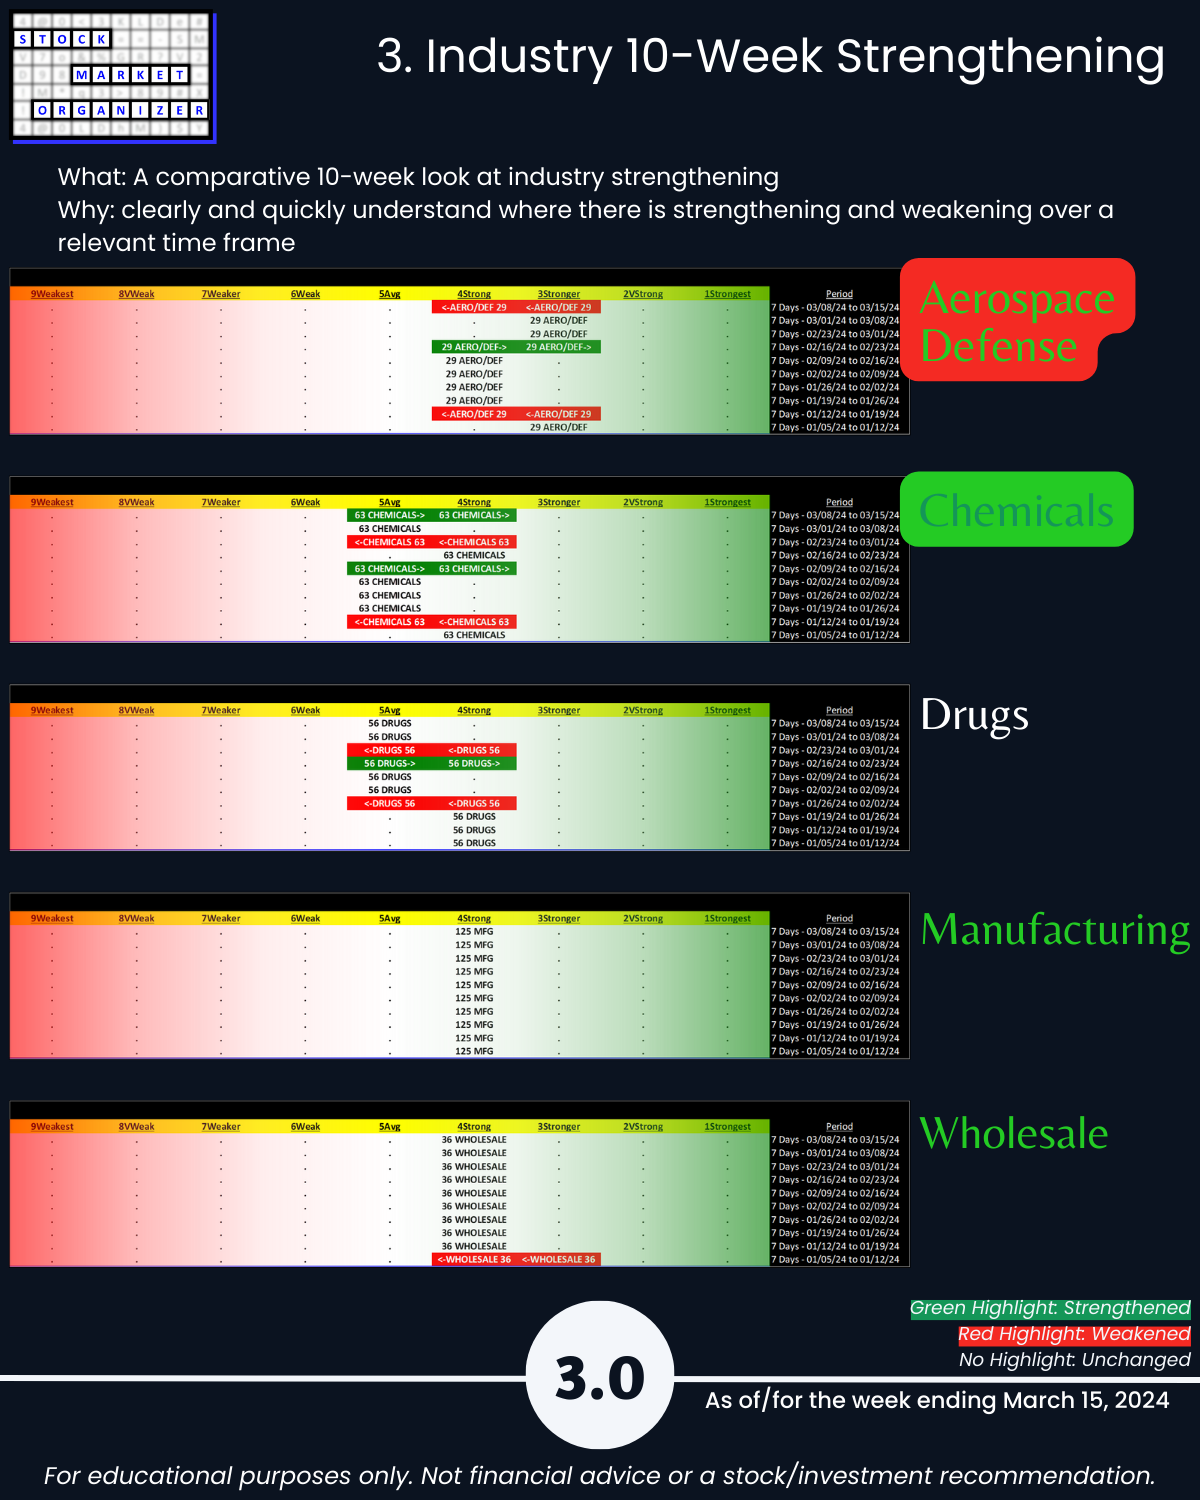
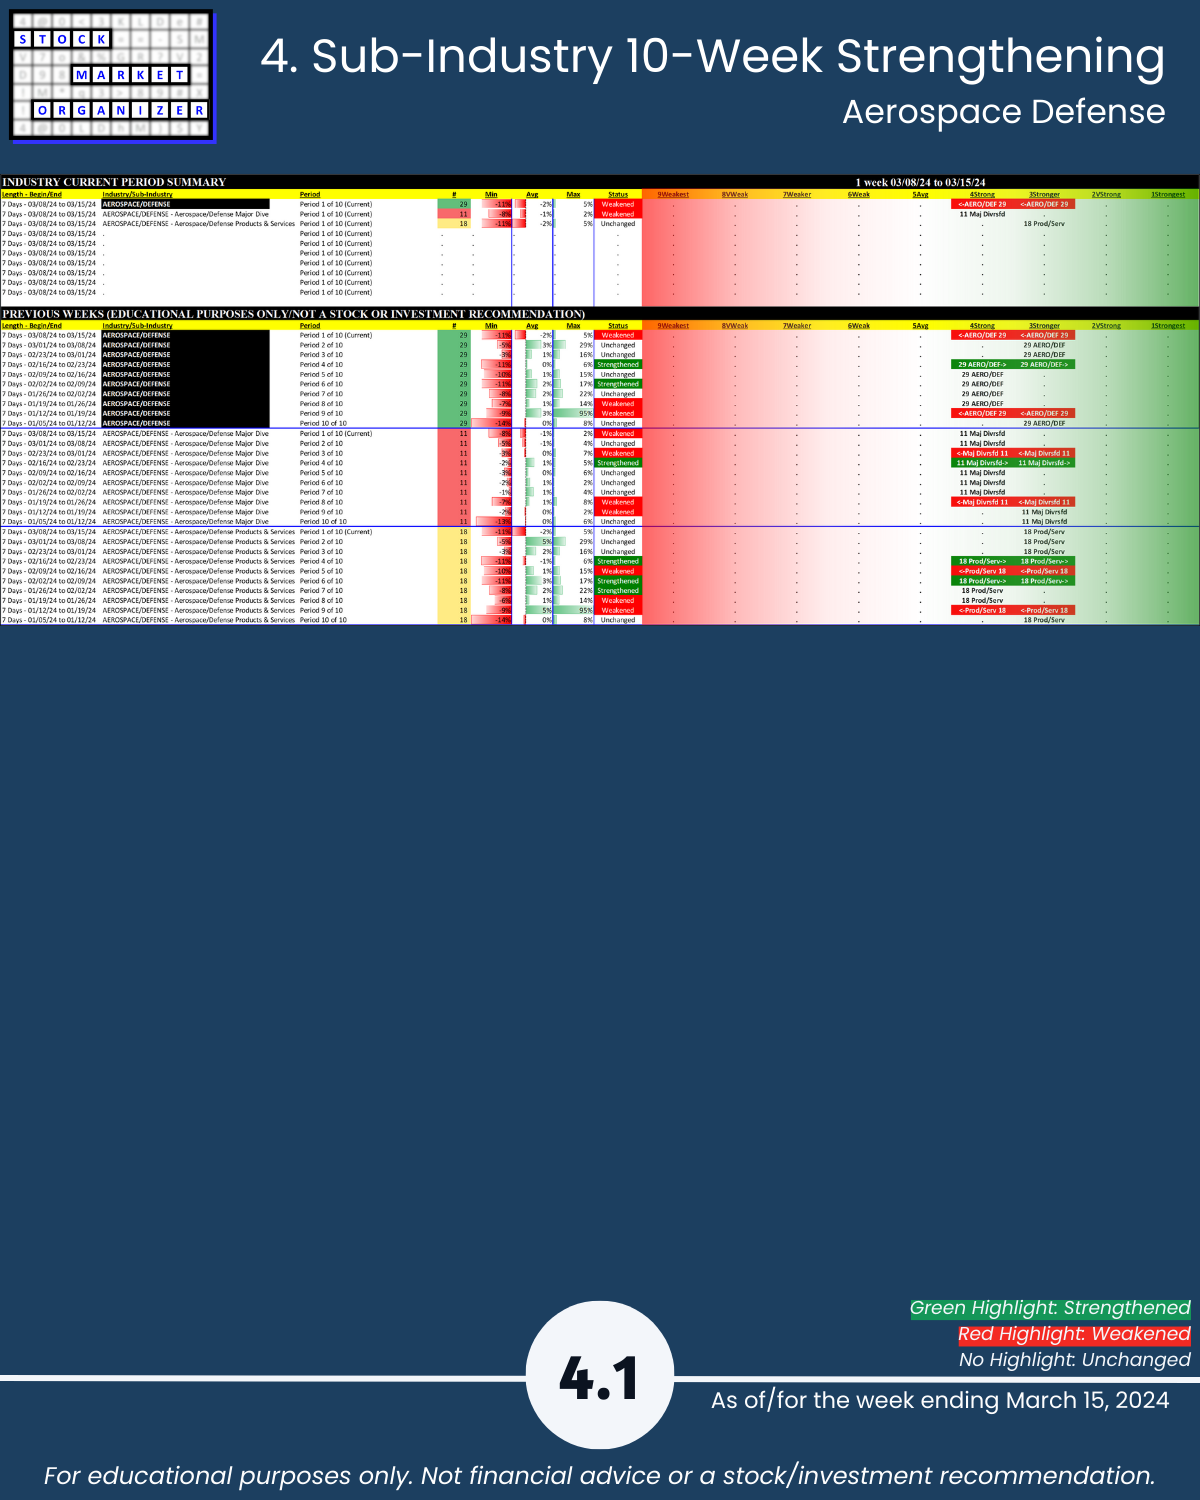
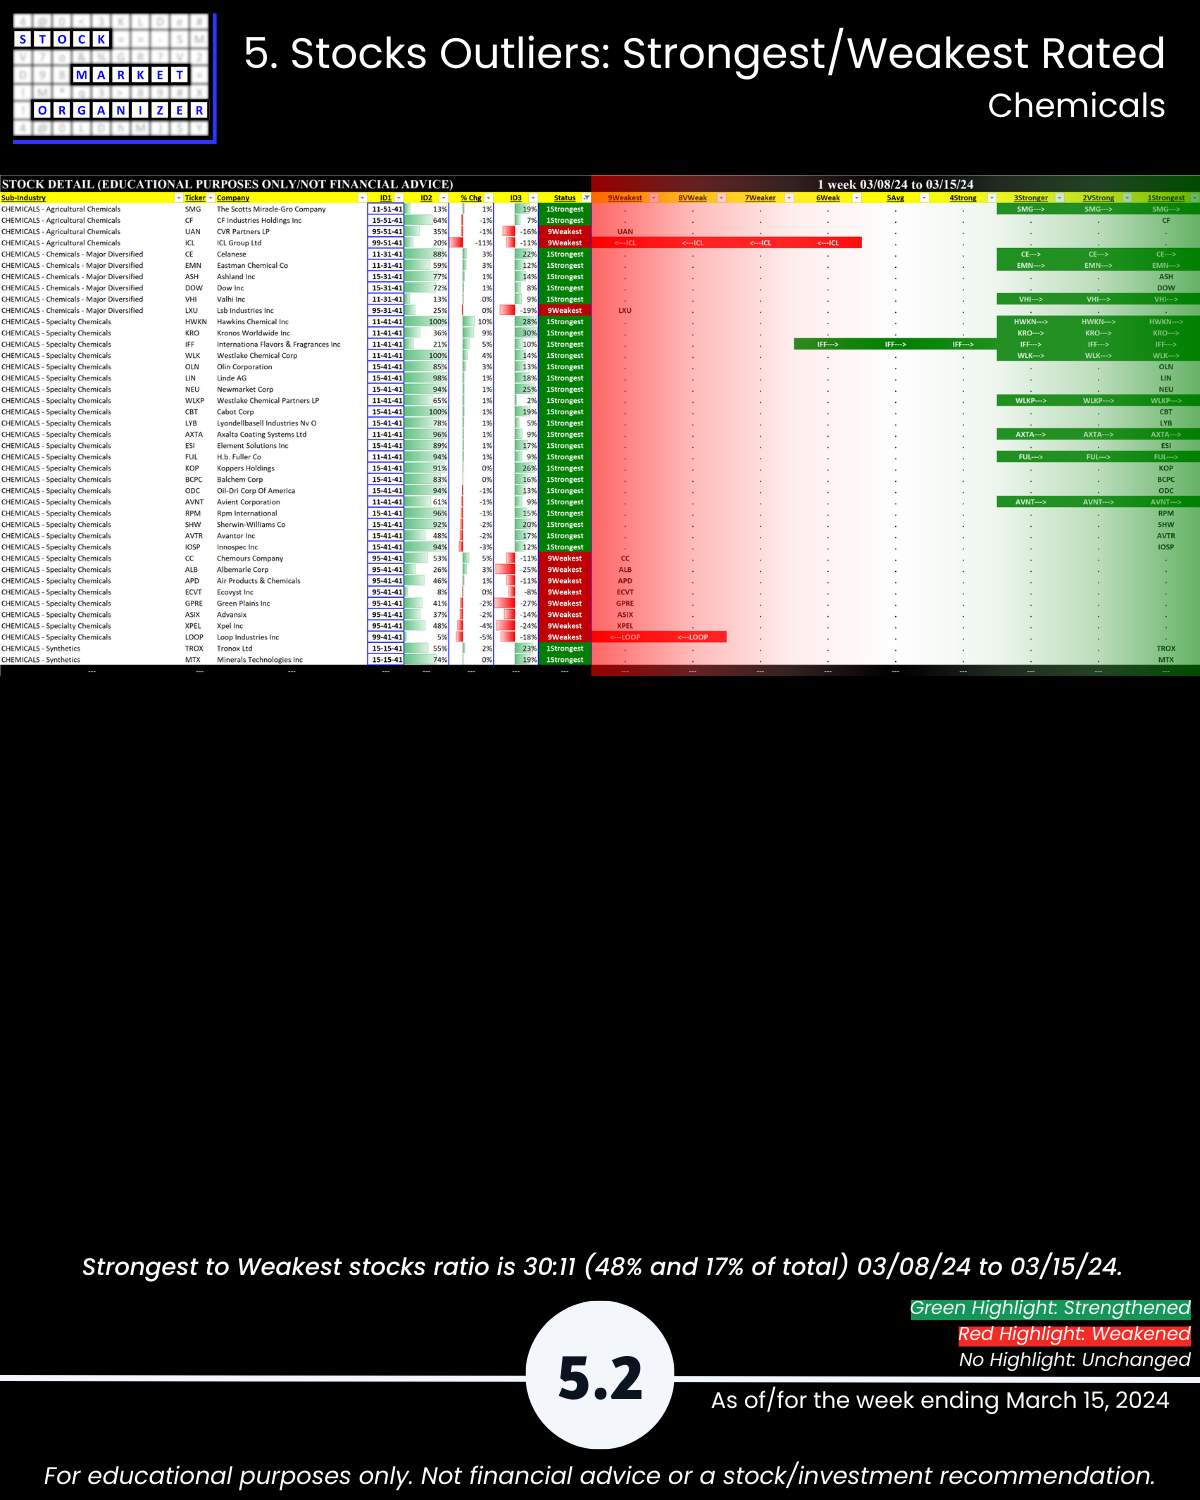
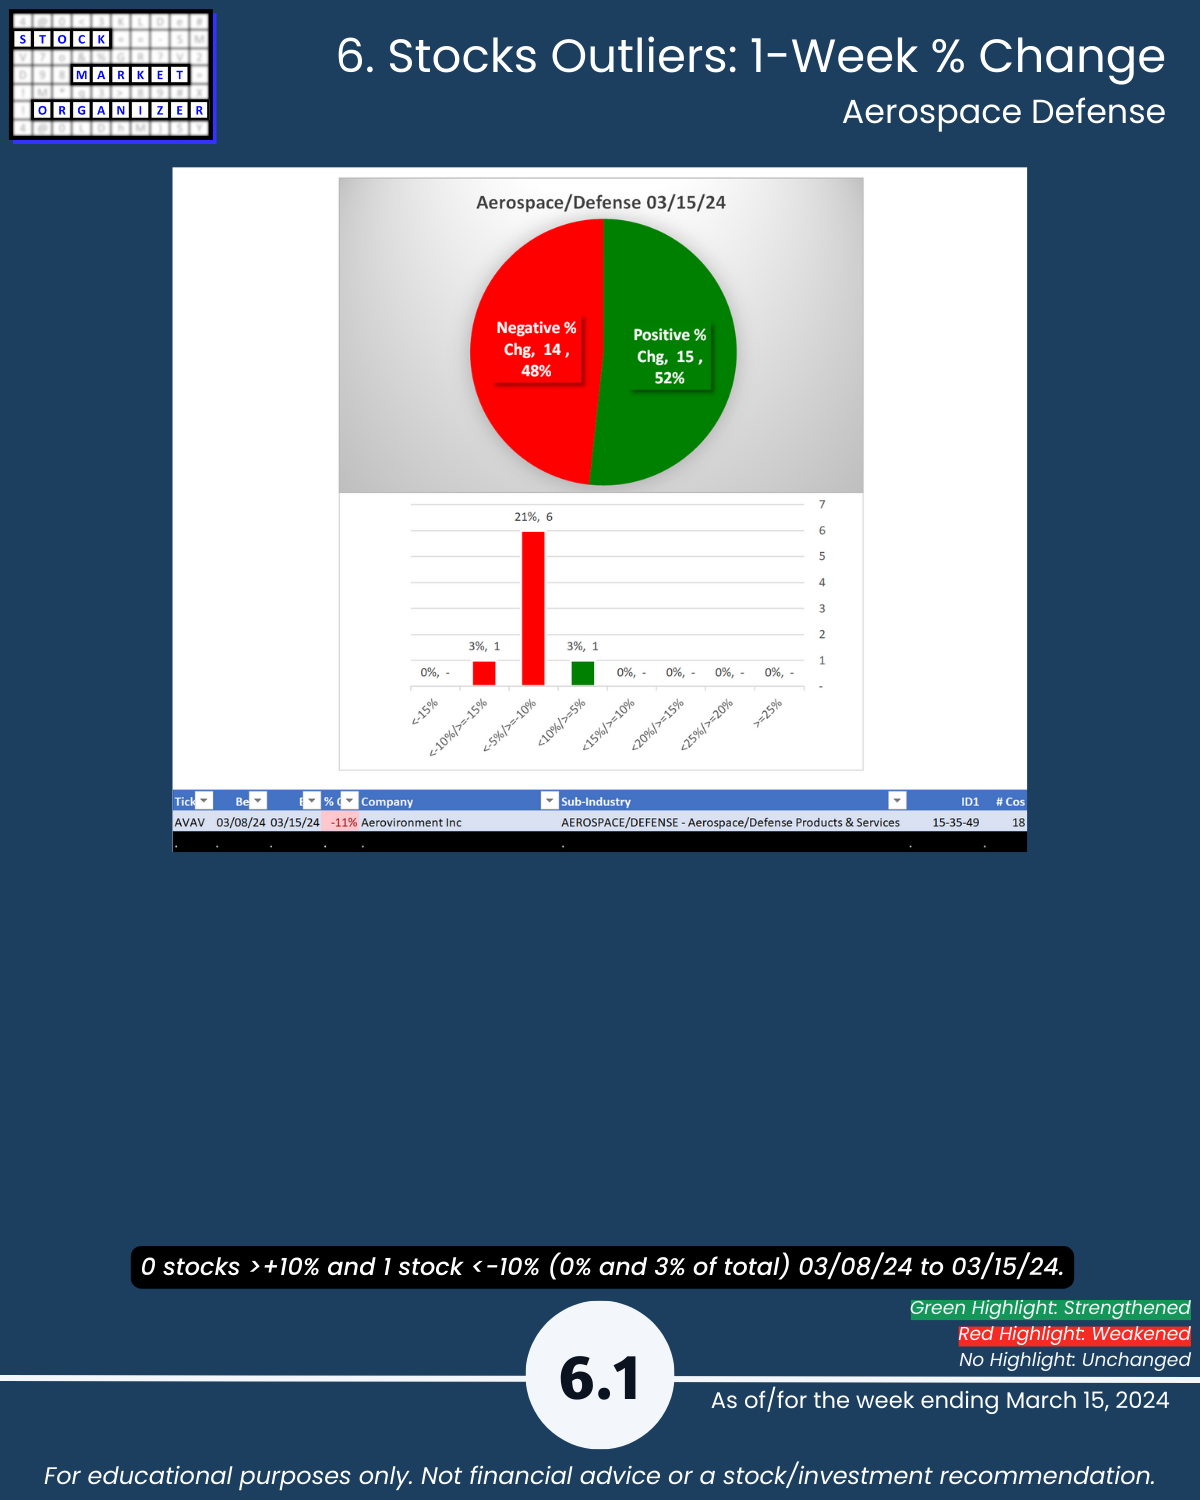
🔹 Strength Changes: Chemicals STRENGTHENED, Aerospace Defense WEAKENED
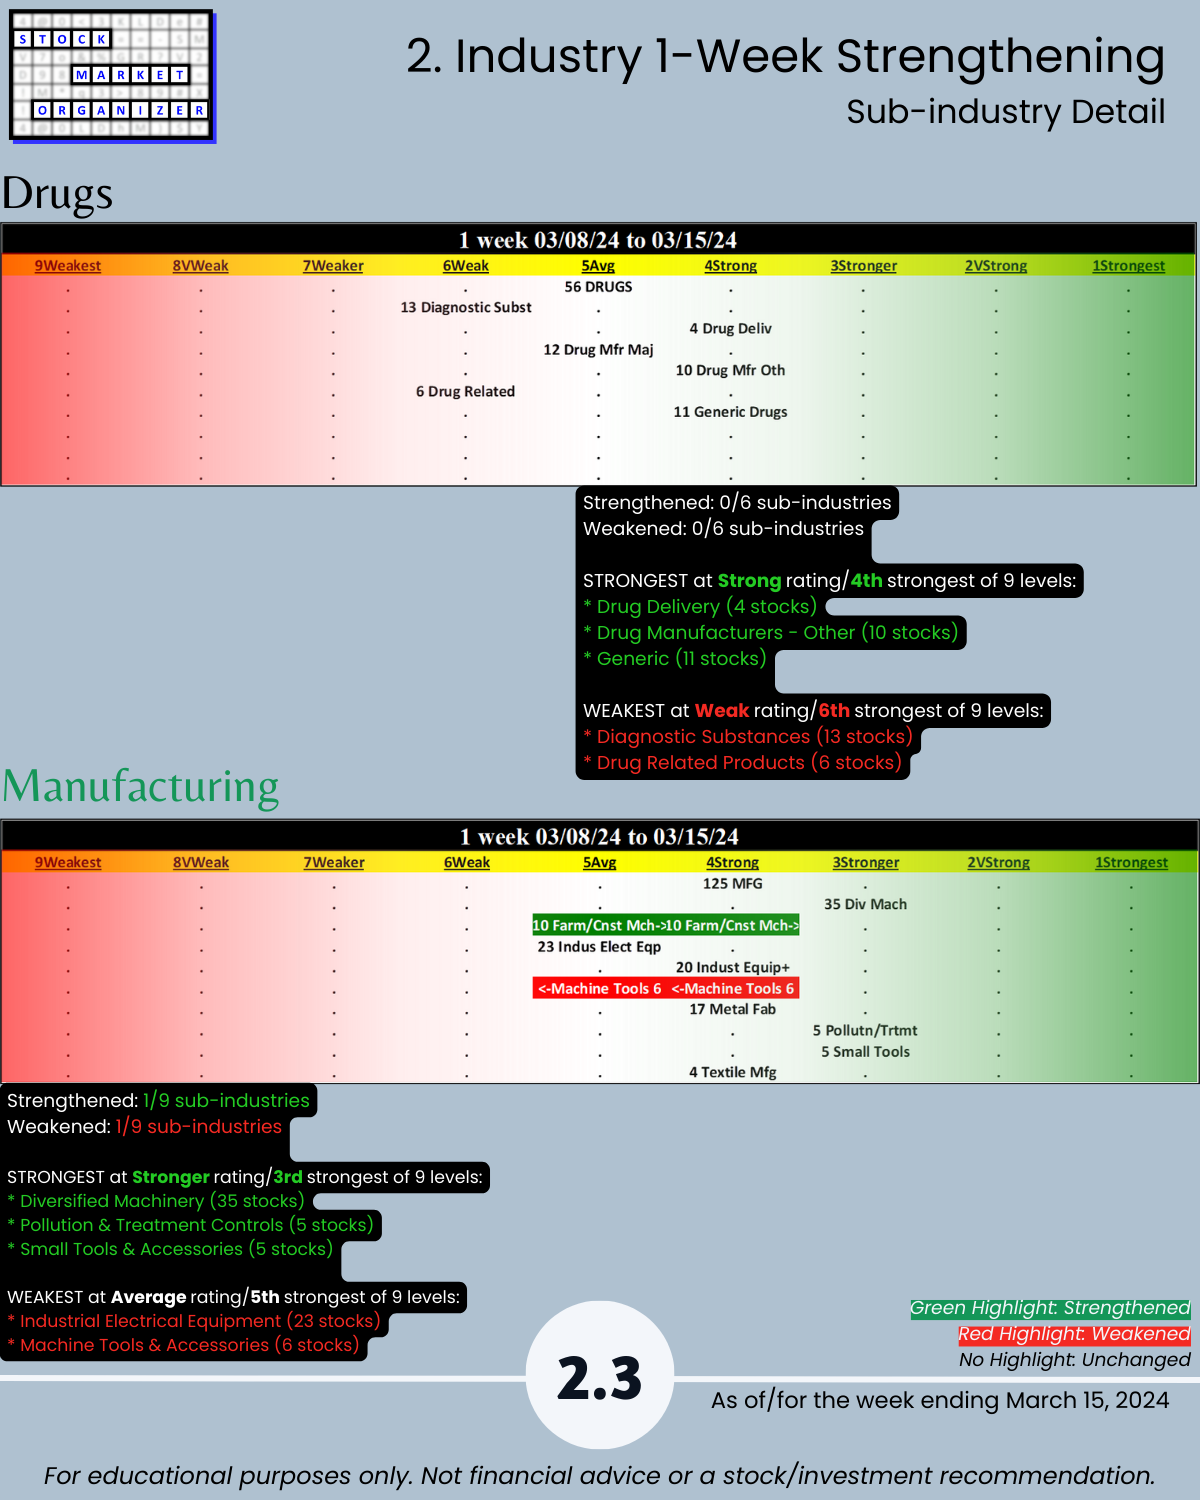
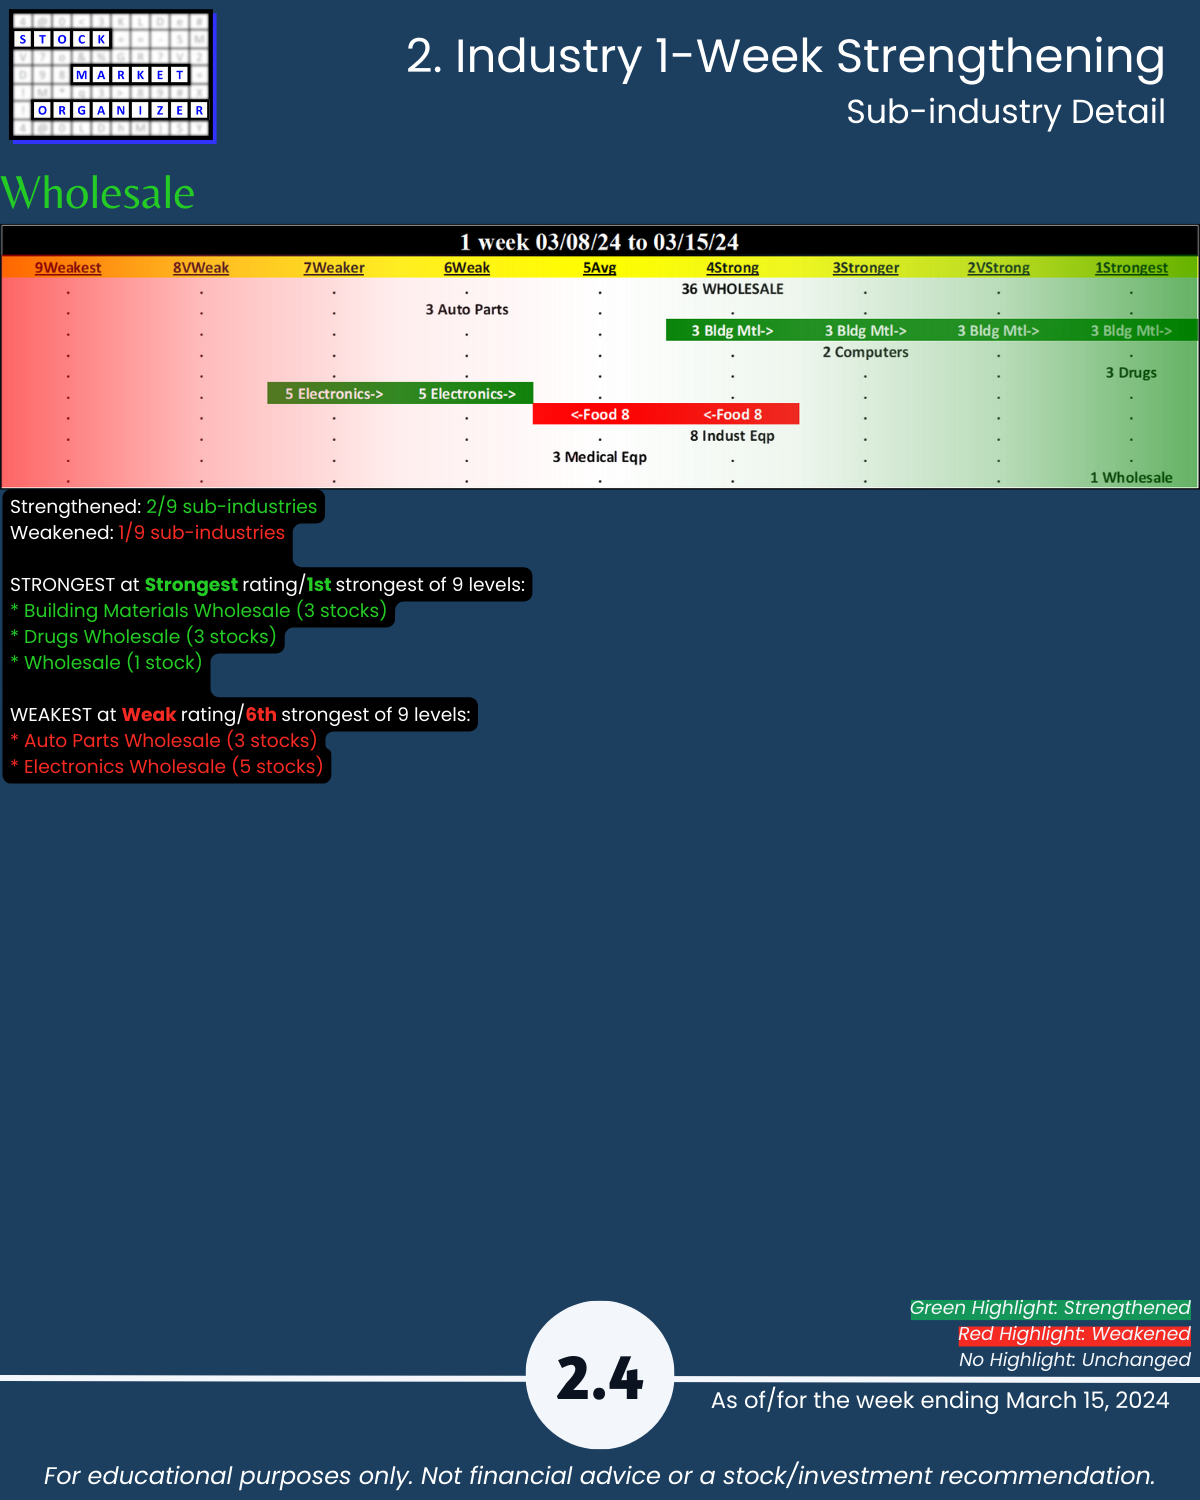
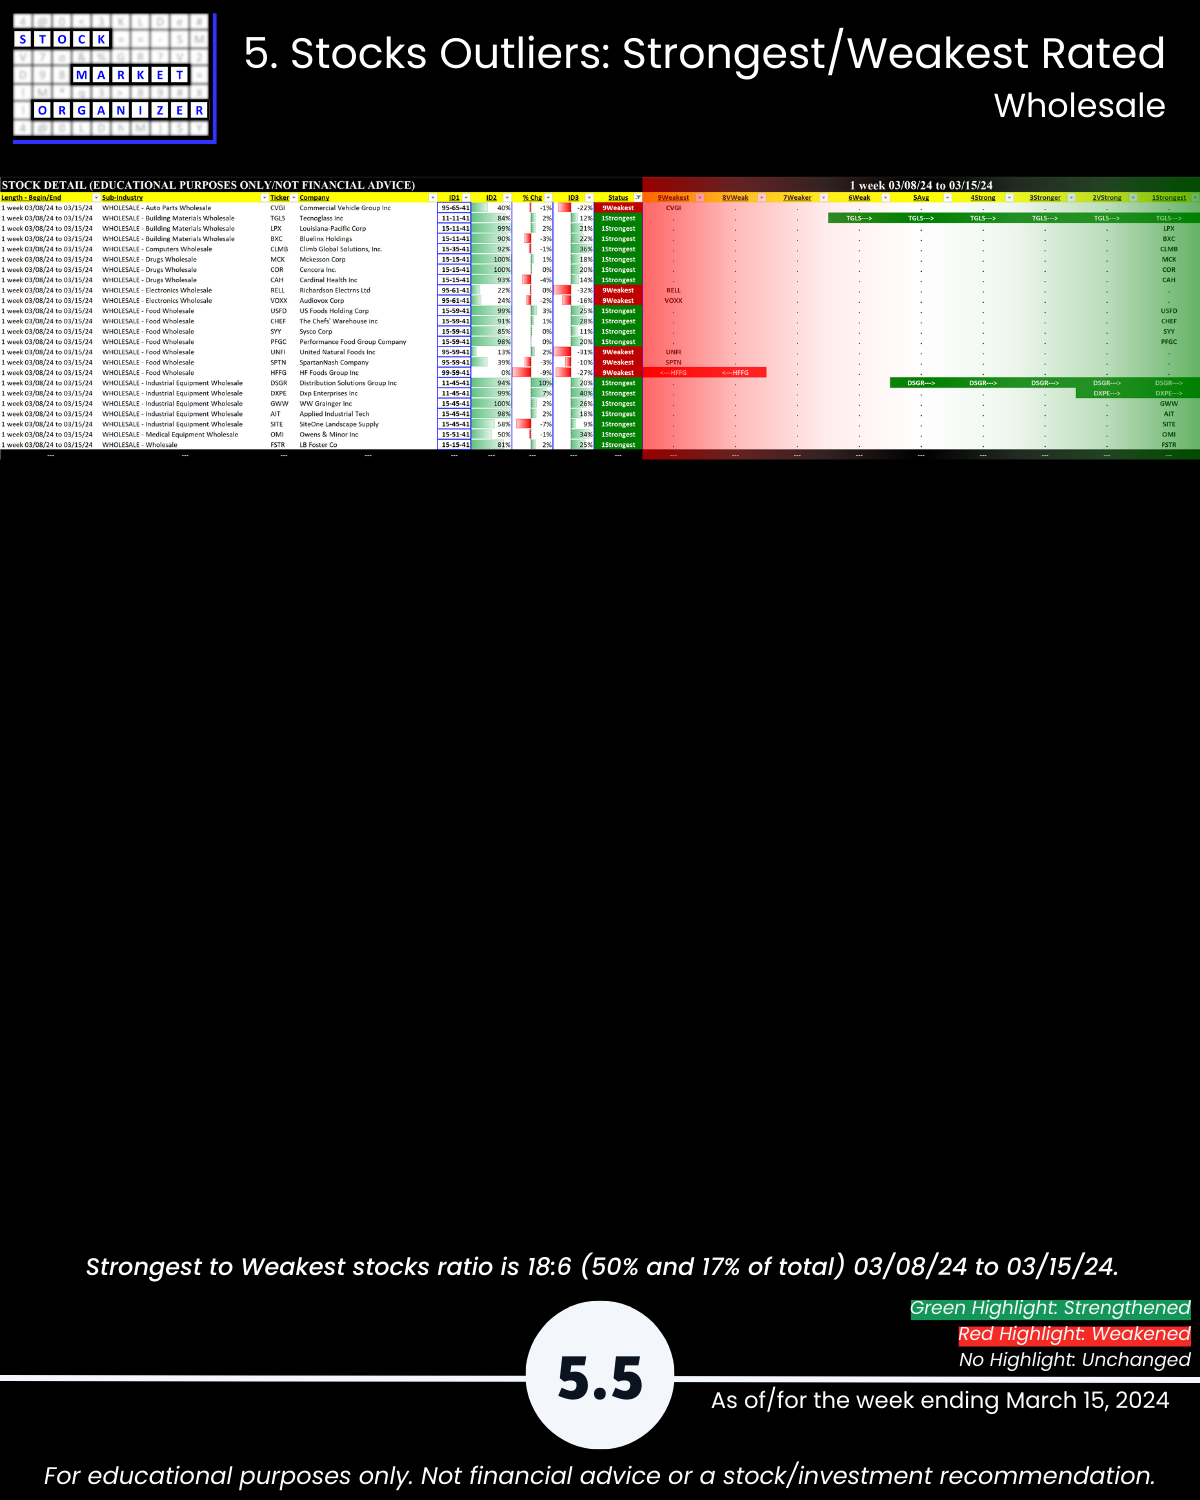
🔹 Strongest Industries: Aerospace Defense, Chemicals, Manufacturing, Wholesale (Strong, 4th strongest of 9 levels)
🔹 Weakest Industry: Drugs (Average, 5th strongest)
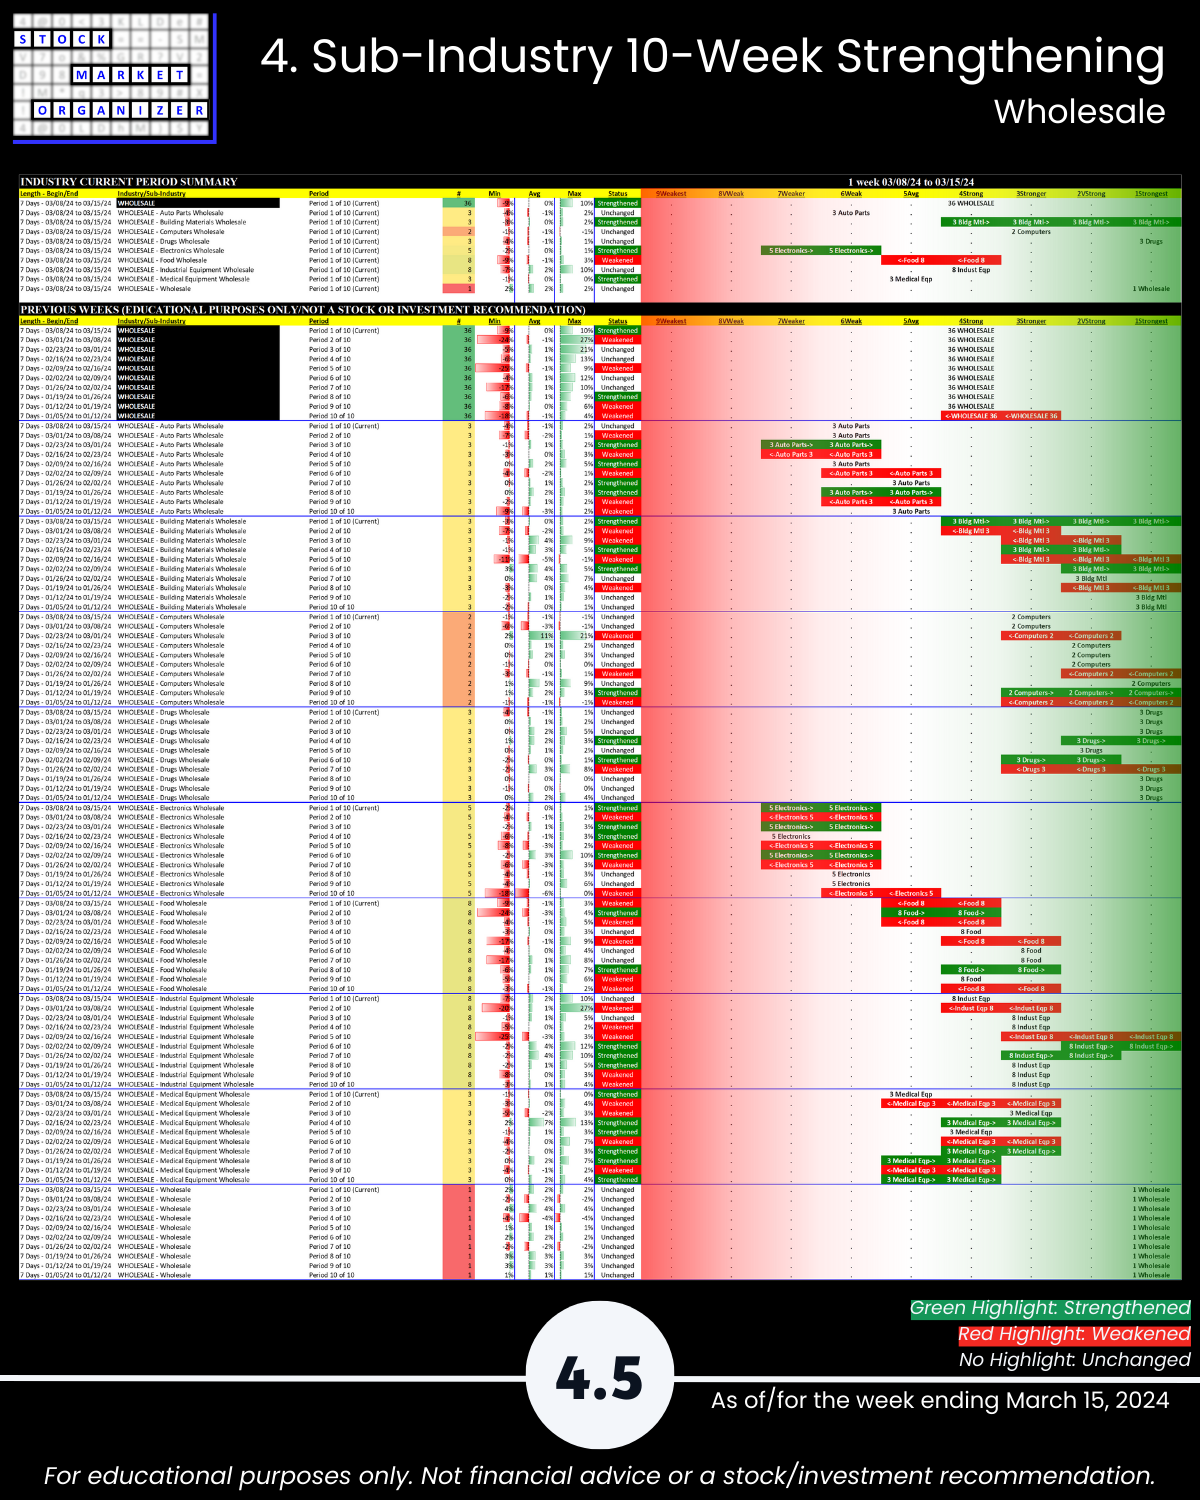
🔹 Sub-industries (30): 17% Strengthened, 7% Weakened; Wholesale-Drugs Strongest, Drugs-Diagnostic Substances Weakest
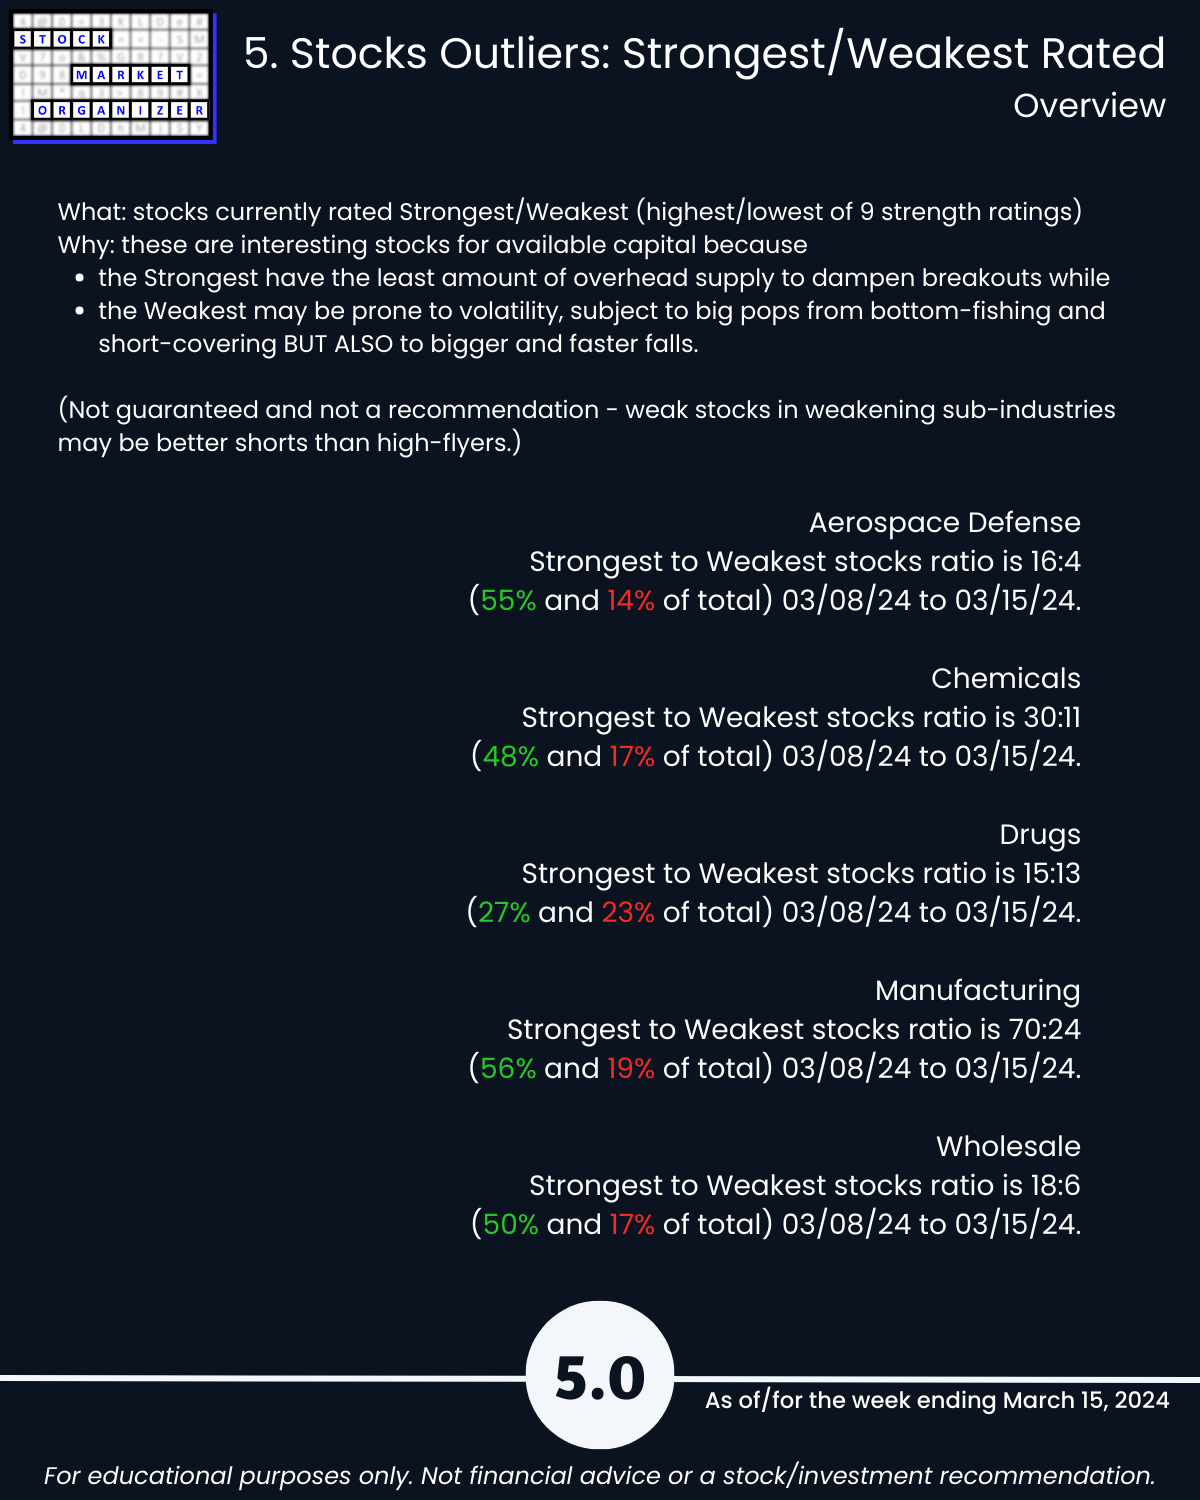
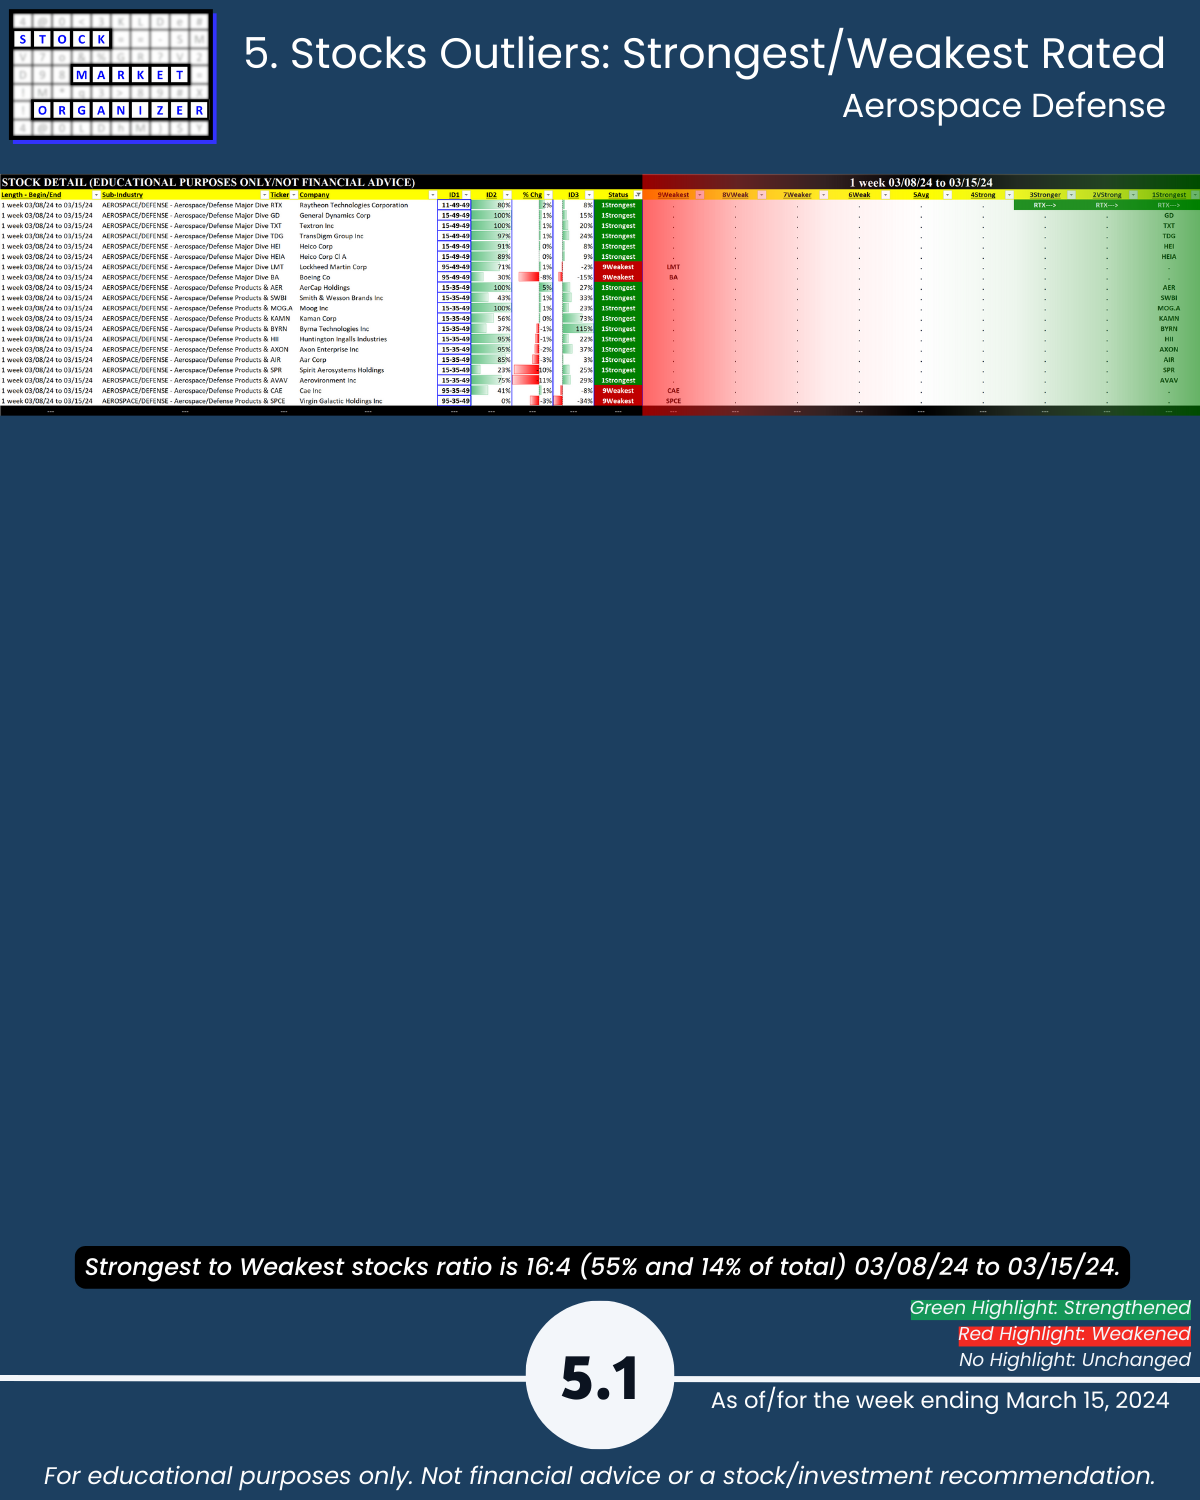
🔹 Stocks rated Strongest:Weakest: Aero Defense 55%:14%, Chemicals 48%:17%, Manufacturing 56%:19%, Wholesale 50%:17%
🔹 @ 5+Year Highs/Lows: Wholesale 17%, Manufacturing and Aerospace Defense 14% of stocks at highs
SO WHAT?
Through tracking strengthening and weakening from the individual stock through overall market levels, what does this tell you?
🔹 The strongest stocks in each industry so you can see by this measurement if there are better options than whatever you may currently own.
🔹 How all stocks in each sub-industry and industry stack up against each other in terms of current strengthening and weakening. These relationships may not continue, but it’s hard to meaningfully discern where you could go if you don’t know where you currently are. This analysis enables you to quickly see the best and worst stocks and ignore the rest.
🔹 Whether sub-industries and industries are currently strengthening – does their action support new entries or is it better to wait?
This cannot guarantee profits. The market is no one’s ATM. But…
It aligns with the concepts that
THE STRONGER YOUR STOCKS, THE GREENER YOUR P&L, and
IT DOESN’T HAVE TO BE SO COMPLICATED.
This report may particularly be of interest if the following 5 concepts resonate with you:
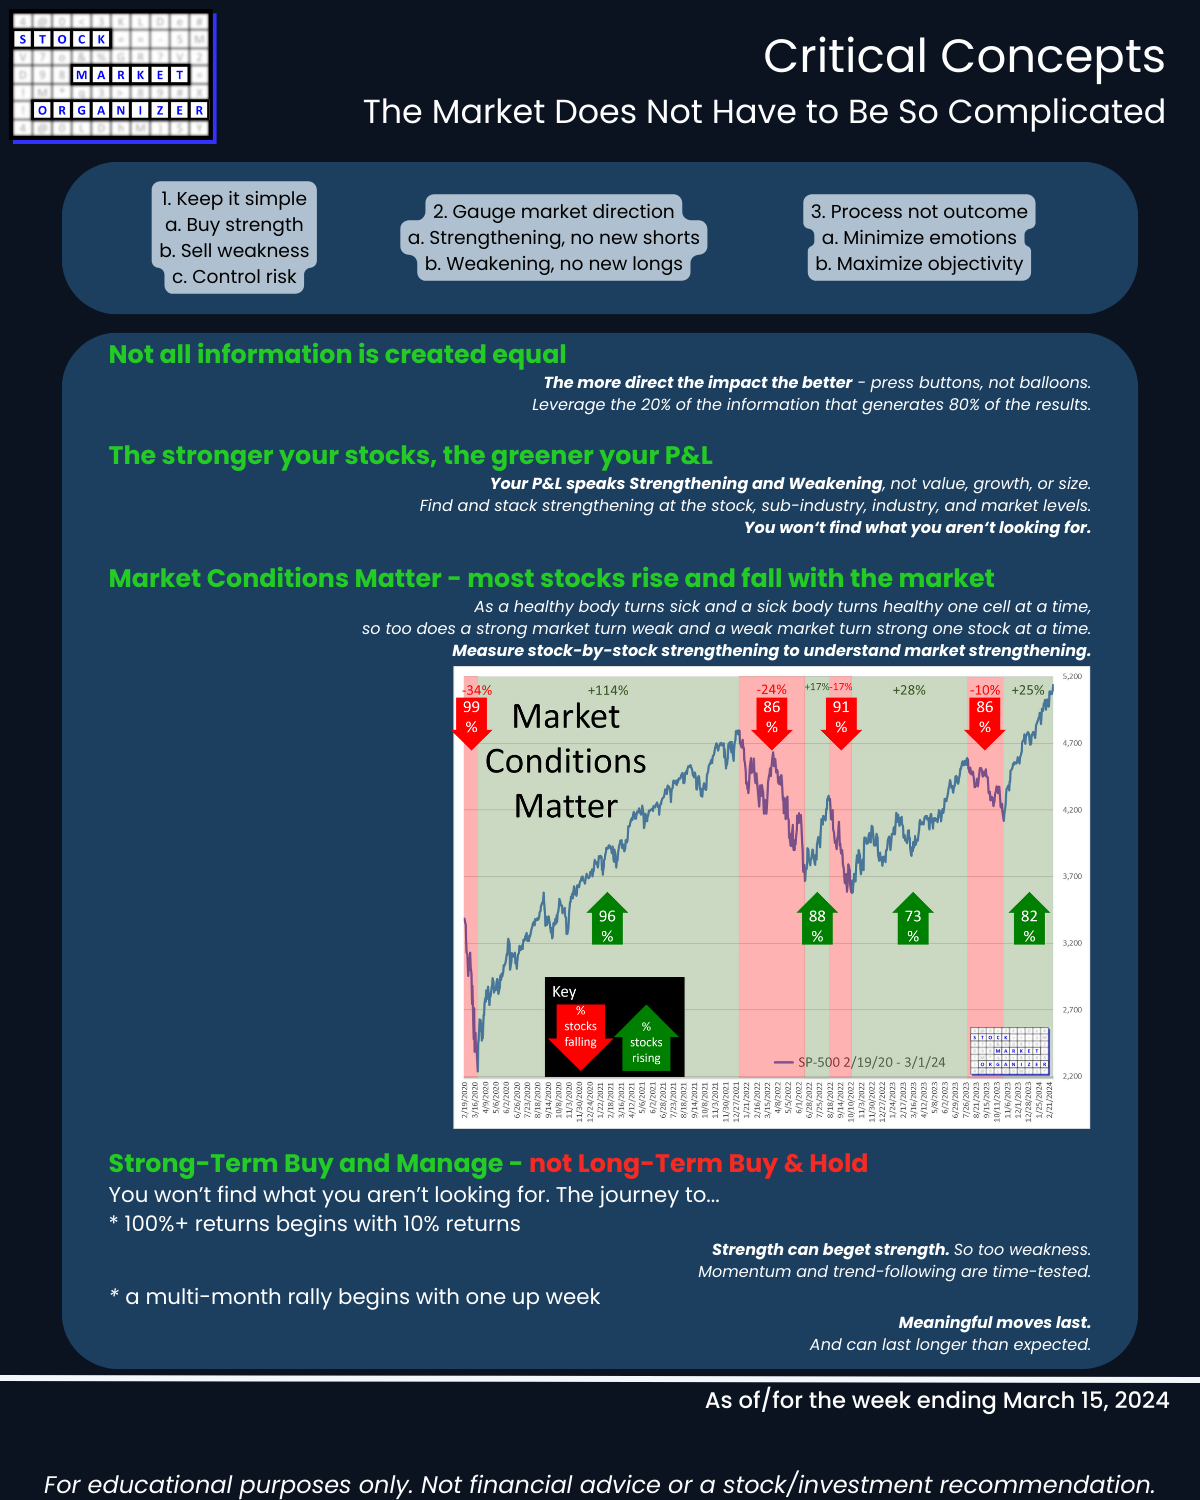
- The stronger your stocks, the greener your P&L.
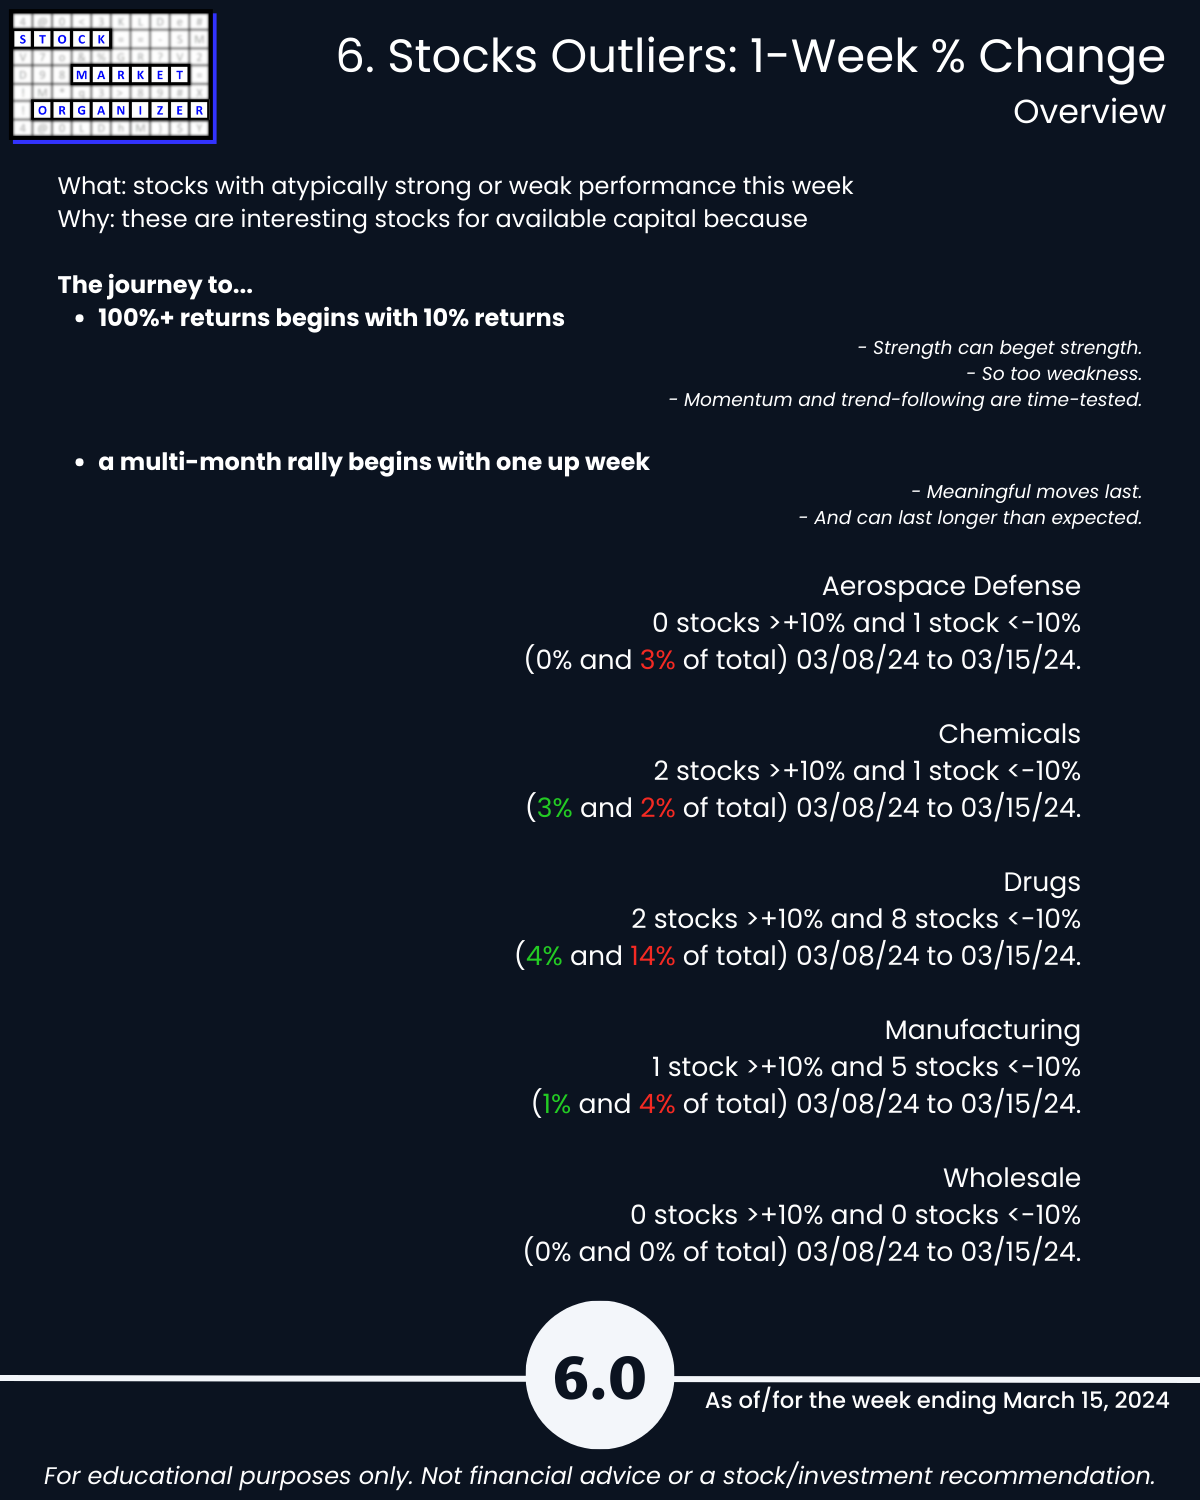
- The journey to 100%+ returns begins with 10% returns.
- The journey to a multi-month rally begins with one up week.
- Most stocks do what the market does. (While the market can only do what its underlying stocks, sub-industries, and industries do.)
- 80/20: not all information is created equal. (Press buttons, not balloons.)
Following are galleries with page-by-page views of this report.
1. Introduction
2. Industry 1-Week Strengthening
3. Industry 10-Week Strengthening
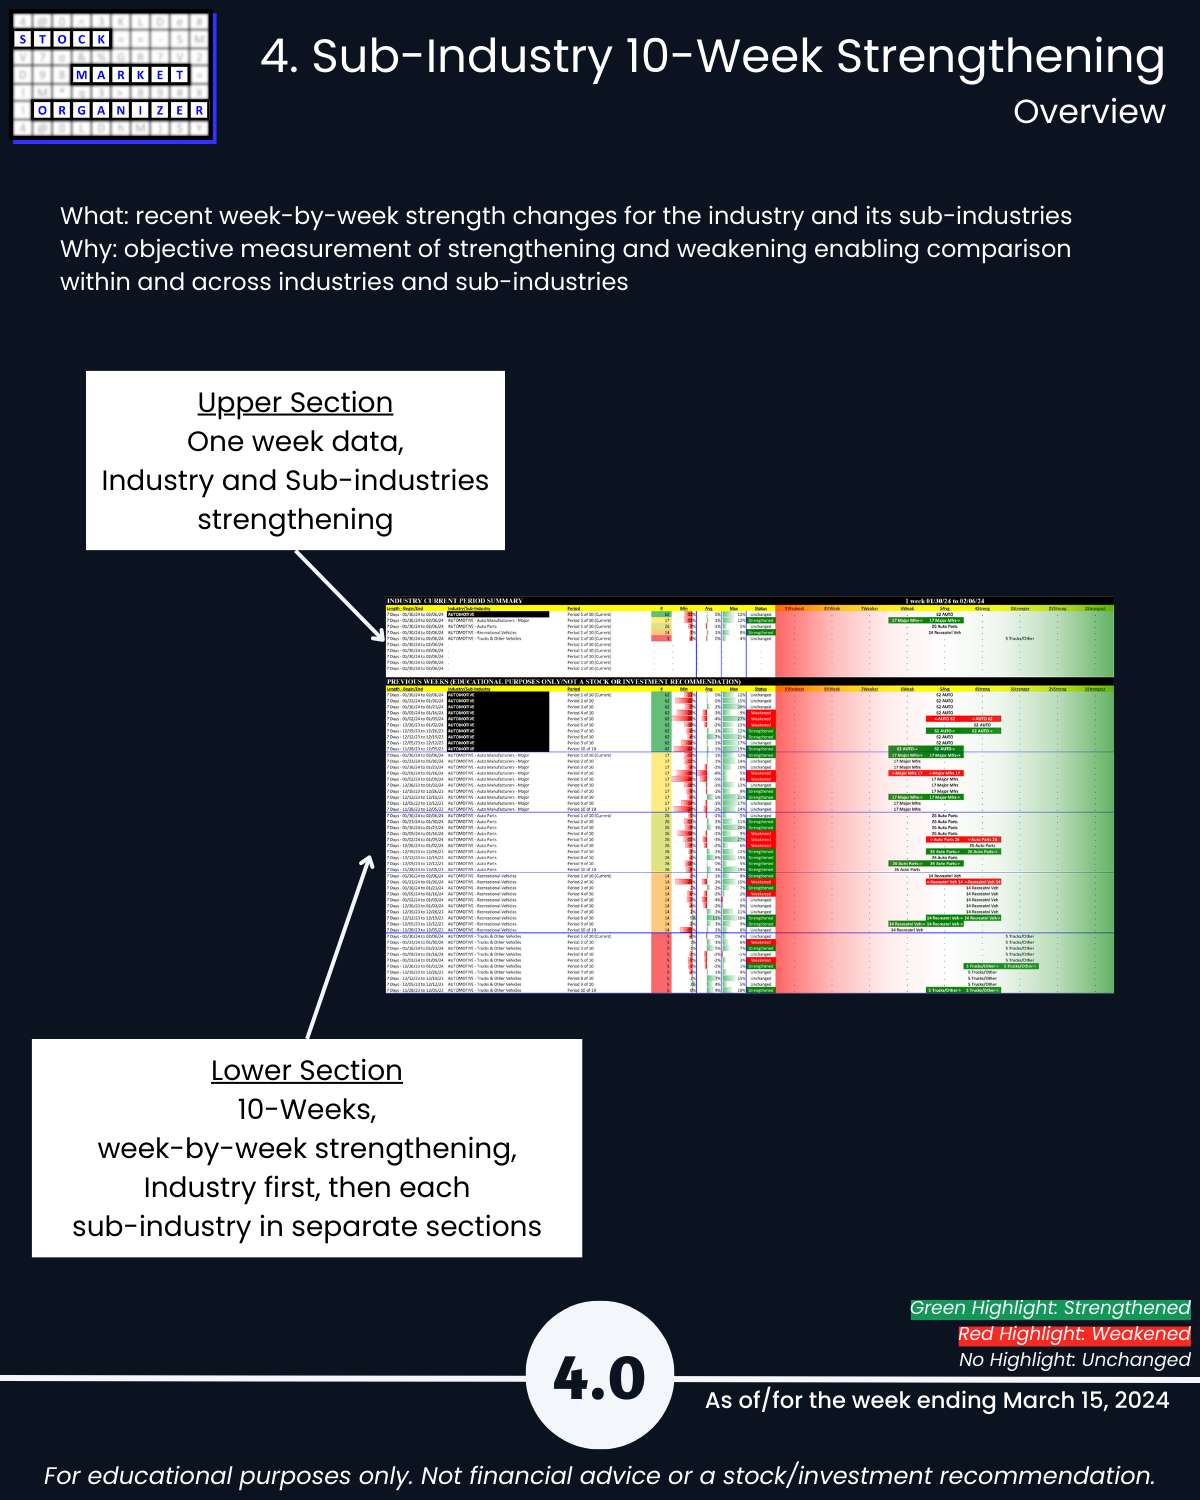
4. Sub-Industry 10-Week Strengthening
5. Stocks Outliers: Strongest/Weakest Rated
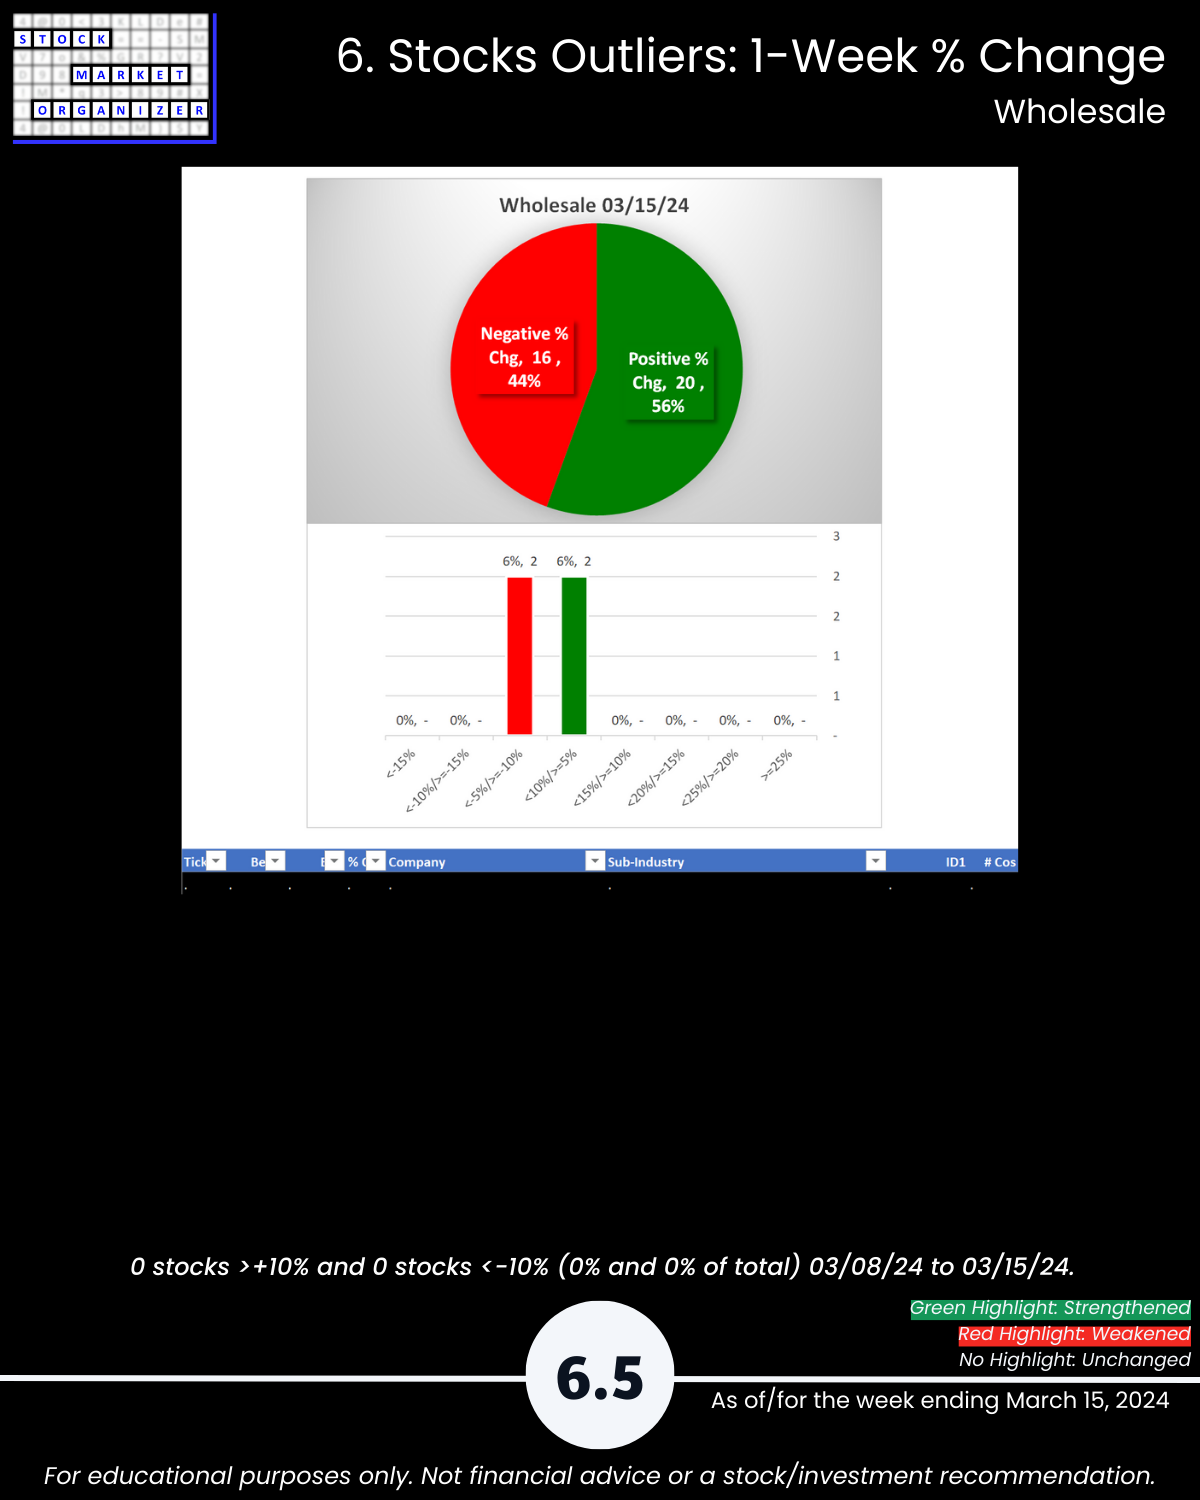
6. Stocks Outliers: 1-Week % Change
7. Stocks Outliers: 5-Year Highs/Lows