SMO Exclusive: Strength Report Financial Sector 2024-03-20

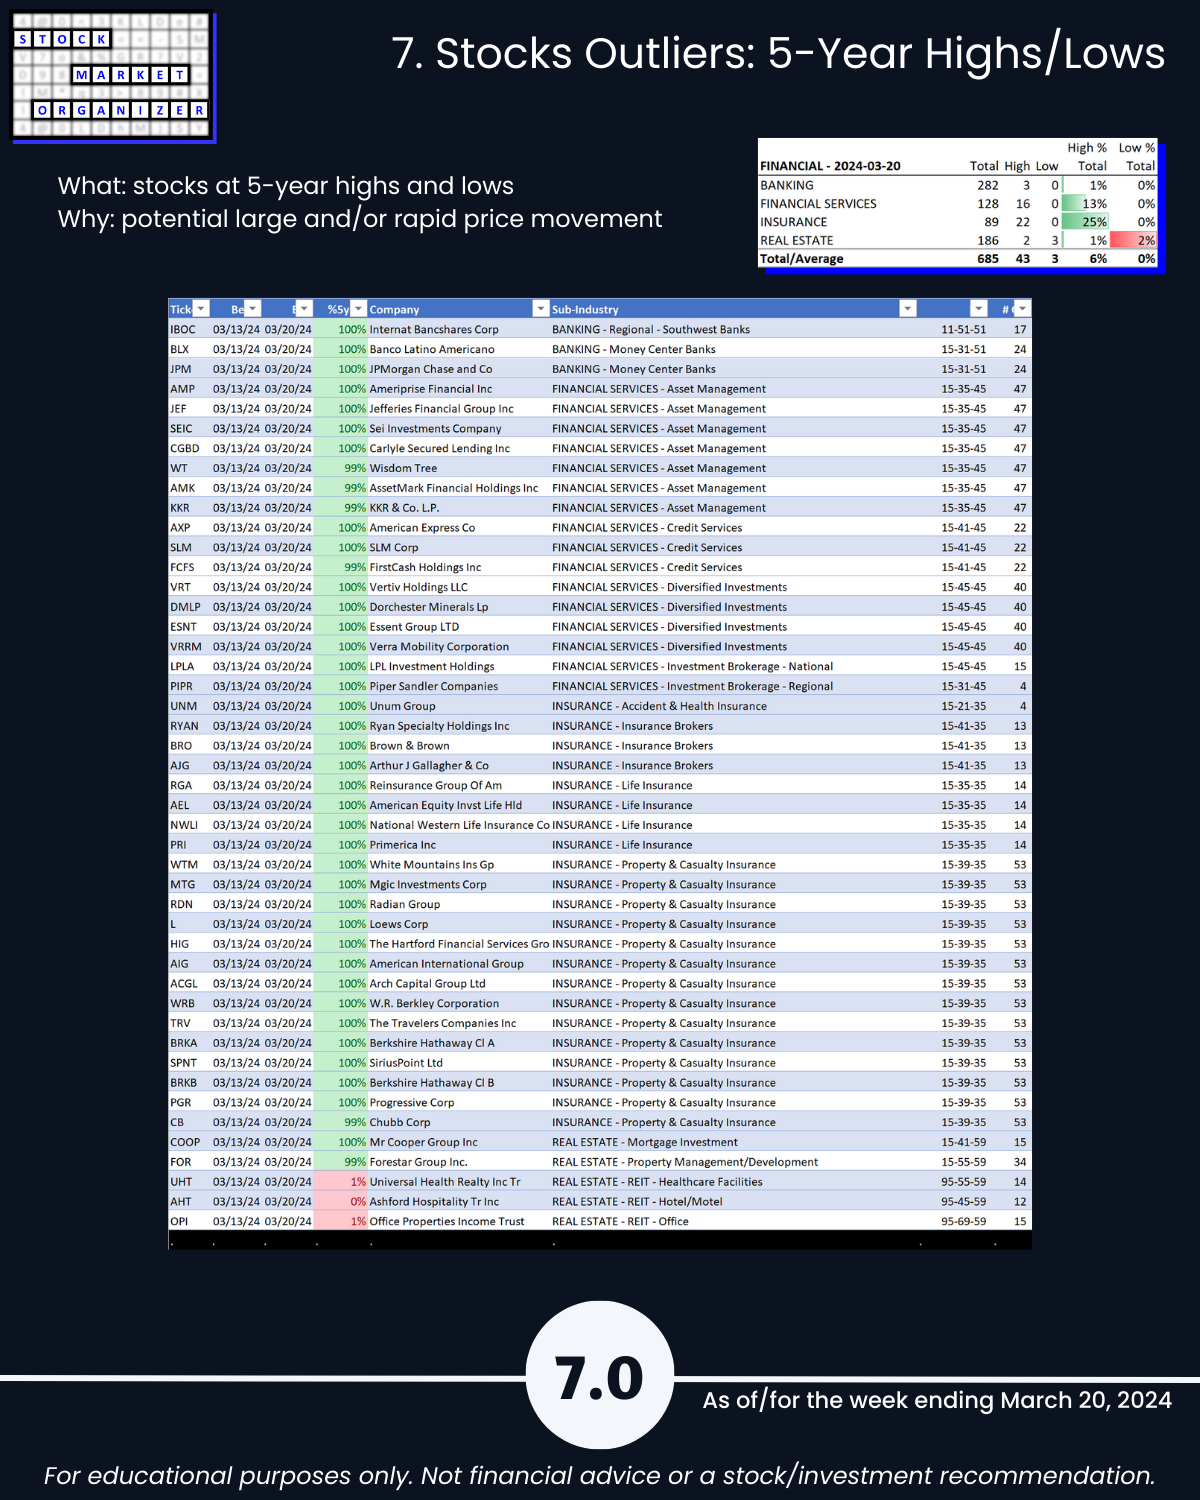
3/20/24 do you know where there is strength in today’s Financial Sector industries - Banking, Financial Services, Insurance, and Real Estate? What I know that you may not: 43 Financial Sector stocks (6% of total) are at 5+ year highs and only 3 are at 5+ year lows. 22 of these (25% of the industry total) are Insurance stocks.
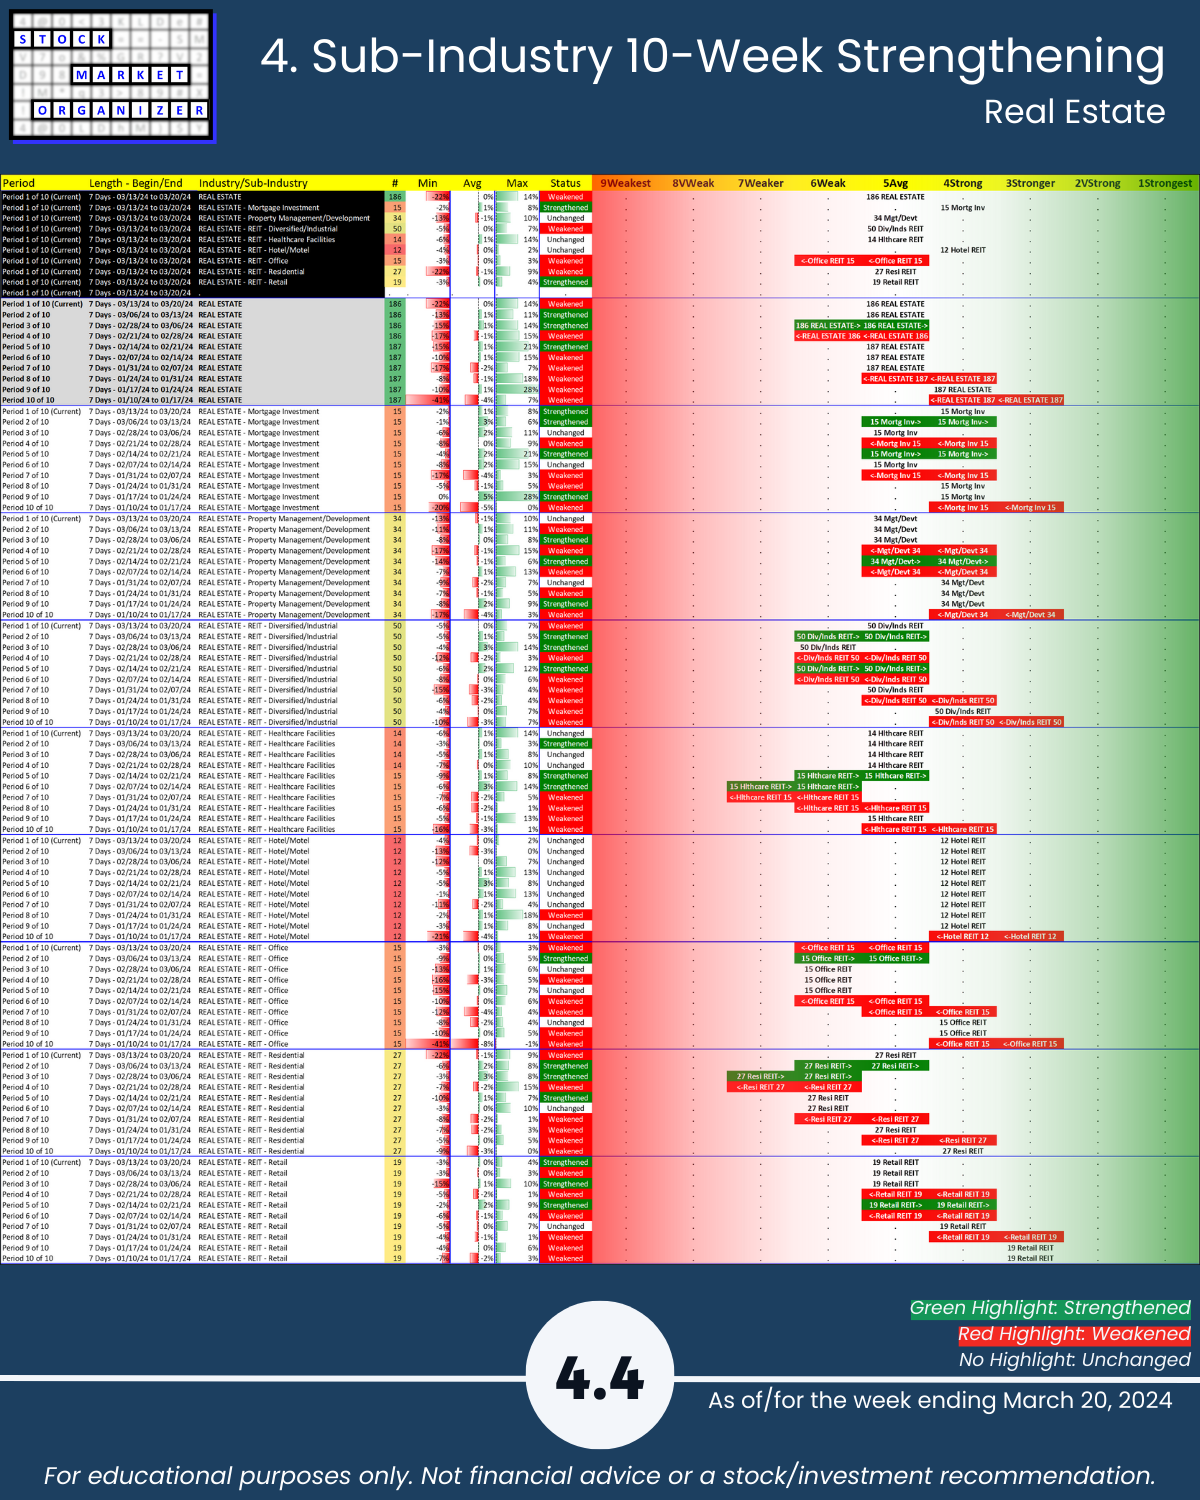
Meanwhile, CRE pros will know which REITs are strongest and weakest and if they don’t I’ve listed the Strongest and Weakest stocks (educational purposes only) below per my methodology.
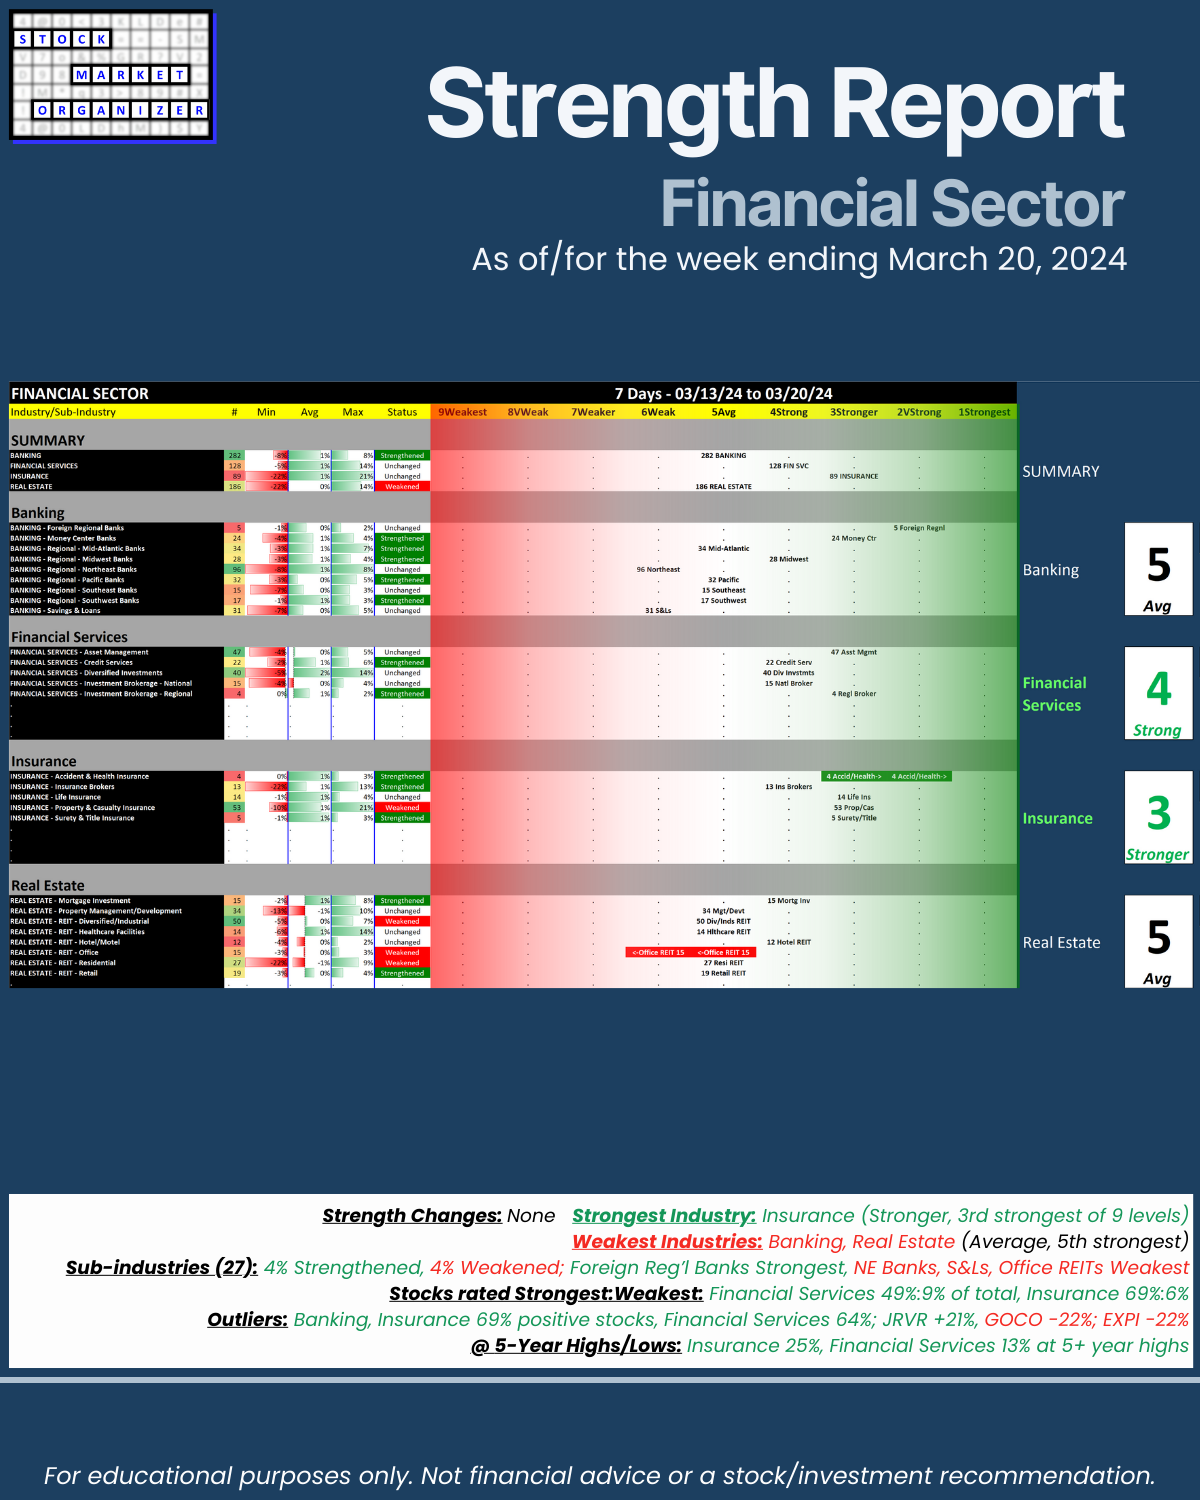
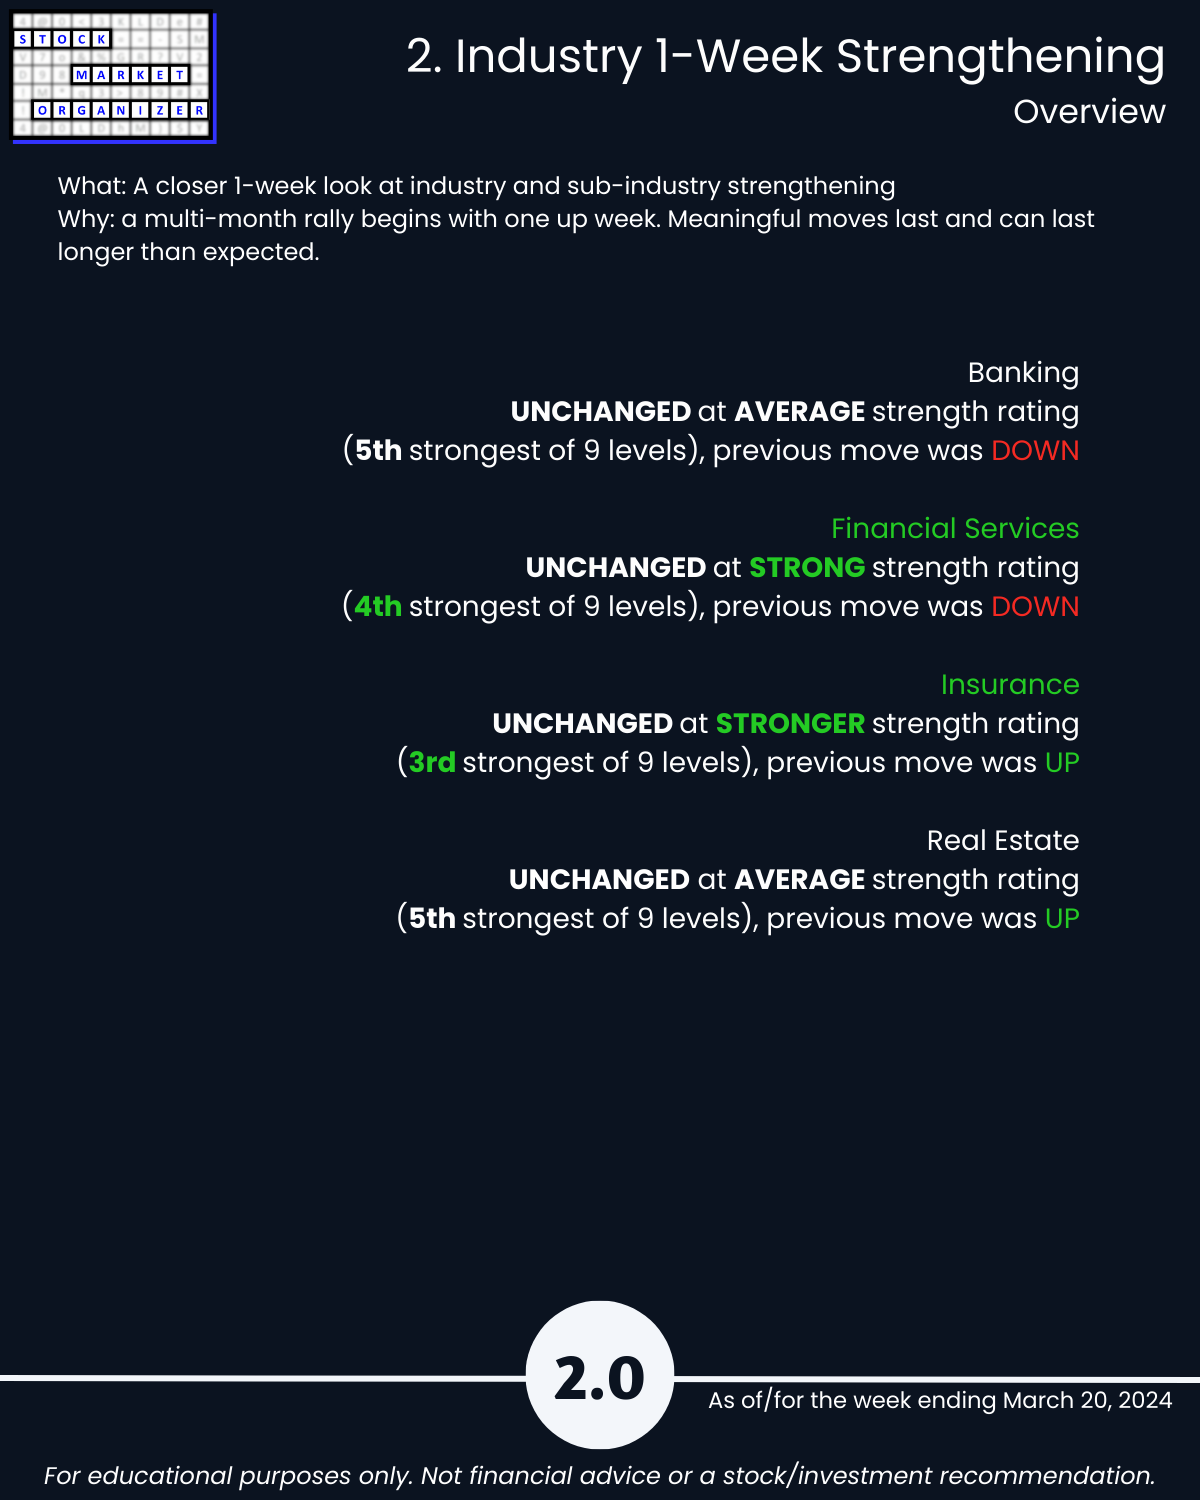
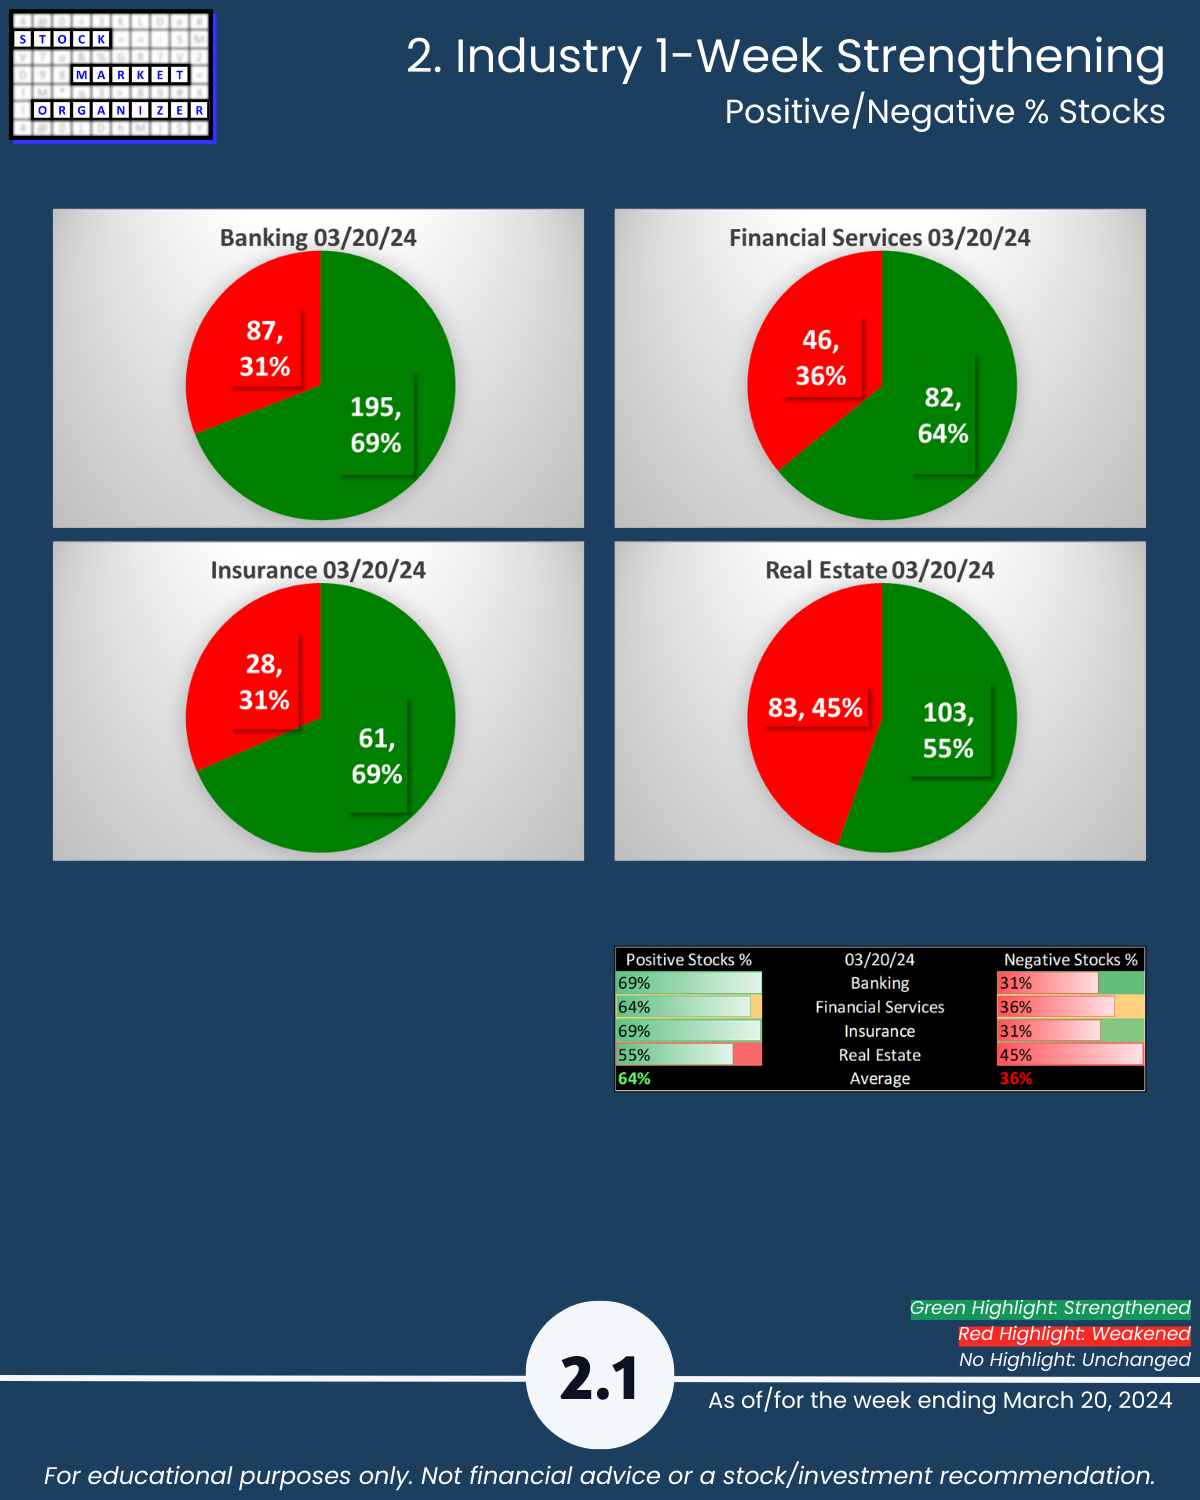
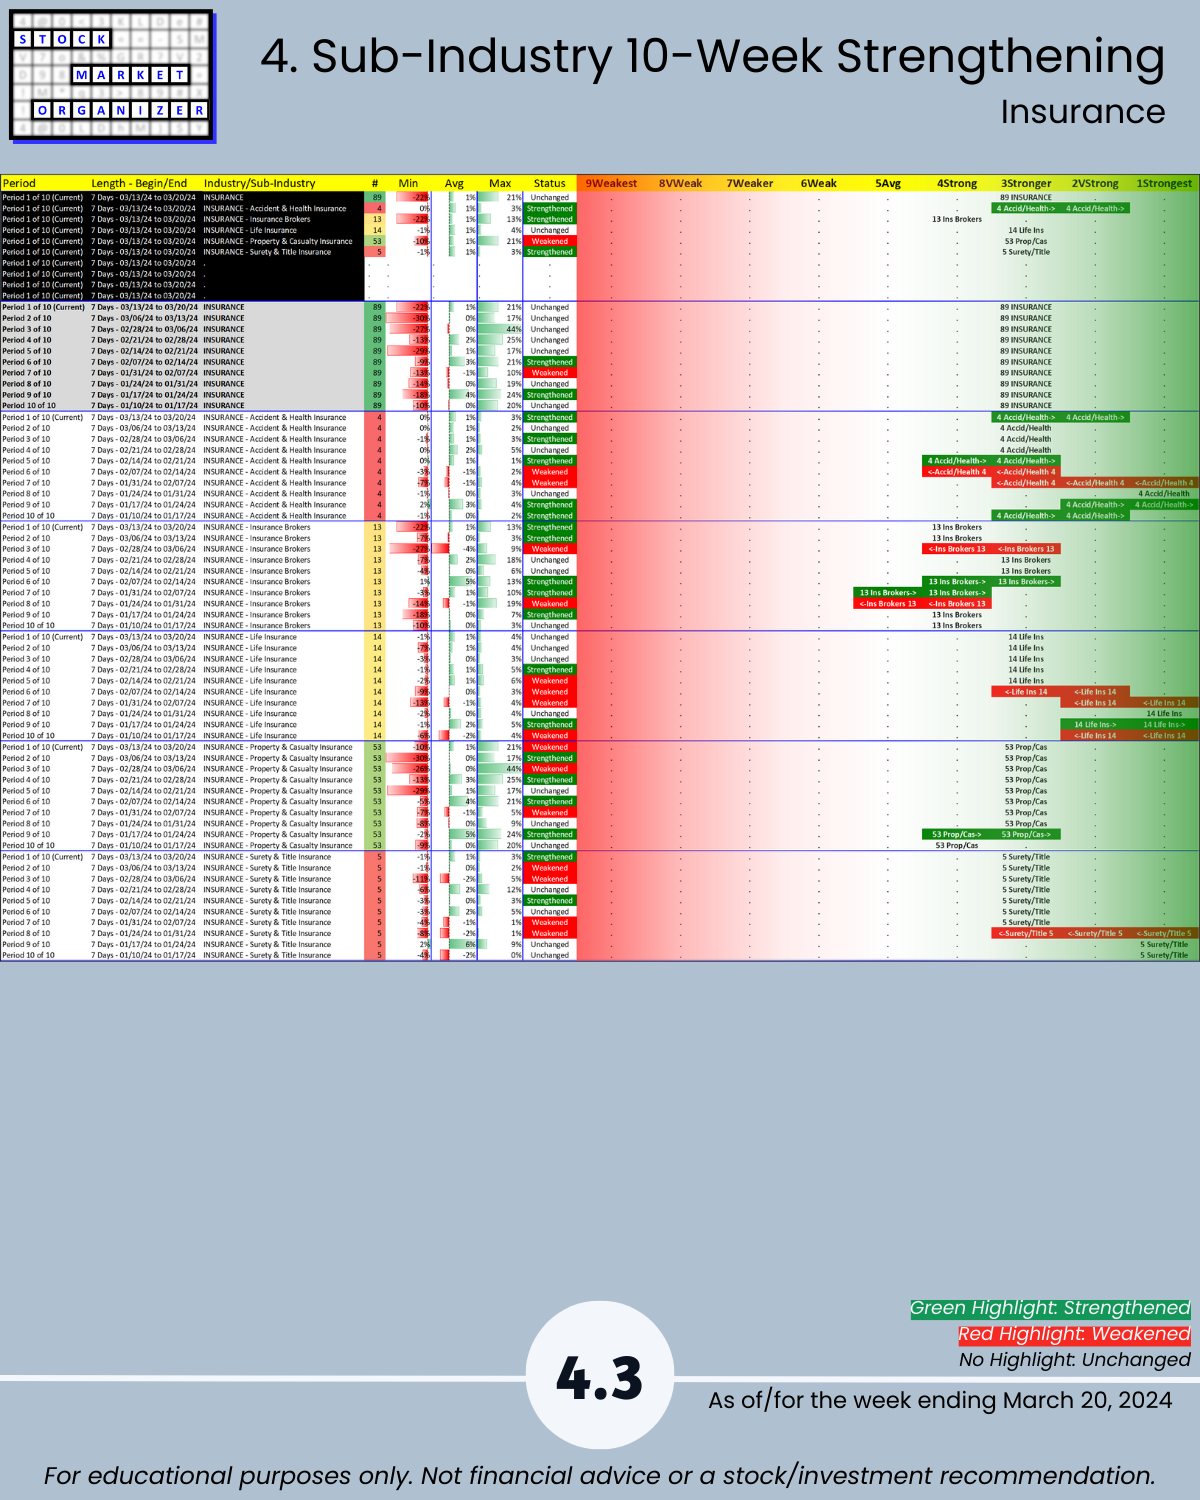
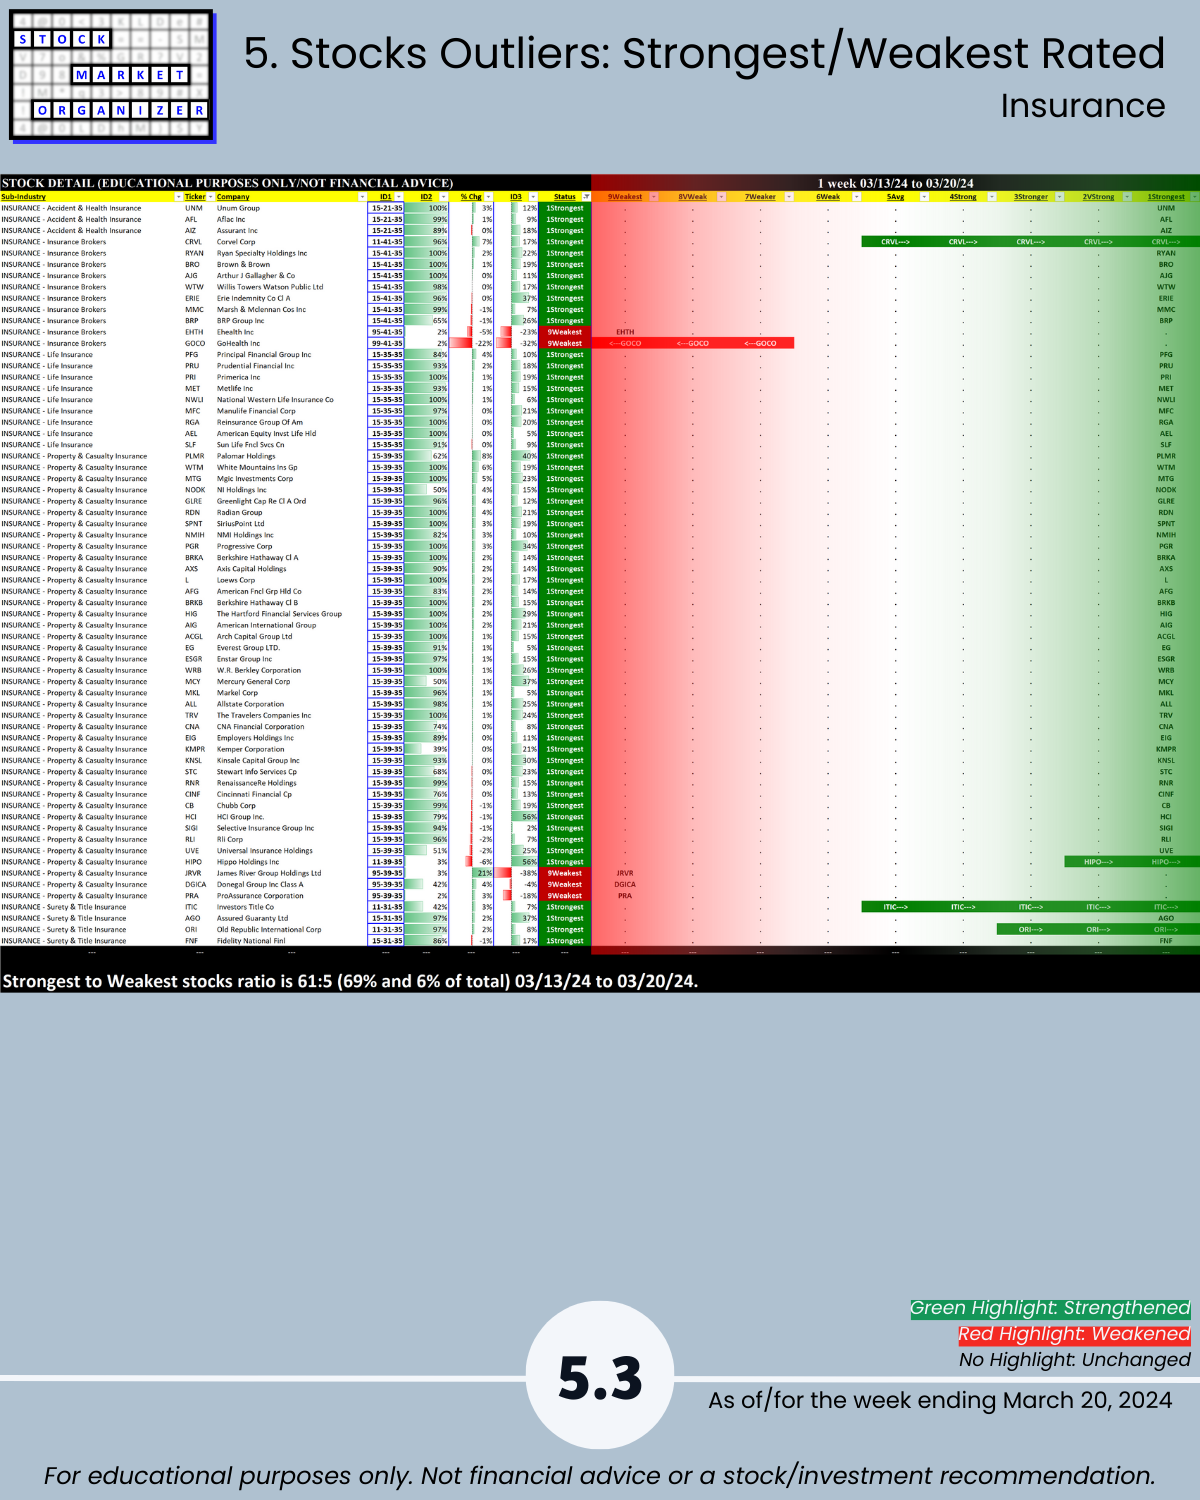
Overall, the Financial Sector had a very quiet week but a unique strength view helpfully reveals 🔹 average 64% positive stocks 🔹 Insurance leads (as it has since strengthening the week ending 1/3/24) and remains Stronger (3rd strongest) with 🔹 69% positive stocks for the week (tied with Banking), and 🔹 69% stocks rated Strongest (highest of 9 strength levels).
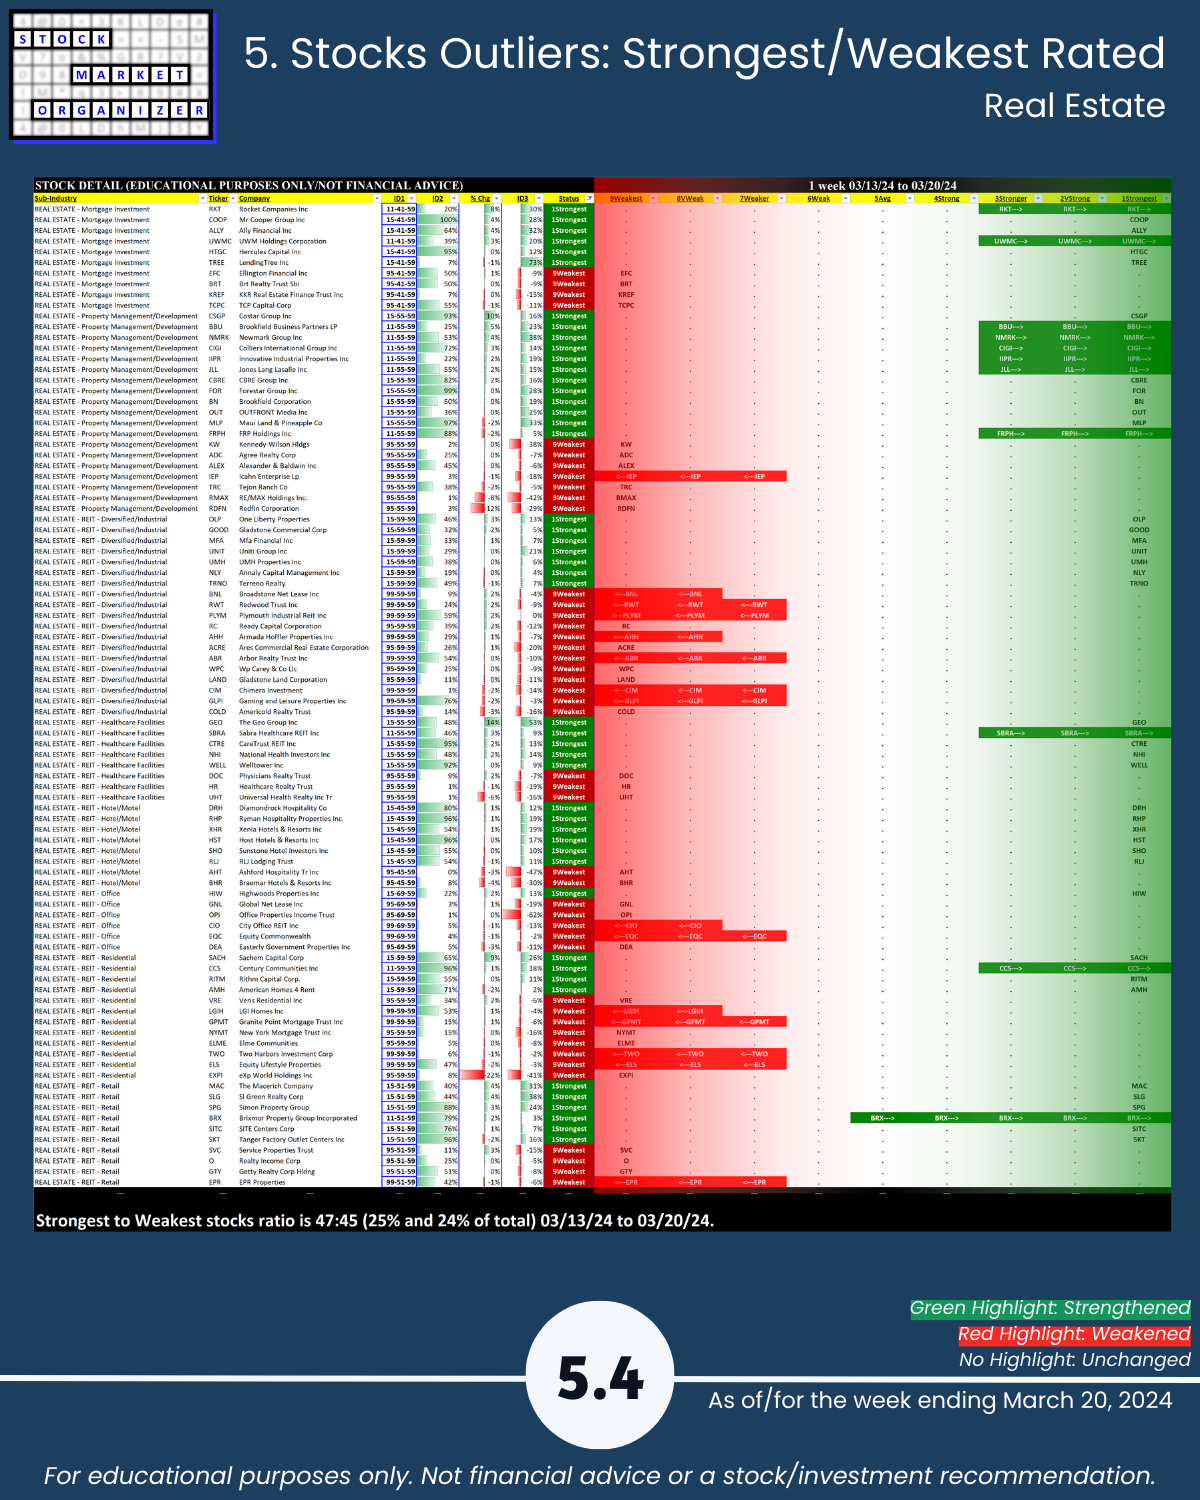
In the Real Estate industry, Hotel REITs are strongest at Strong (4th strongest) and are led by the 6 rated Strongest (DRH, RHP, XHR, HST, SHO, RLJ) while dragged down by the 2 rated Weakest (AHT, BHR).
Office REITs weakened this week and are weakest at Weak (6th strongest) with only 1 stock rated Strongest (HIW) and 5 rated Weakest (GNL, OPI, CIO, EQC, DEA).
SIDE NOTE
Anyone can eyeball a chart and say whether it is strengthening or weakening. What the average observer cannot do is tell you whether what’s happening at the sub-industry, industry, and market levels helps or hinders the stock’s action.
This system can.
HIGHLIGHTS
🔹 Strength Changes: None
🔹 Strongest Industry: Insurance (Stronger, 3rd strongest of 9 levels)
🔹 Weakest Industries: Banking, Real Estate (Average, 5th strongest)
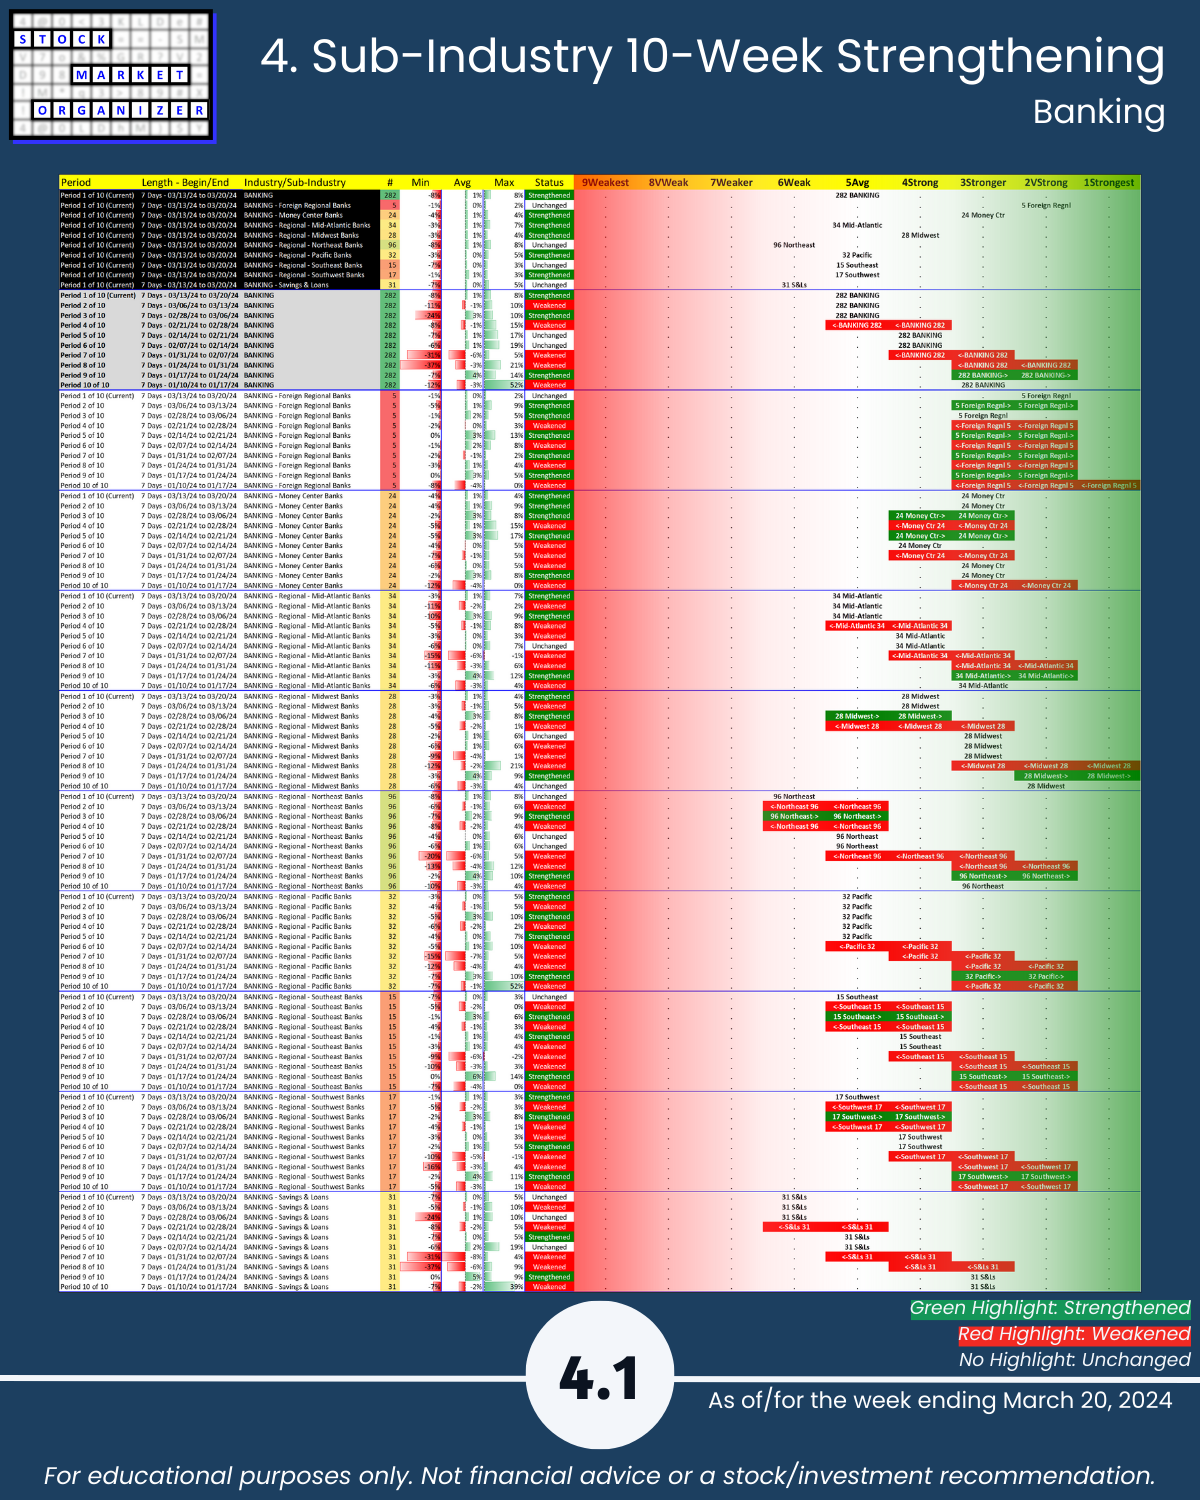
🔹 Sub-industries (27): 4% Strengthened, 4% Weakened; Foreign Reg’l Banks Strongest, NE Banks, S&Ls, Office REITs Weakest
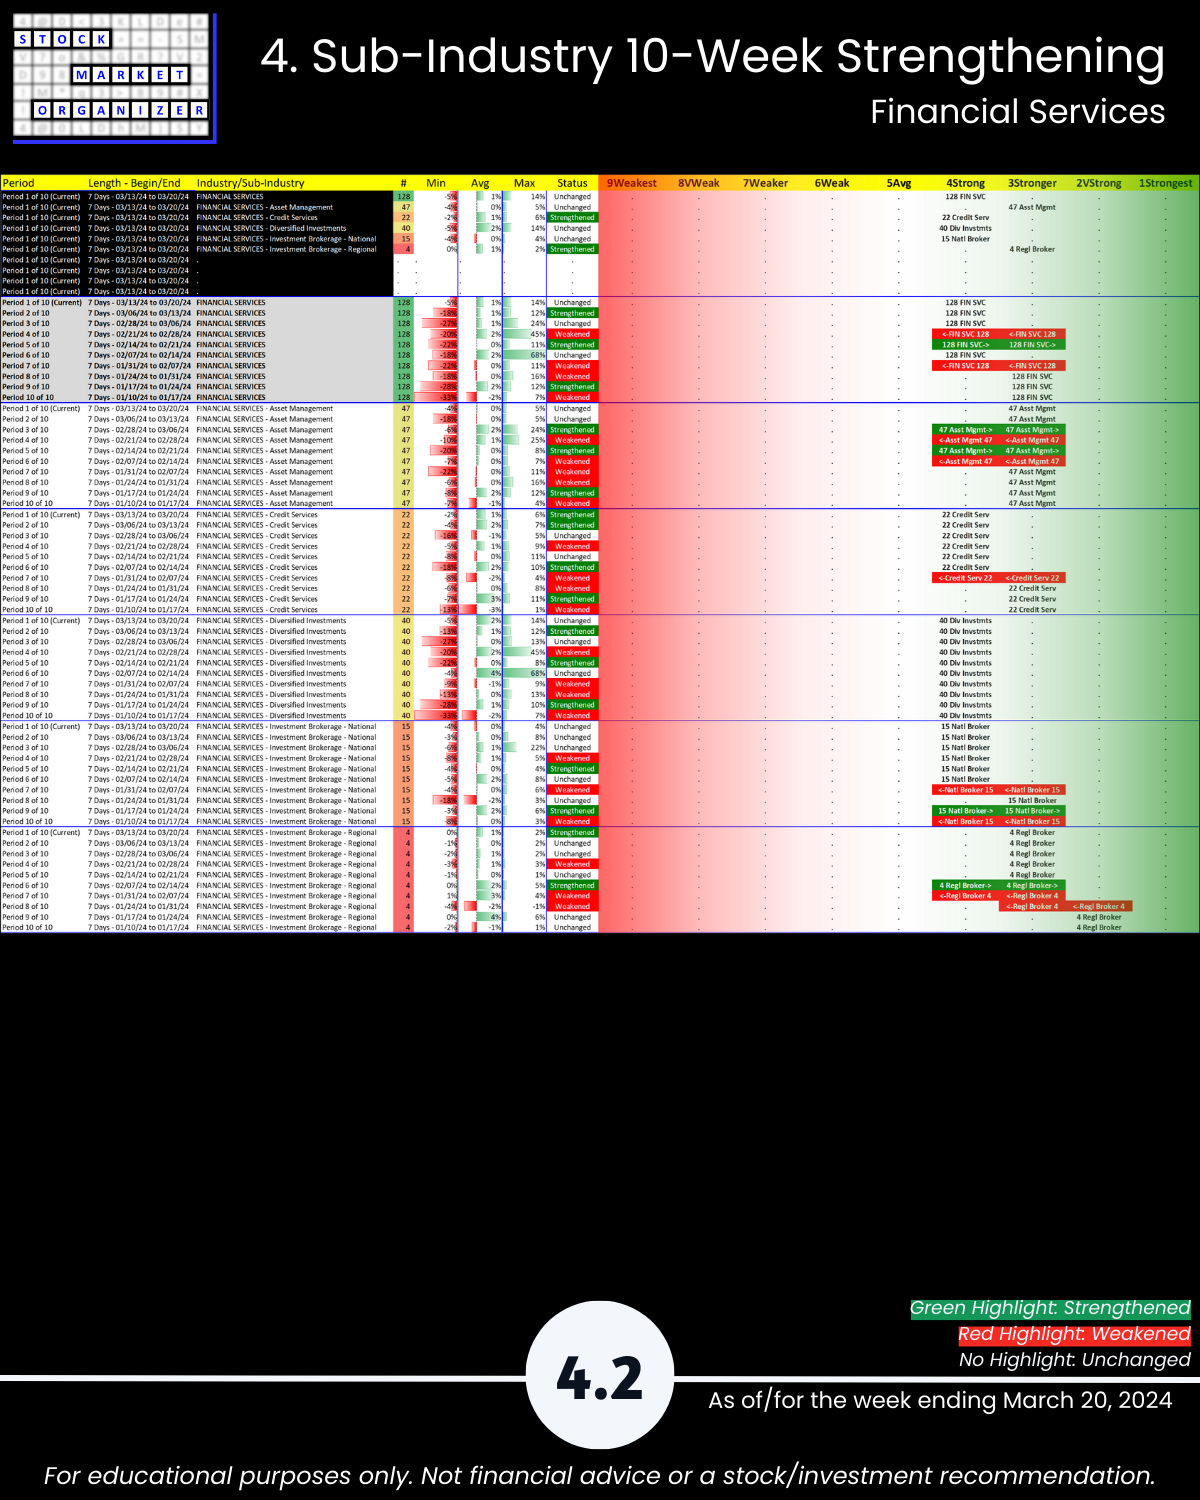
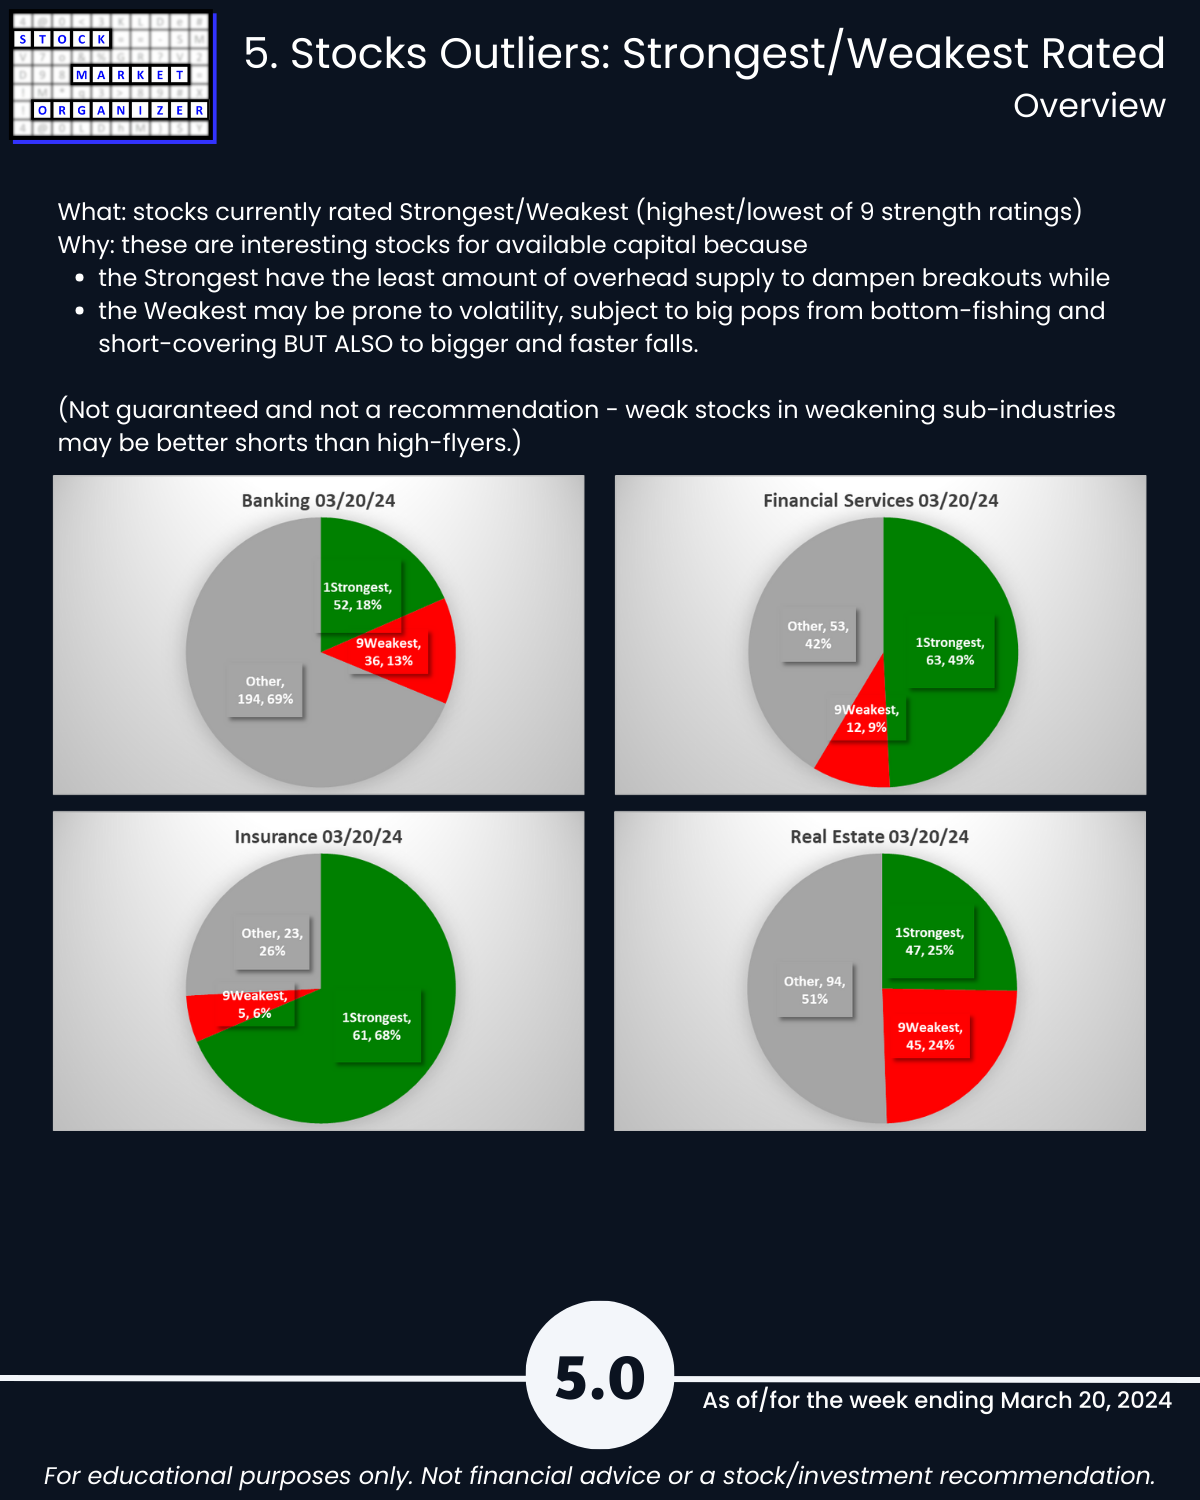
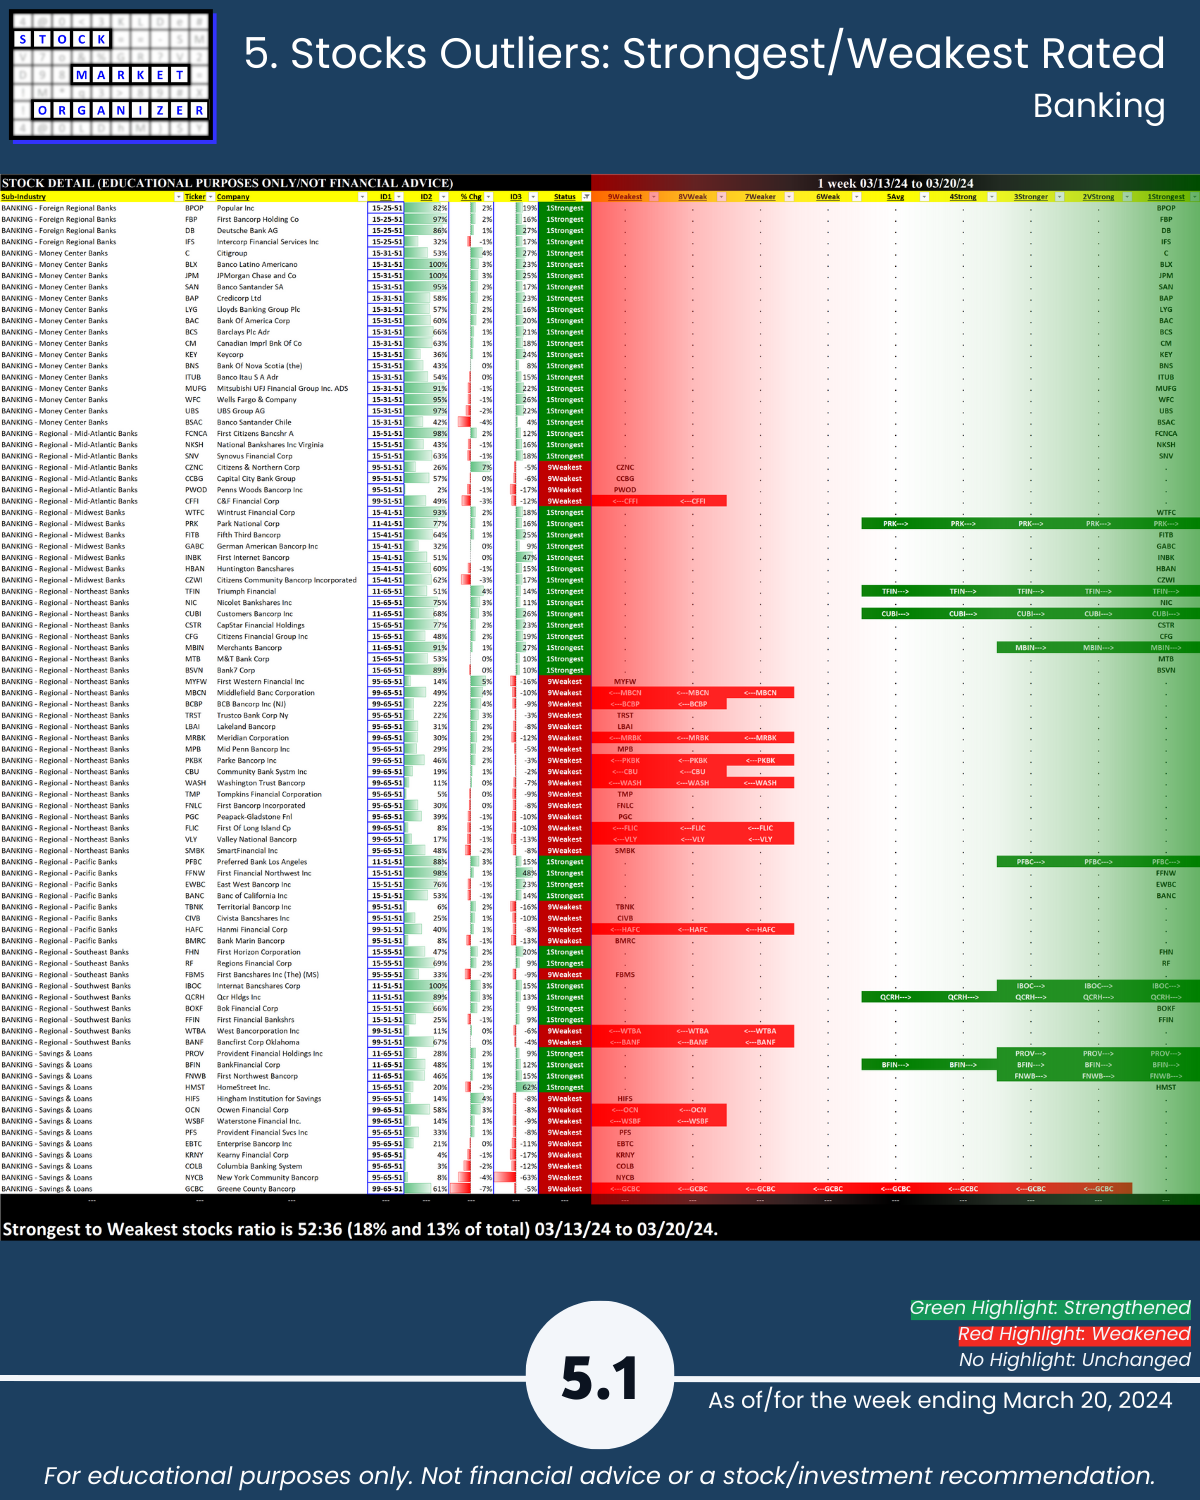
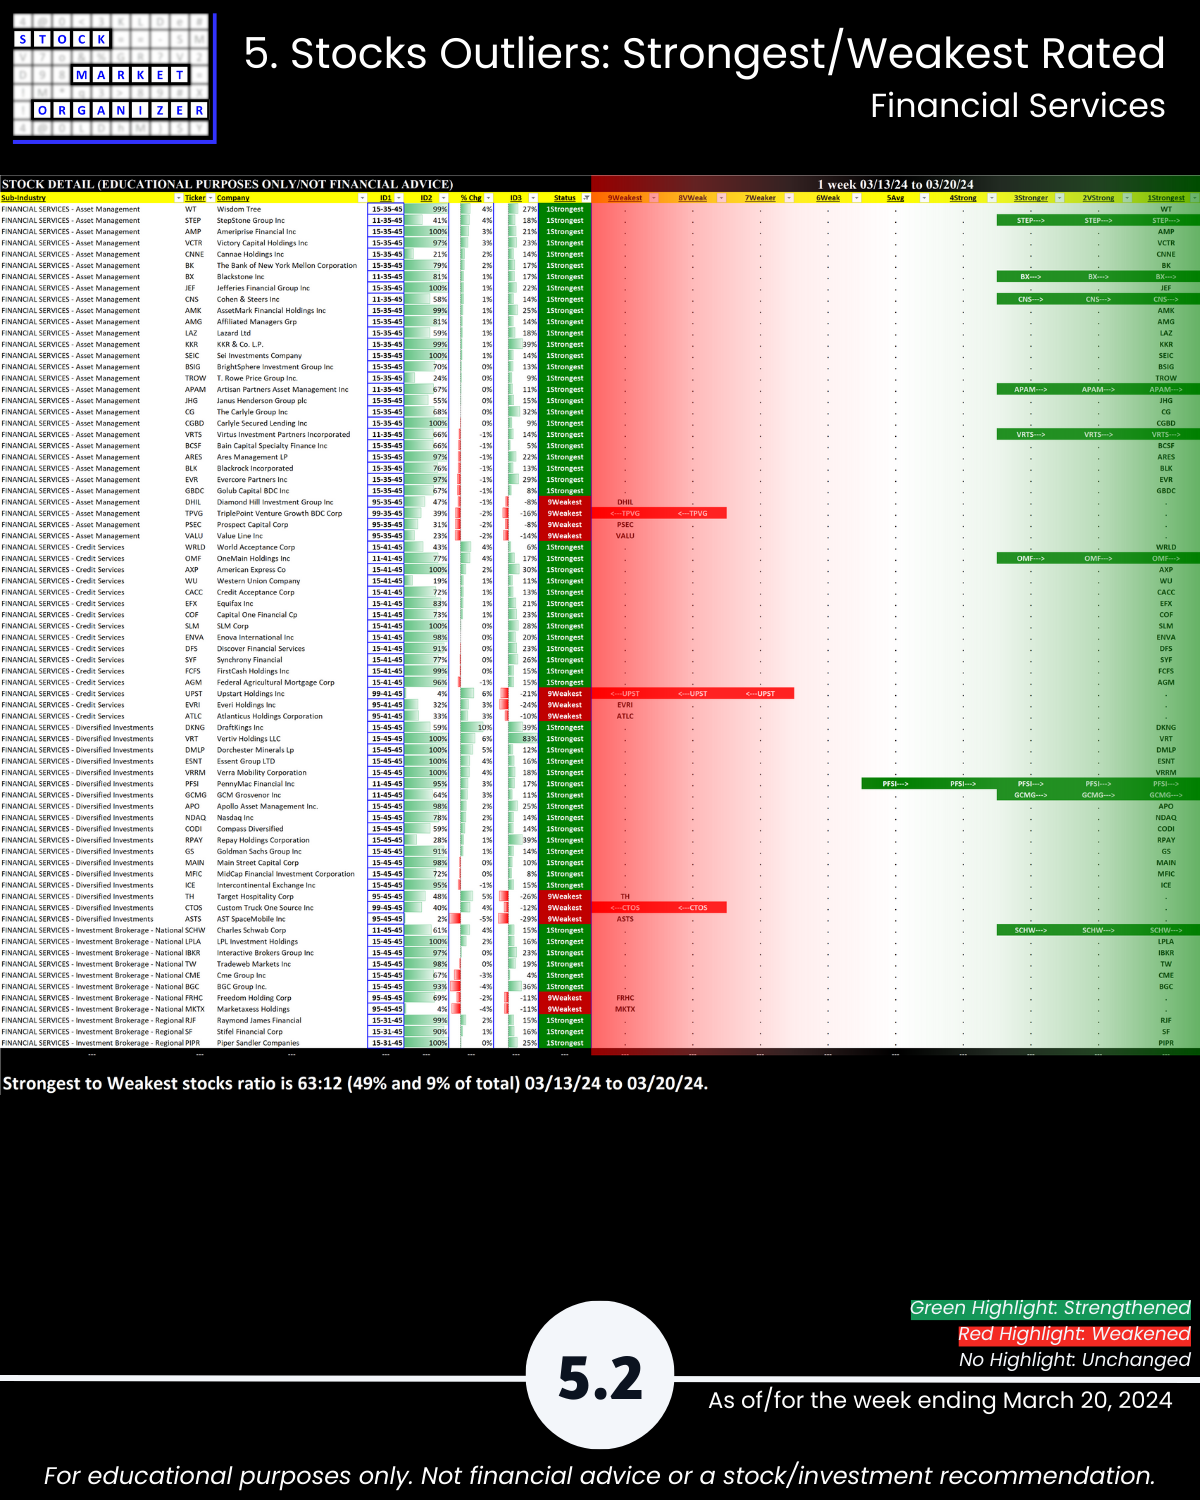
🔹 Stocks rated Strongest:Weakest: Financial Services 49%:9% of total, Insurance 69%:6%
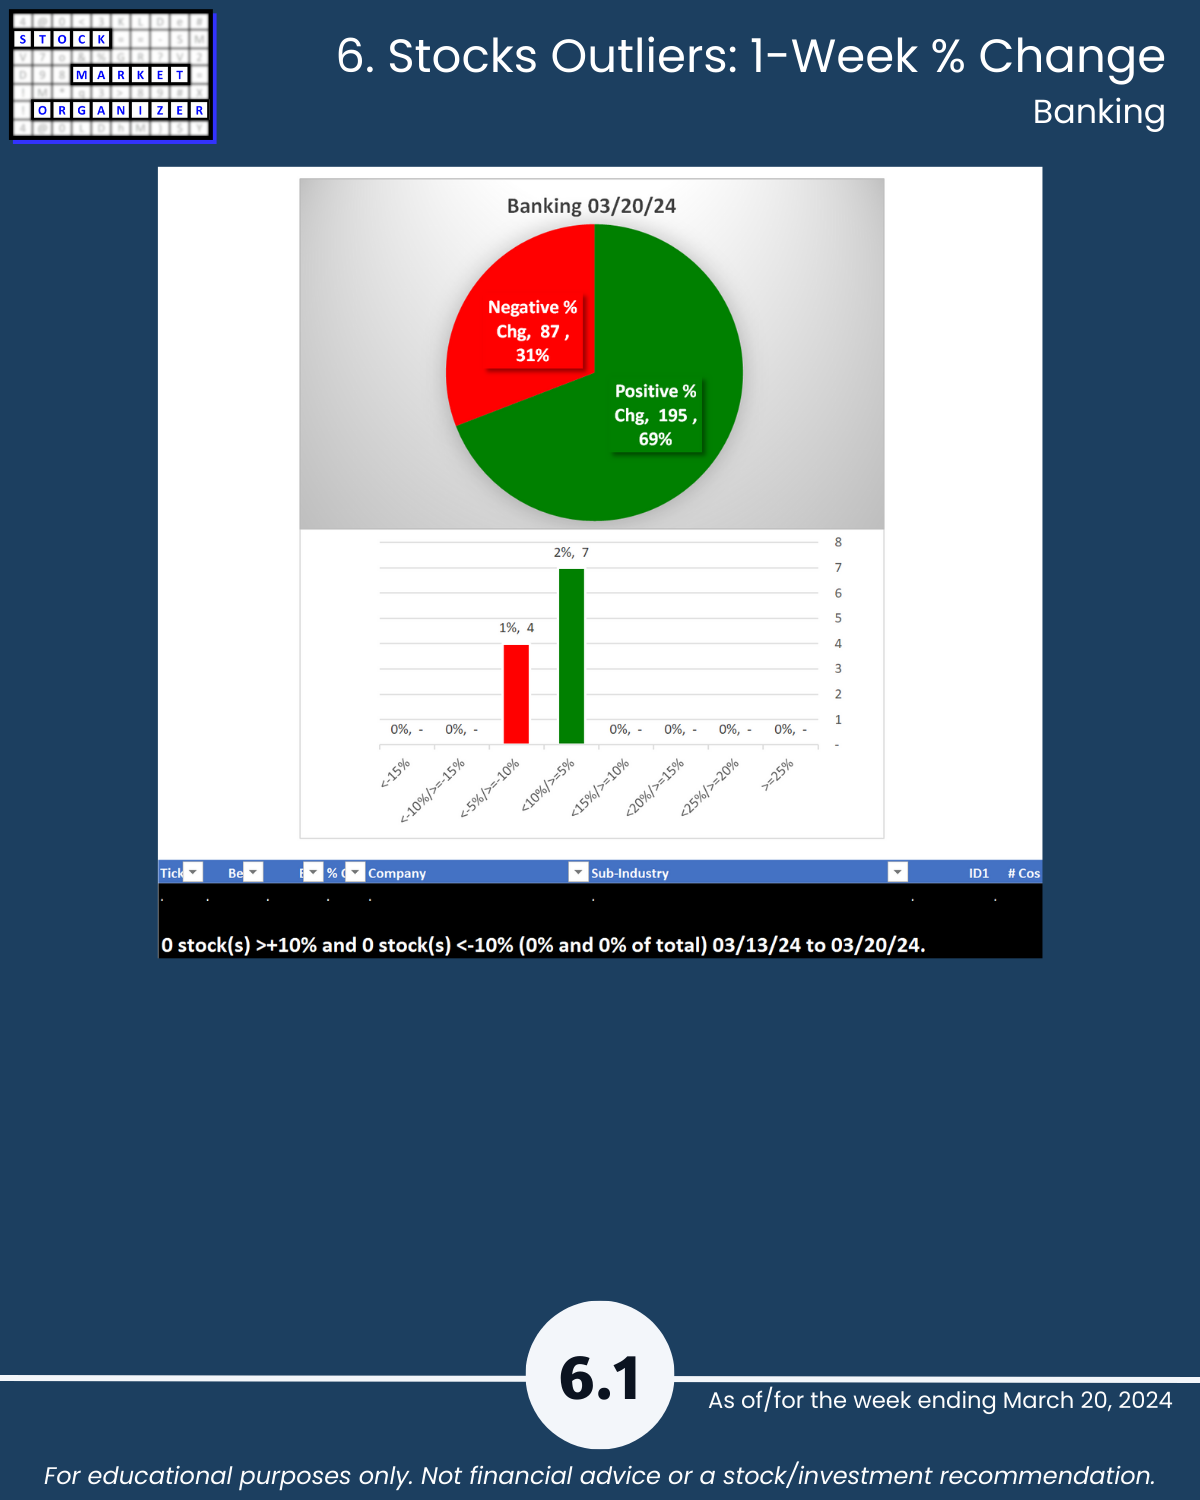
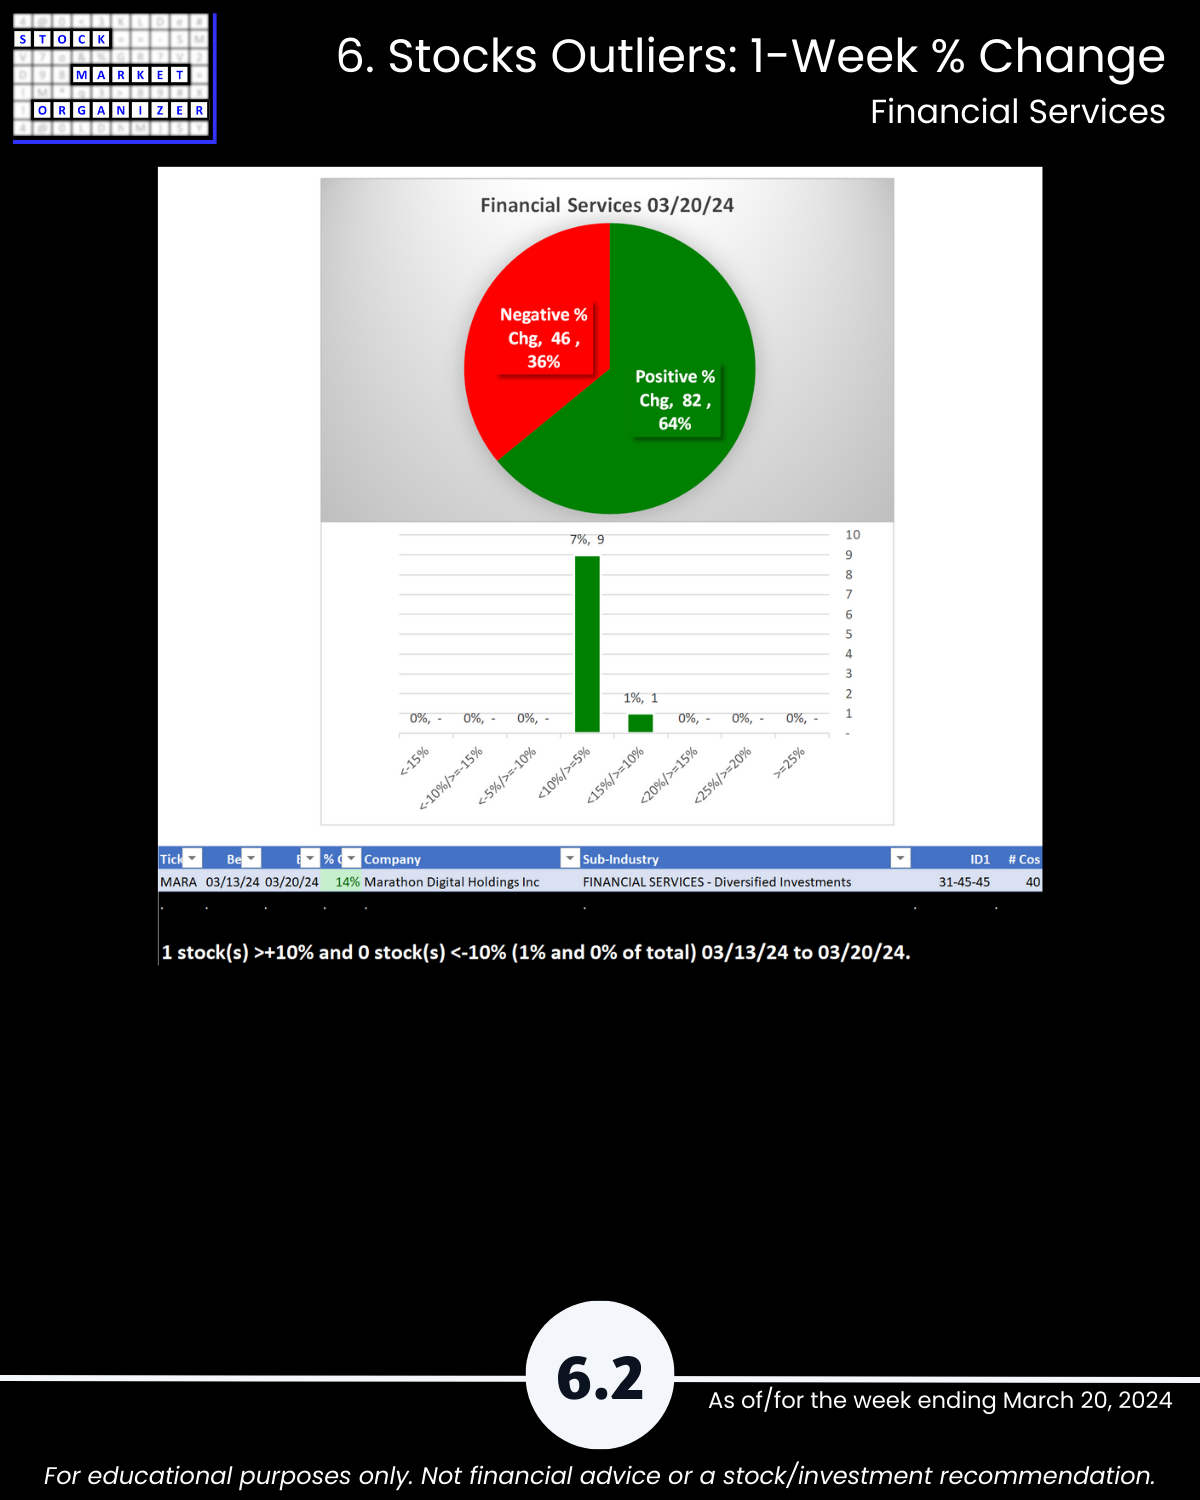
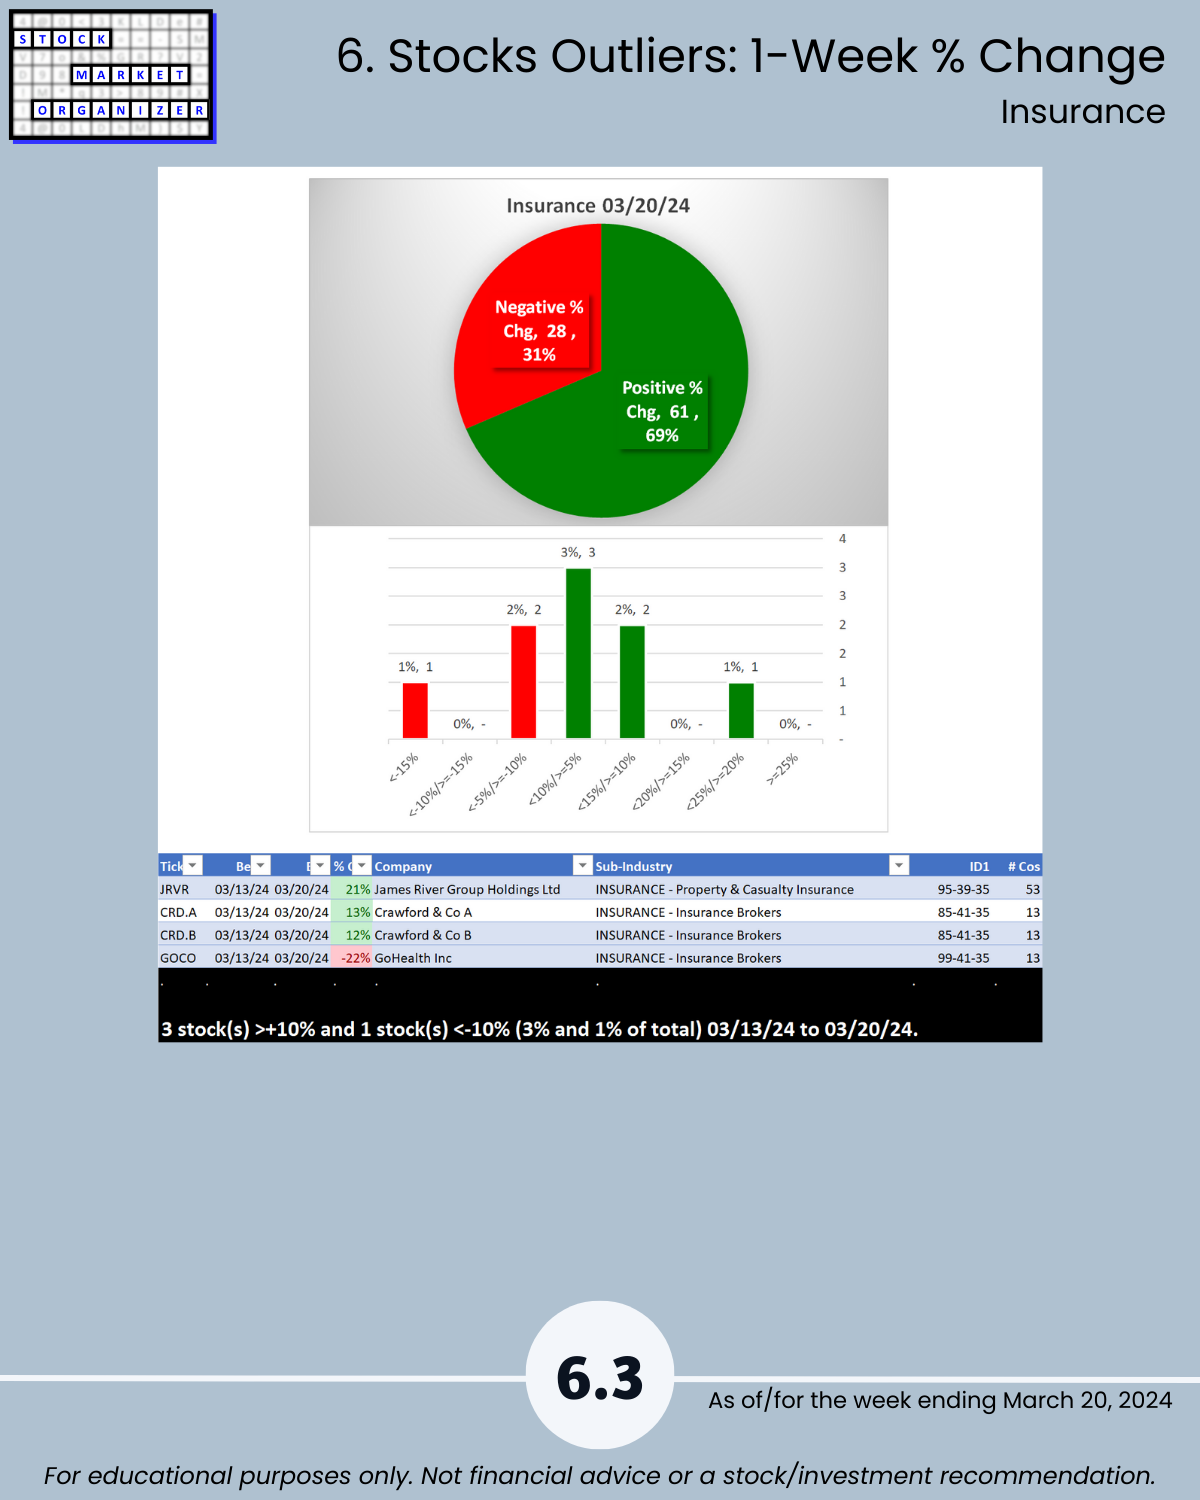
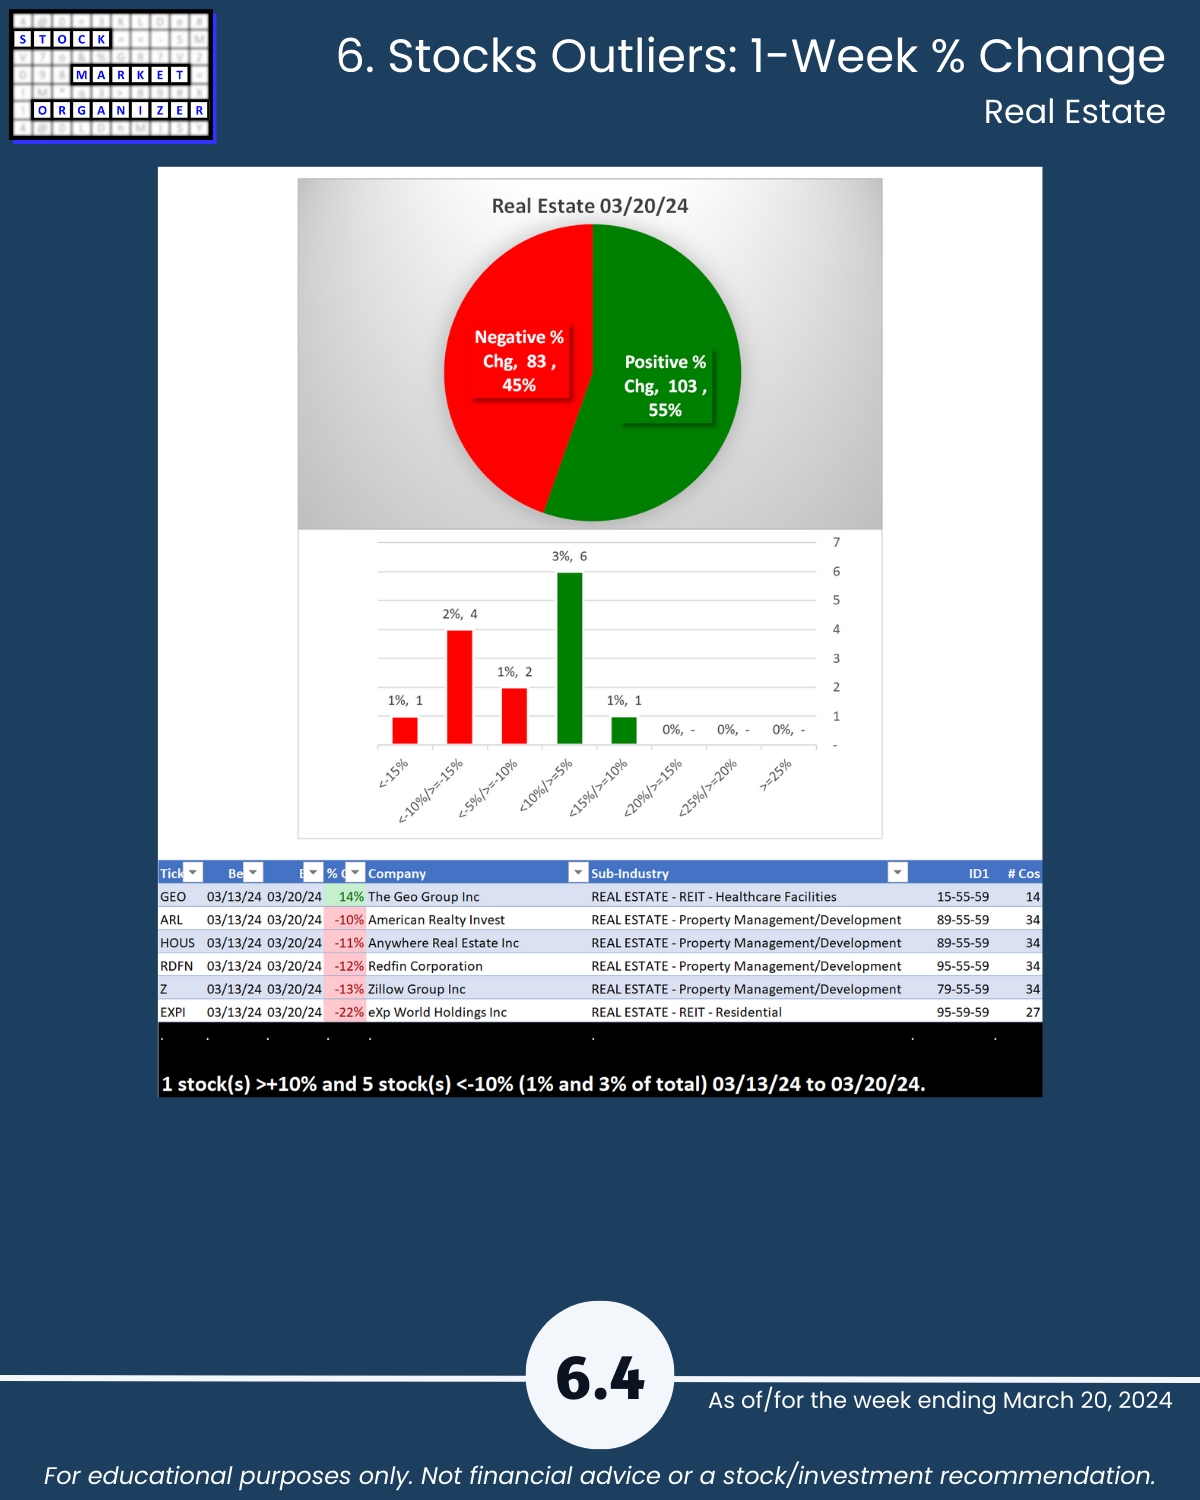
🔹 Outliers: Banking, Insurance 69% positive stocks, Financial Services 64%; JRVR +21%, GOCO -22%; EXPI -22%
🔹 @ 5-Year Highs/Lows: Insurance 25%, Financial Services 13% at 5+ year highs
DEEP DOWN YOU PROBABLY KNOW
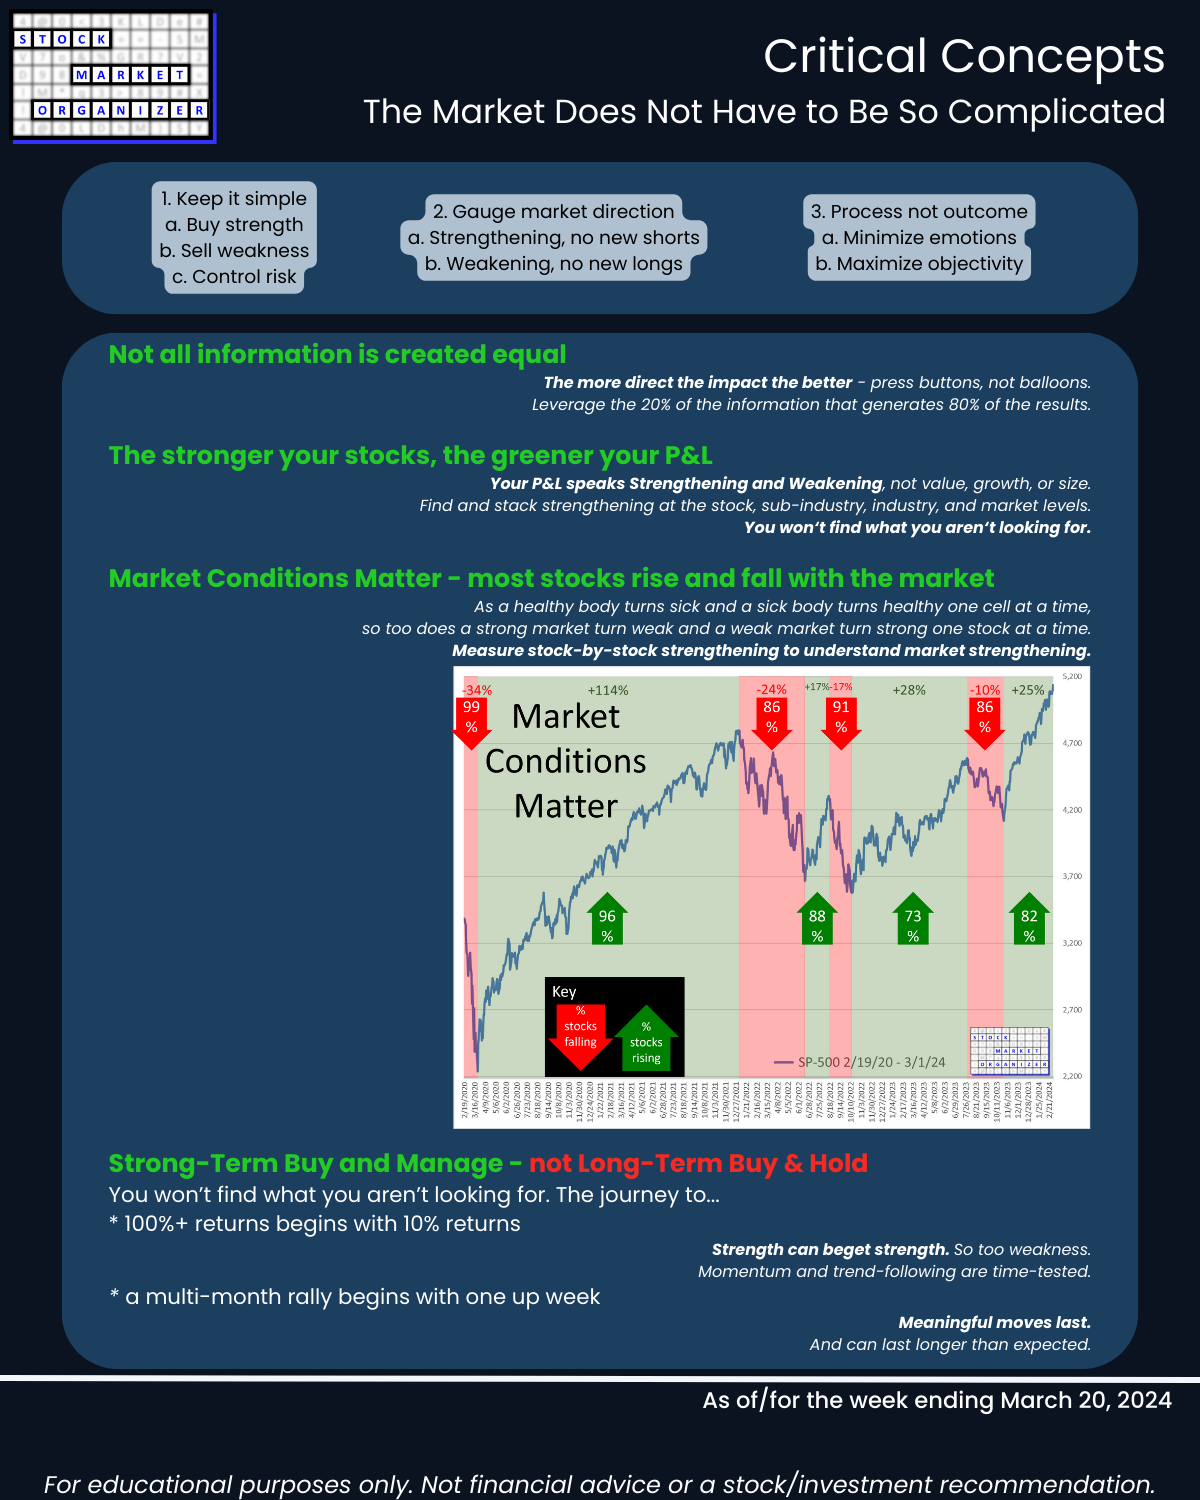
The market doesn’t have to be so complicated. But what you track matters.
I look for strength in every corner and every level of the U.S. stock market because the stronger your stocks the greener your P&L.
🔹 Individual stock strength is great.
🔹 It’s even better when stacked with sub-industry, industry, and market strength.
This report may particularly be of interest if the following 5 concepts resonate with you:
- The stronger your stocks, the greener your P&L.
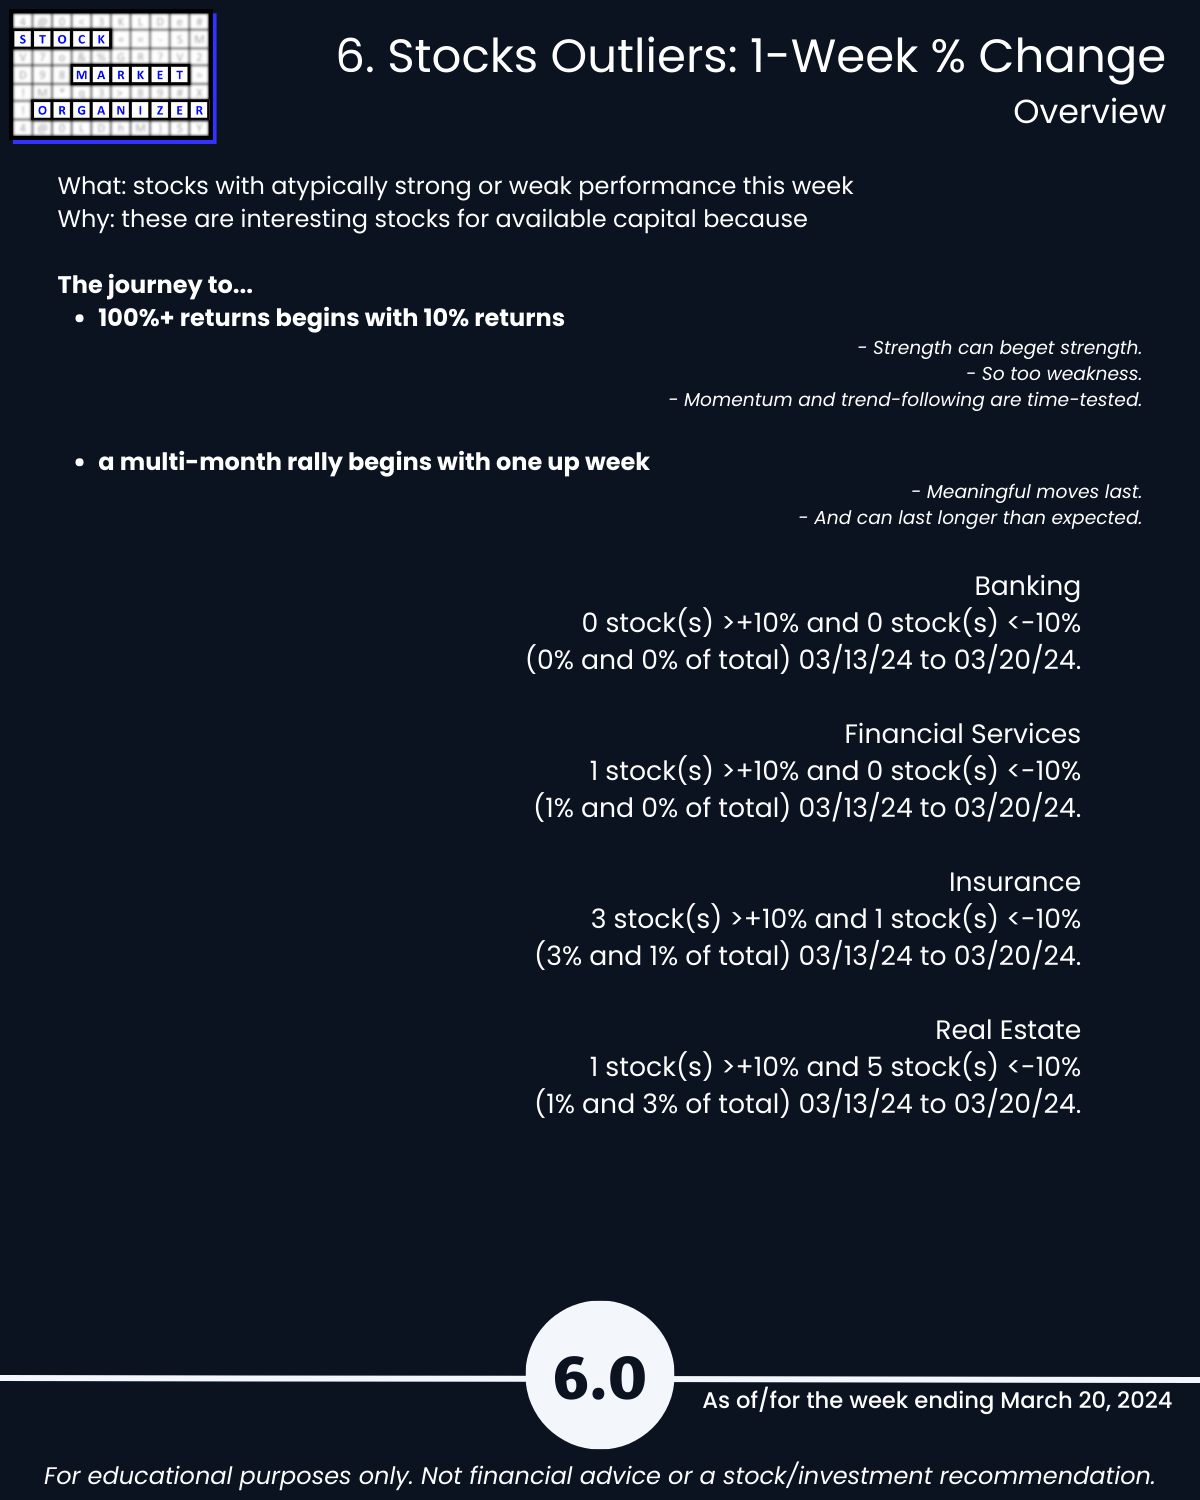
- The journey to 100%+ returns begins with 10% returns.
- The journey to a multi-month rally begins with one up week.
- Most stocks do what the market does. (While the market can only do what its underlying stocks, sub-industries, and industries do.)
- 80/20: not all information is created equal. (Press buttons, not balloons.)
Following are galleries with page-by-page views of this report.
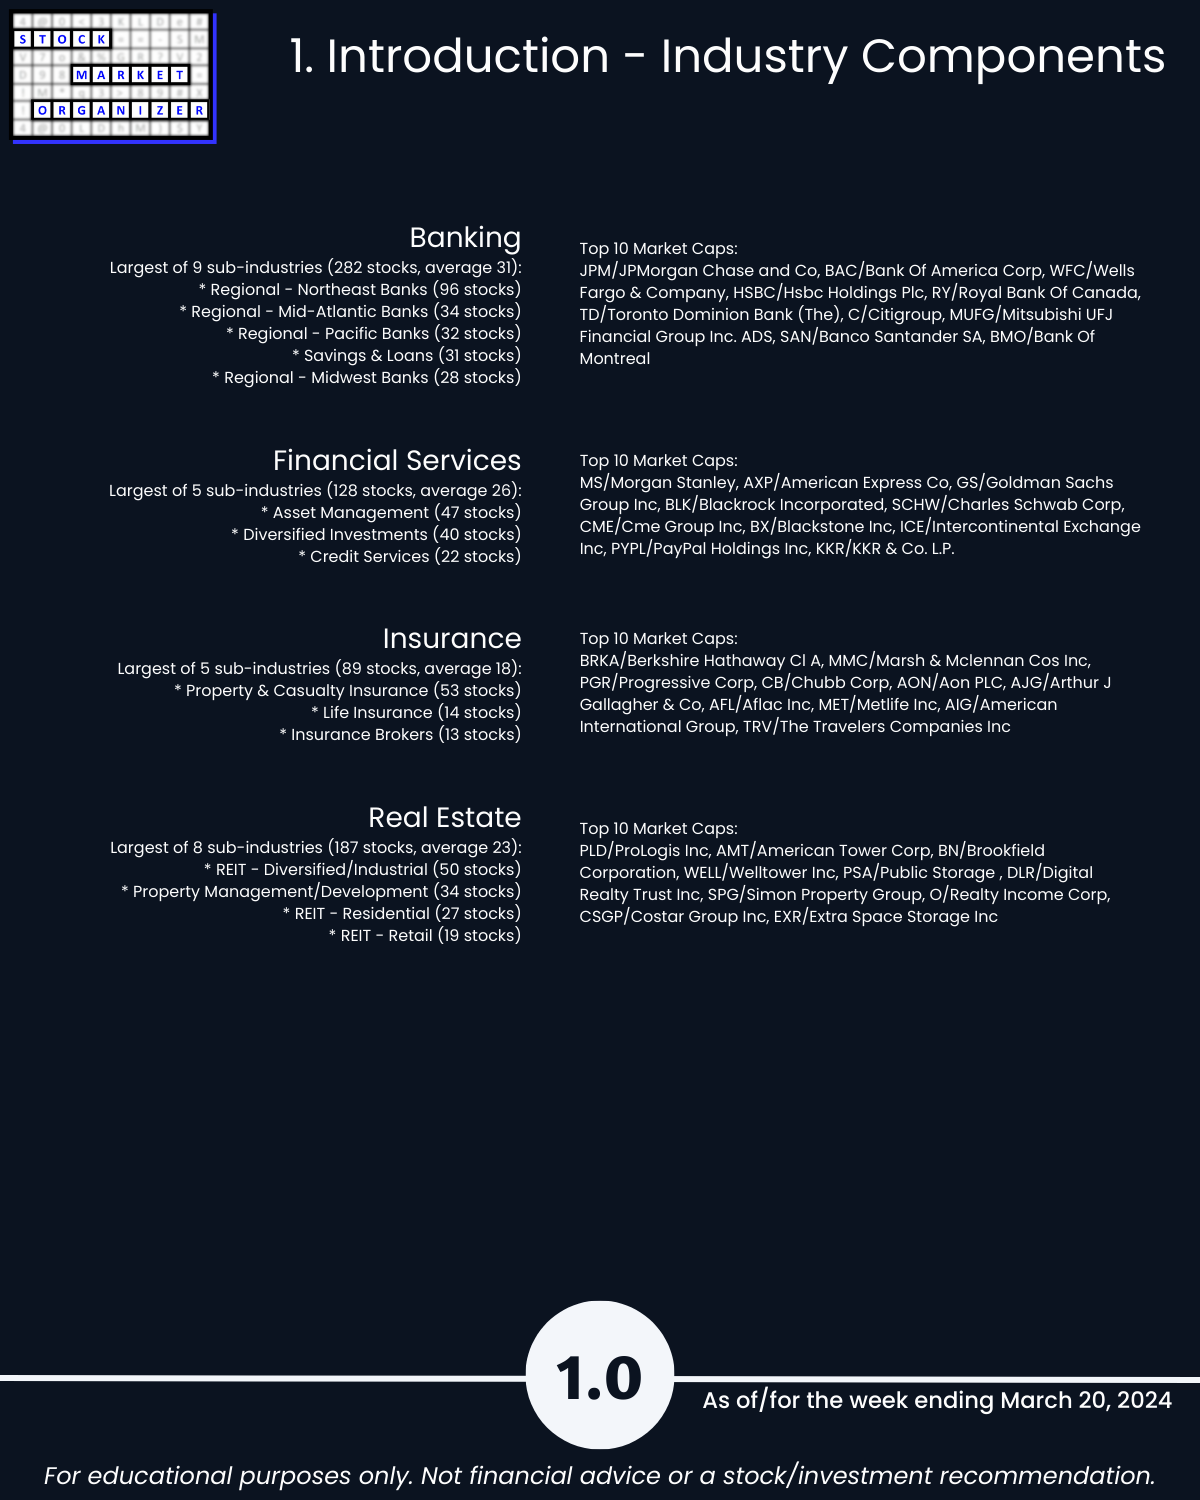
1. Introduction - Industry Components
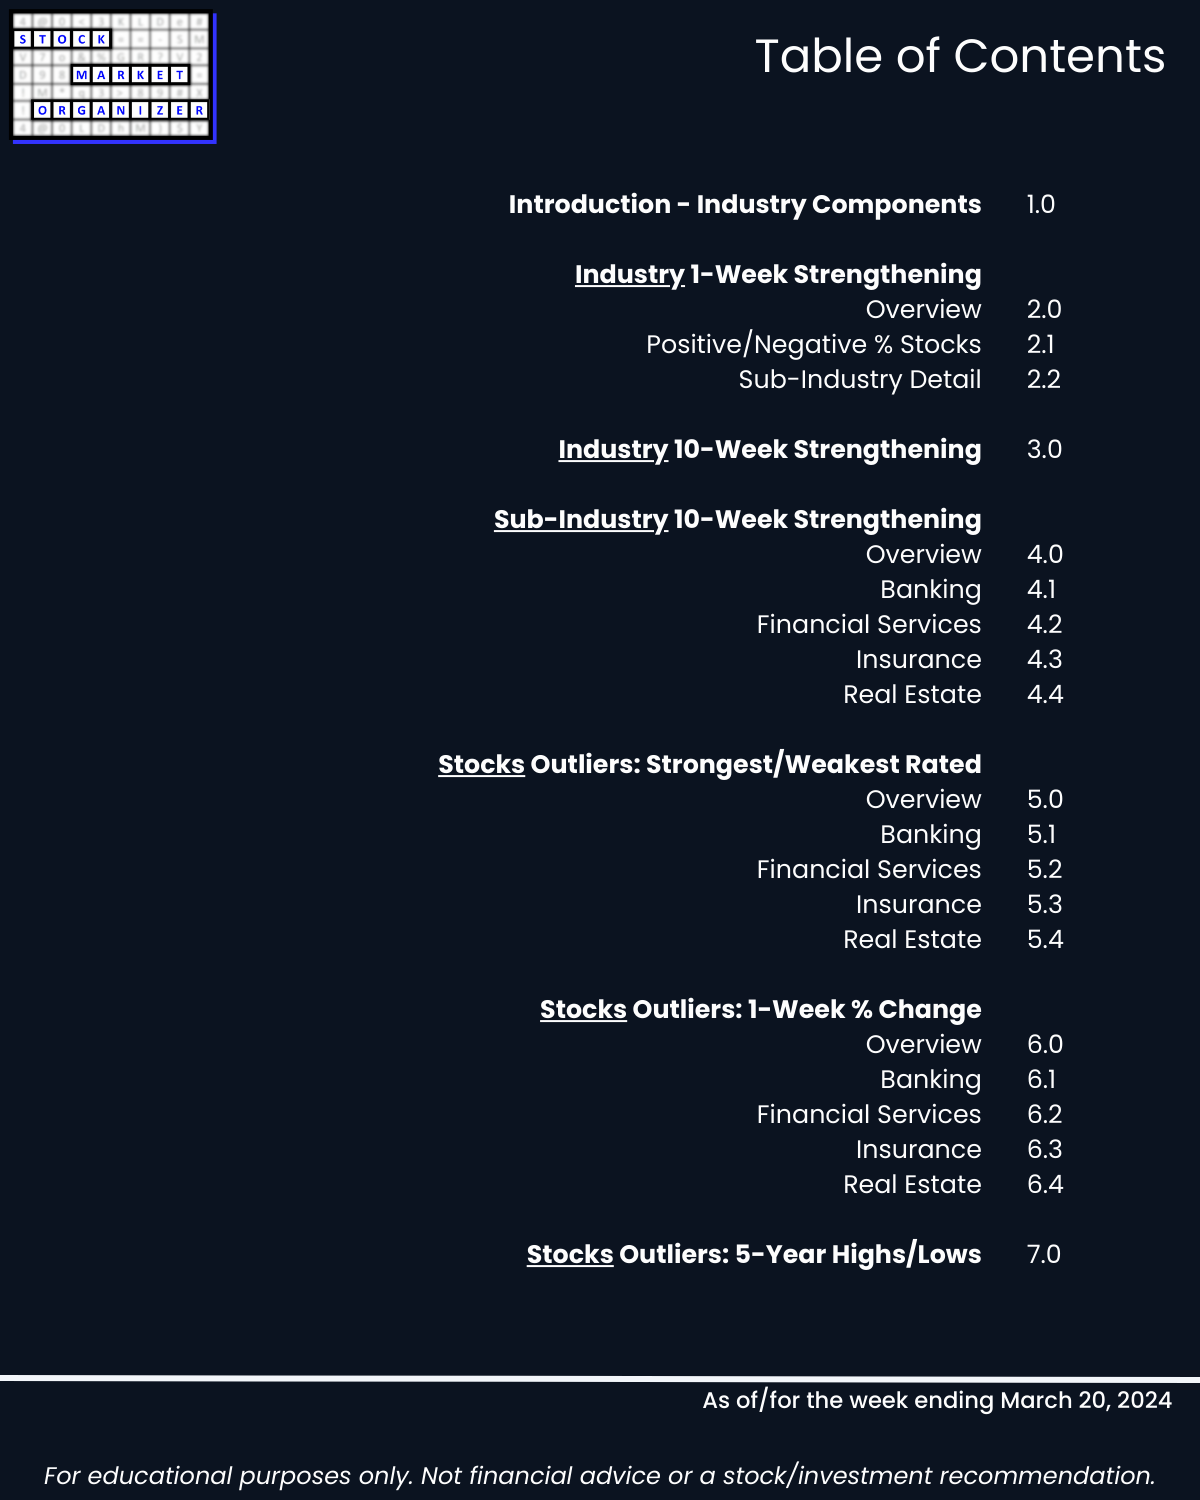
2. Industry 1-Week Strengthening
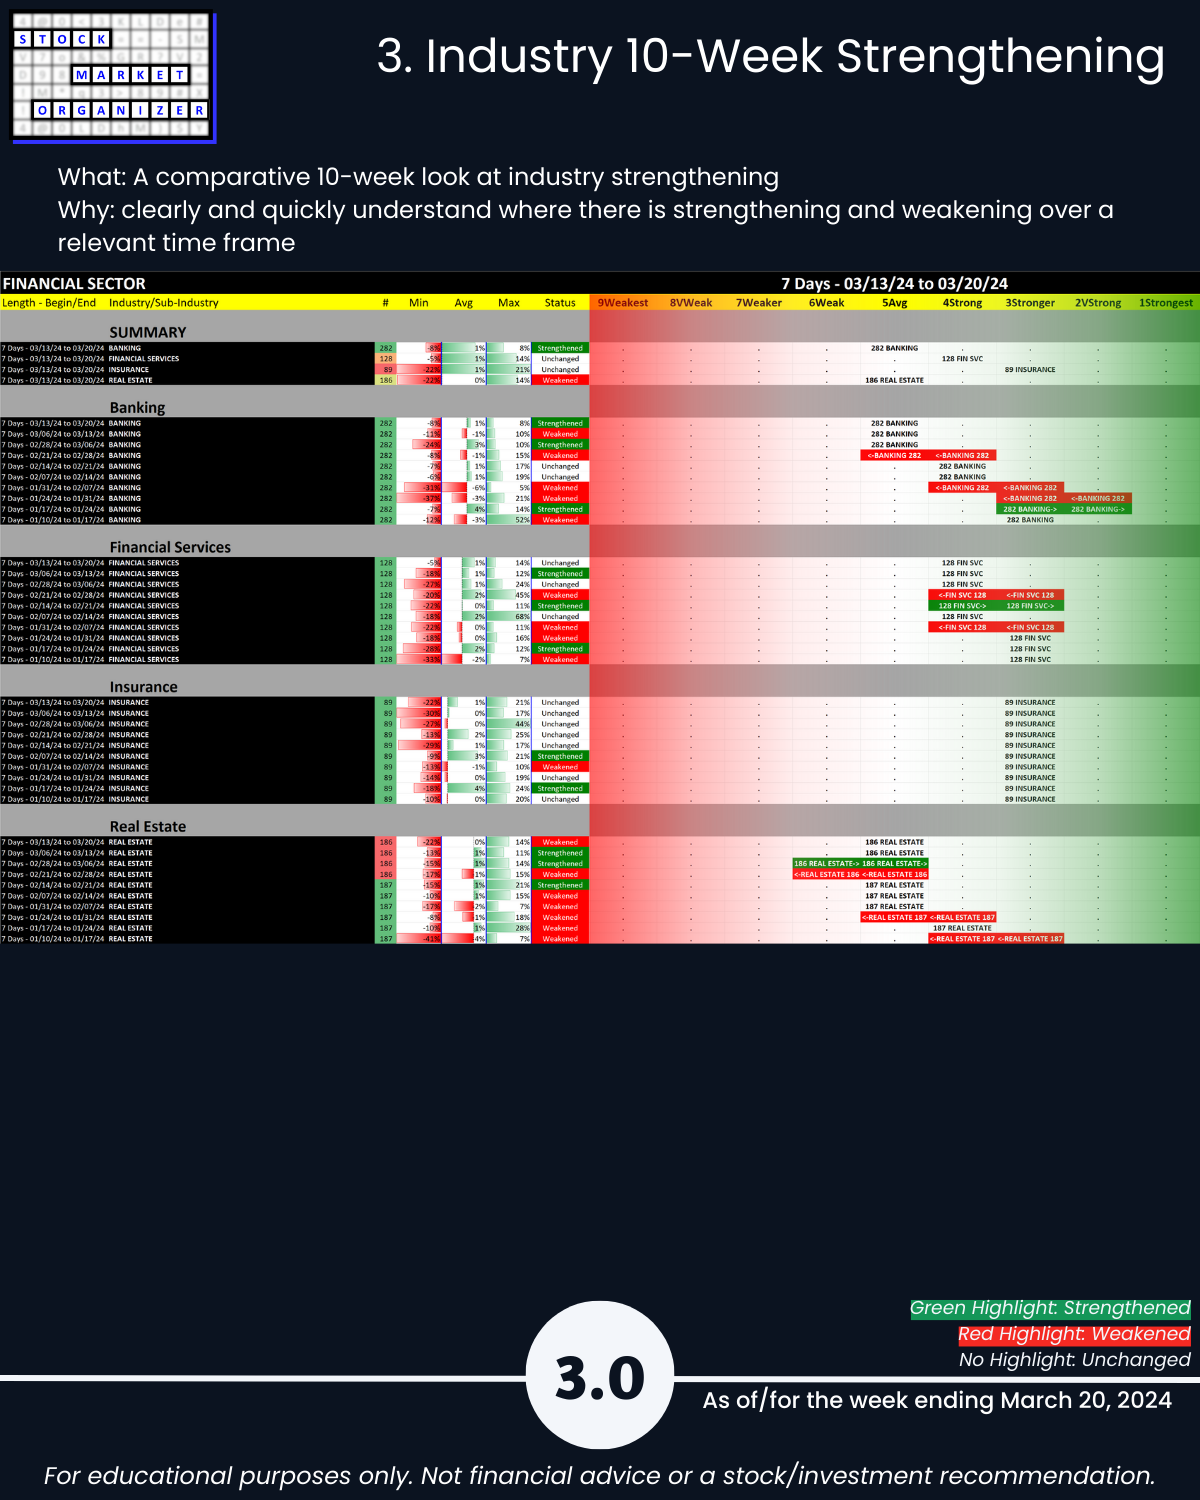
3. Industry 10-Week Strengthening
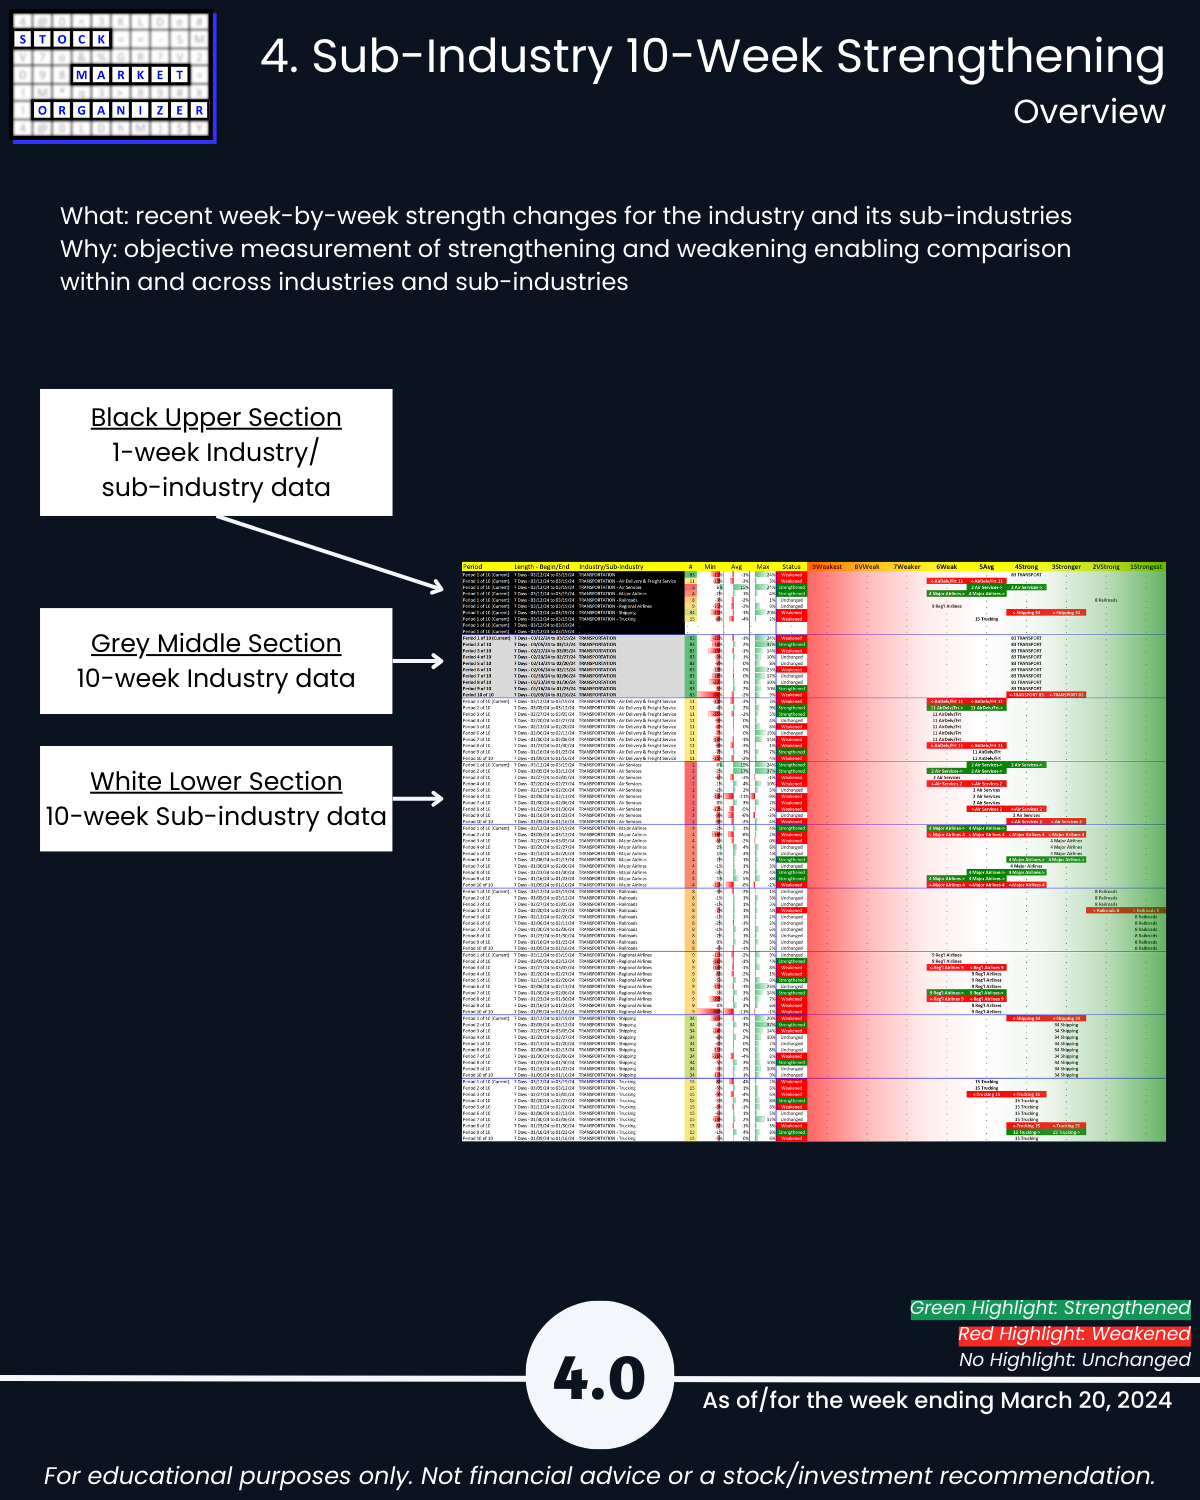
4. Sub-Industry 10-Week Strengthening
5. Stocks Outliers: Strongest/Weakest Rated
6. Stocks Outliers: 1-Week % Change
7. Stocks Outliers: 5-Year Highs/Lows