SMO Exclusive: SPDR Sector ETFs Strength Report Tuesday 2024-11-26 Strengthened +0.3 to 3.7 Strength Score
Background
This analysis consists of the Stock Market Organizer stock-by-stock strength analysis applied to the 500 stocks that comprise the 11 SPDR Select ETFs.
These results are combined with overall market environment readings (via the Market Strength Score and the Sector Risk Gauge) to discern appropriate portfolio exposure given prevailing market and sector conditions.
Strengthening Status: Most Important Ranking
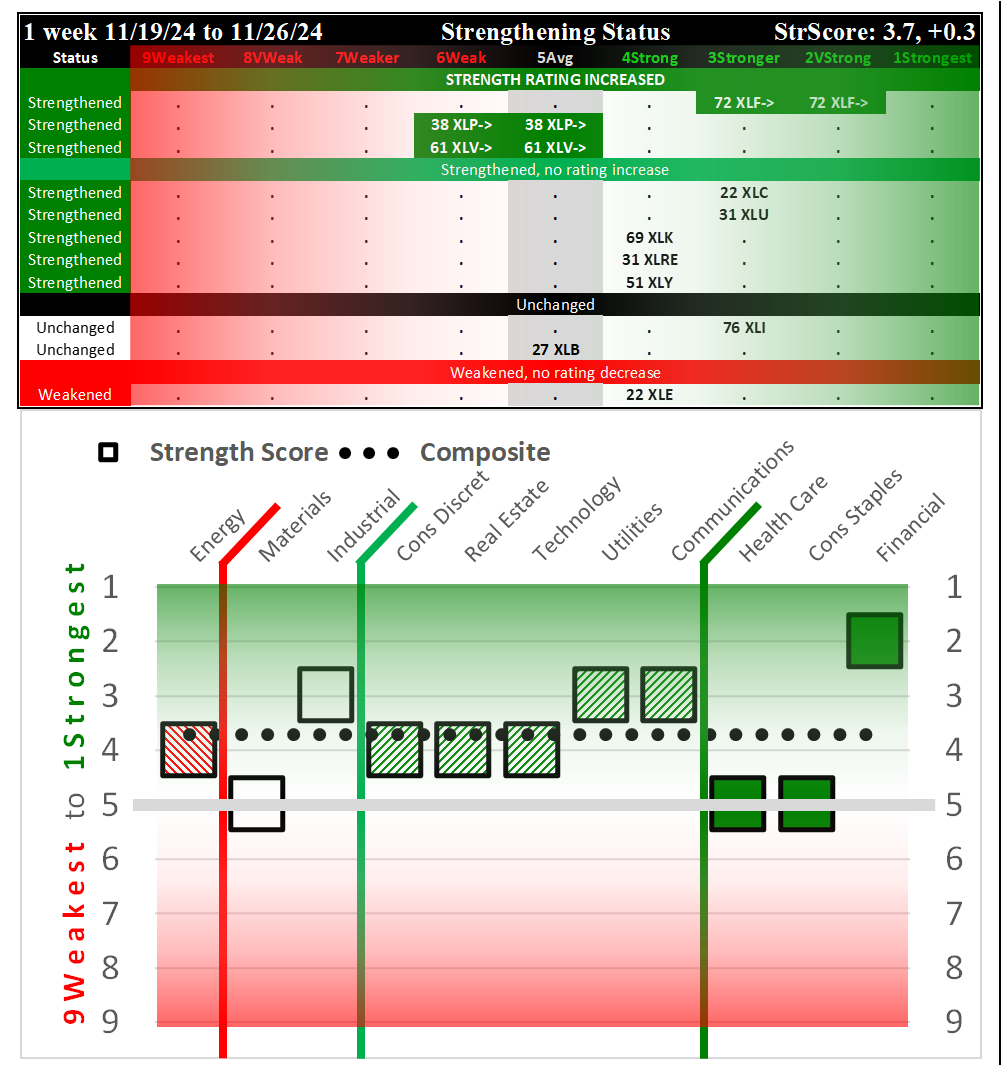
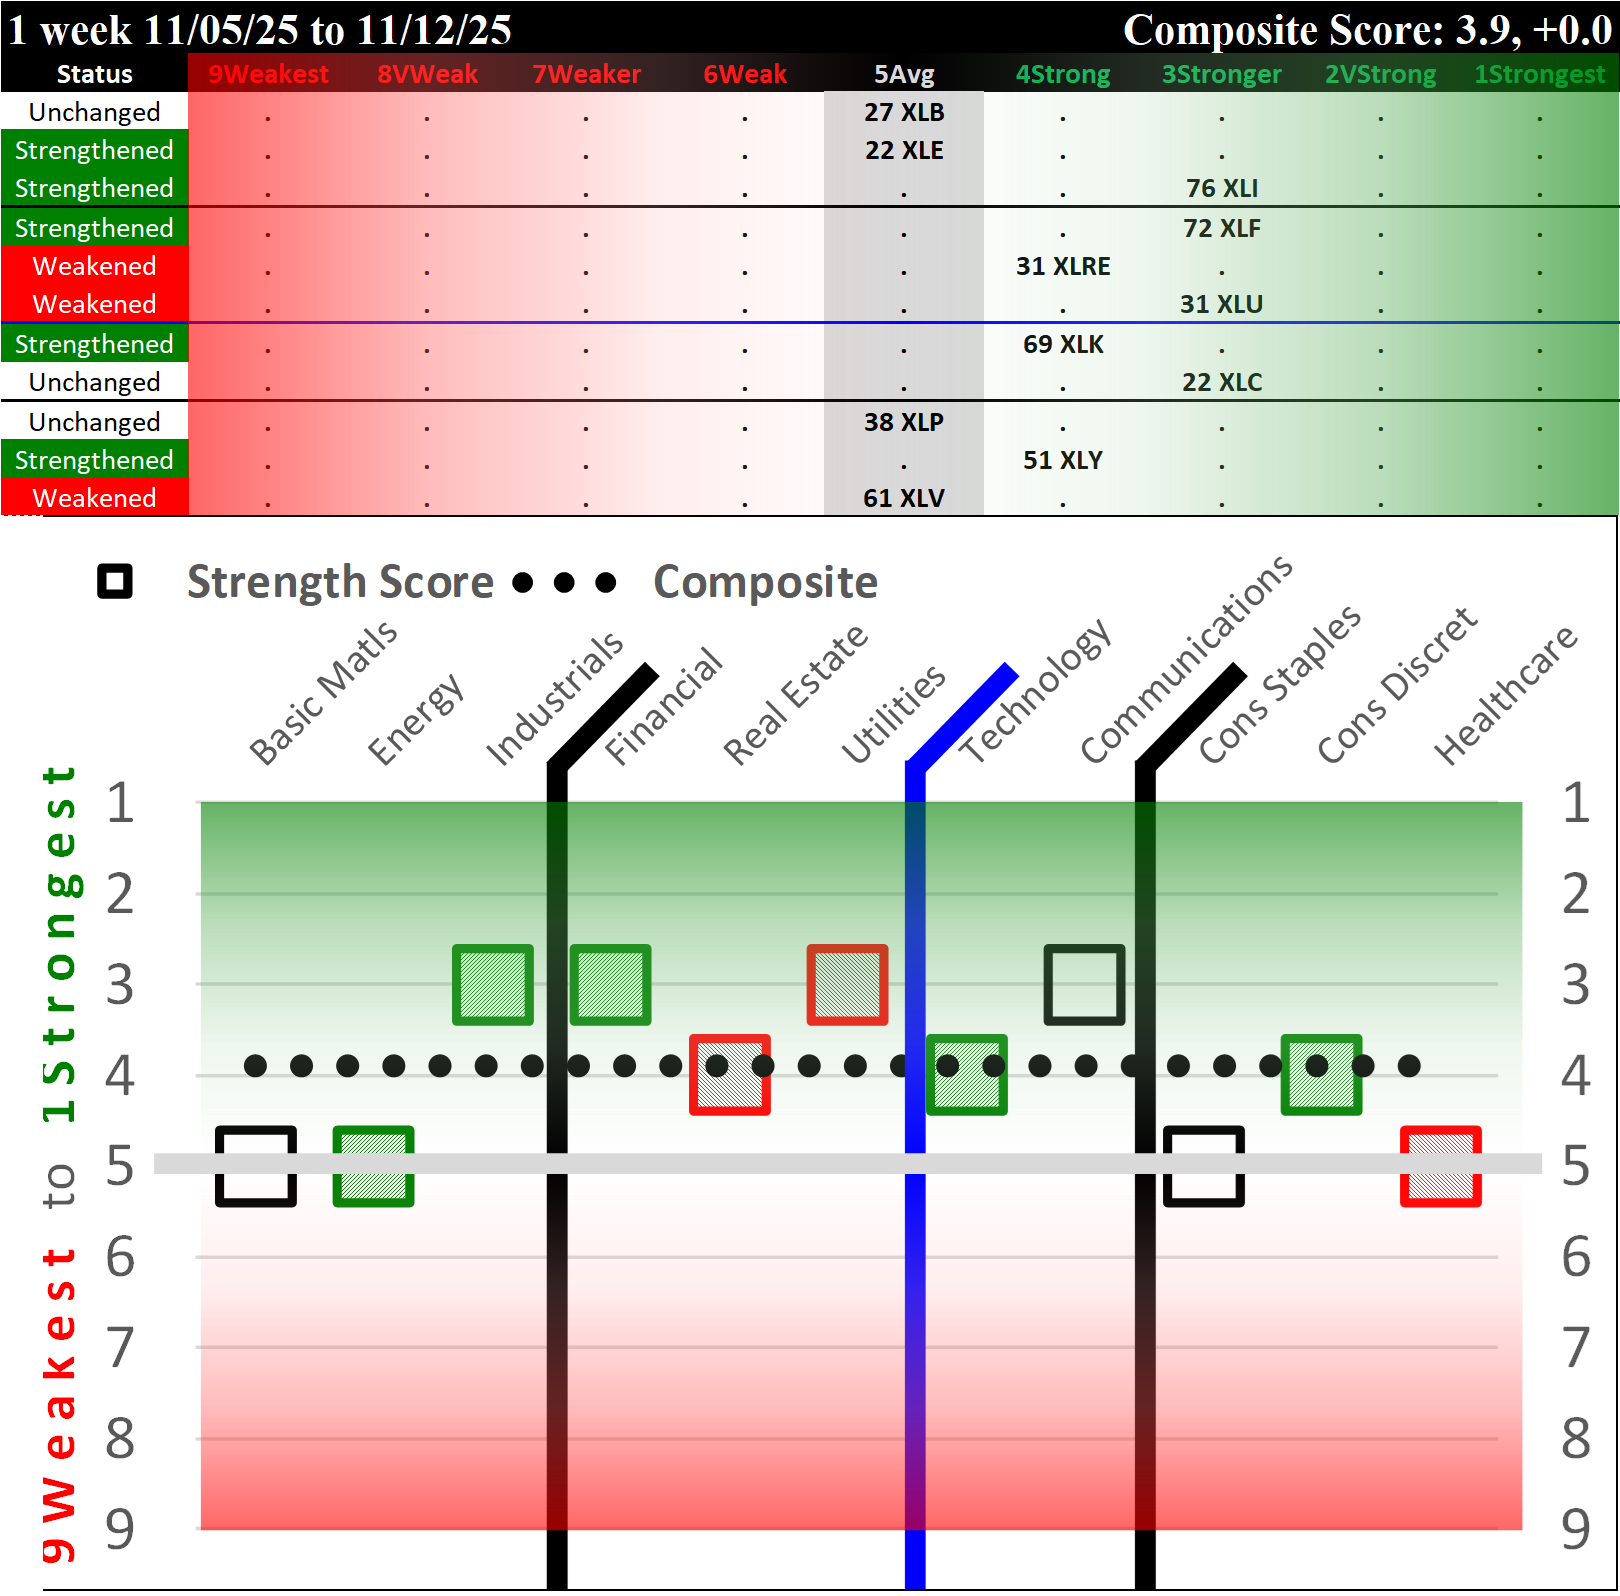
The following spectrum graph shows the ETFs based on their strengthening status.
It is ordered based on whether or not and to where an ETF strengthened or weakened rating. These distinctions are important - that 1) a sector strengthened or weakened rating, and 2) from/to where this strengthening happened are key features to note.
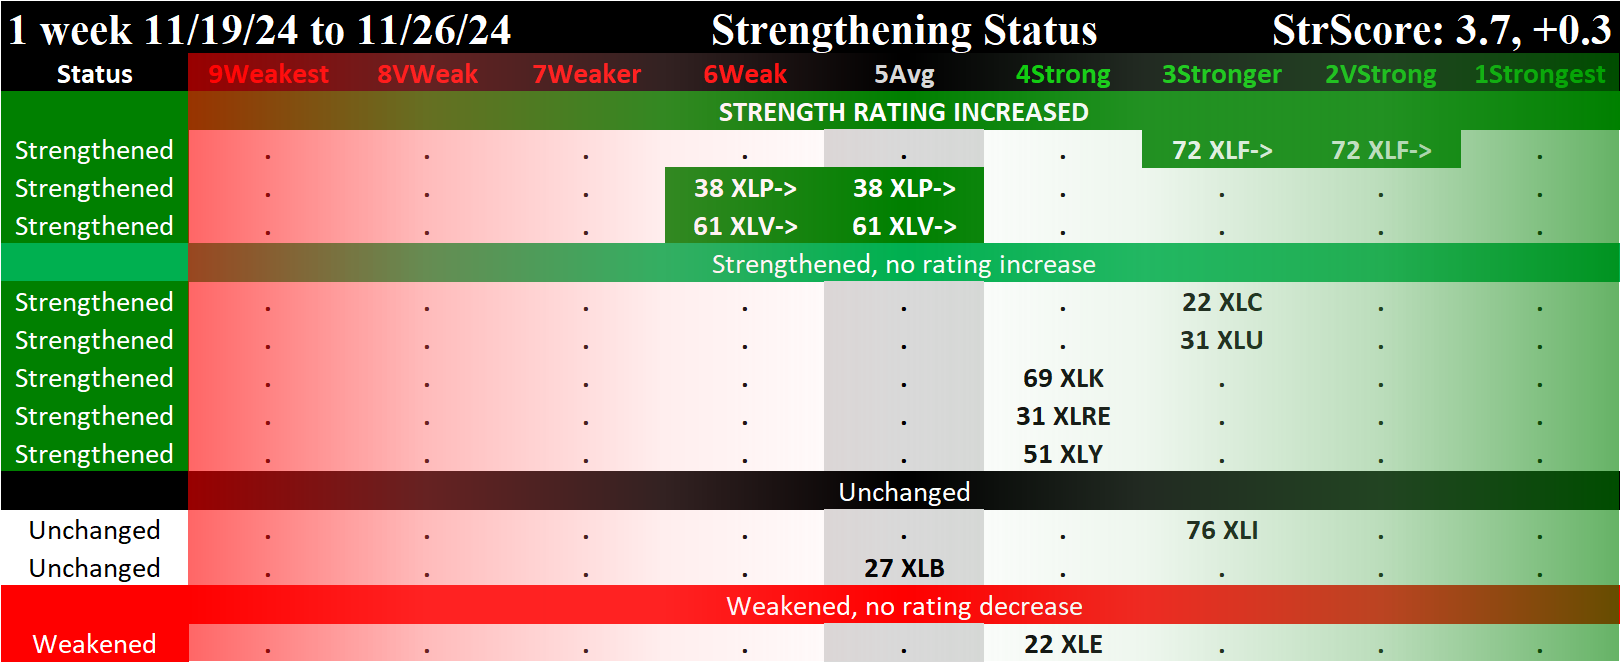
The top section shows the three ETFs that strengthened this week. Note XLF/Financial strengthened from an already-strong rating, while the other two XLP/Consumer Staples and XLV/Health Care strengthened from comparatively much weaker ratings. The key factor is each strengthened enough to change ratings - a material change that has great influence in this system. It is impossible to determine how long this will last. These could reverse at any time. However, the change itself is an objectively actionable signal.
Weekly Returns
Average Returns - Strong Positive Week
The average returns for the underlying stocks in each ETF are shown below. All were positive, ranging between +0.7% to +4.6%, with the best and worst three highlighted below:
Best:
- XLY/Consumer Discretionary, +4.6% average for 55 stocks
- XLK/Technology, +4.1% average for 69 stocks
- XLI/Industrial, +3.7% for 76 stocks
Worst:
- XLE/Energy, +0.7% average for 22 stocks
- XLC/Communications, +2.4% average for 22 stocks
- XLV/Consumer Staples, +2.6% average for 38 stocks
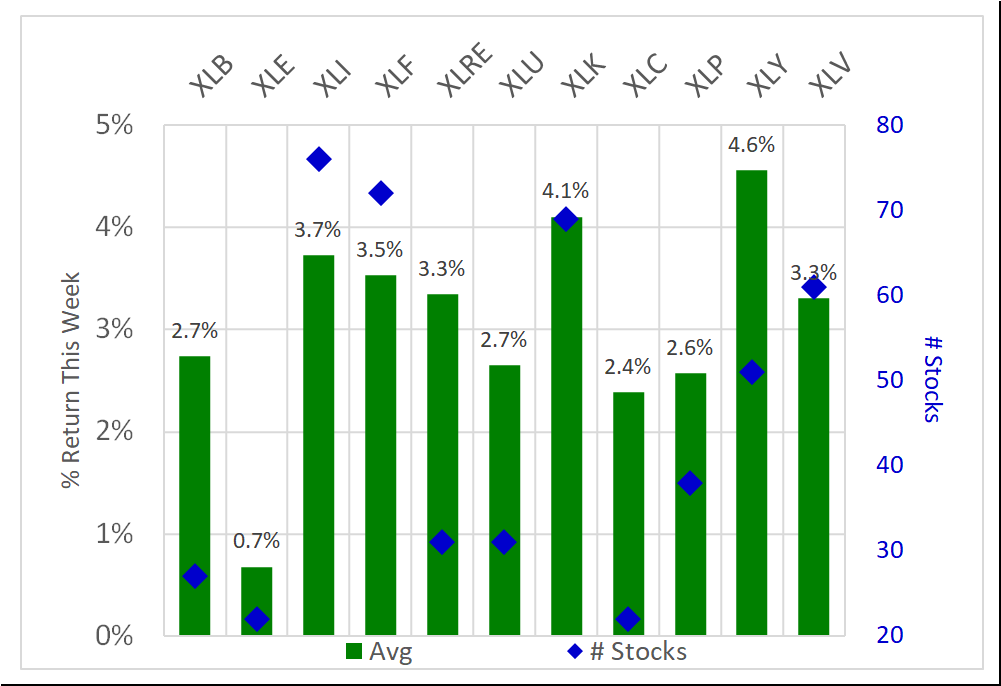
A strong week for all ETFs with all positive returns.
High and Low Returns
The following graphic overlays the lowest and highest returns in each sector.
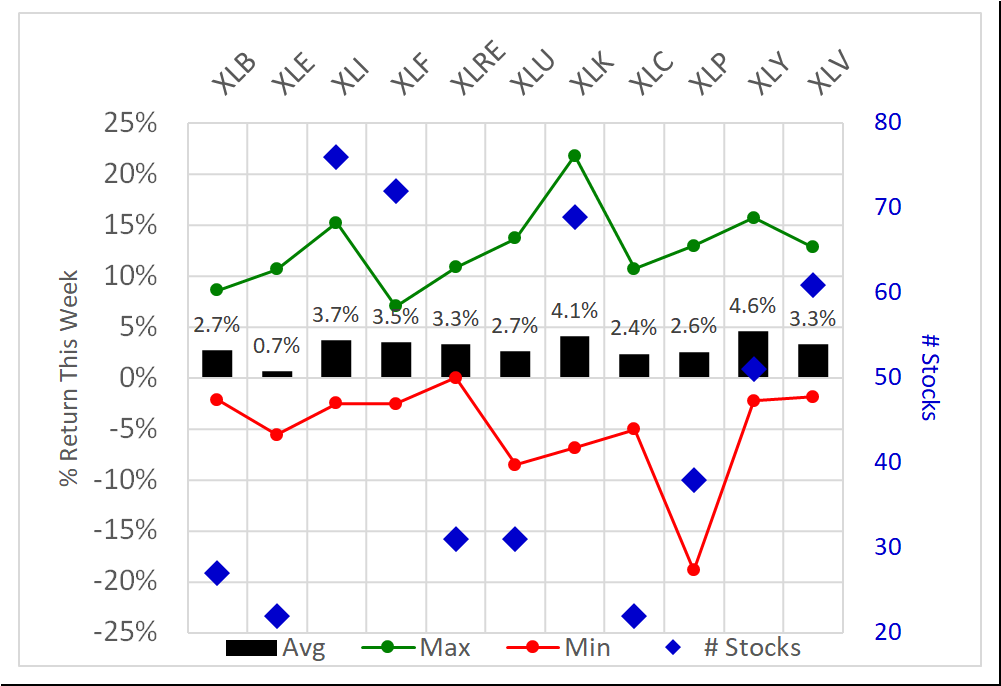
The XLK/Technology outlier to the upside was SMCI/Super Micro Computer +22% (a stock still rated 9Weakest which has been under relentless pressure since reaching its all-time high earlier this year, rallying as its potential de-listing risk seems to be resolved). The XLP/Consumer Staples outlier to the downside was TGT/Target Corporation (due to earnings), -19% and now rated 9Weakest, down from 2VeryStrong last week.
Context: Comparison to Previous Weeks
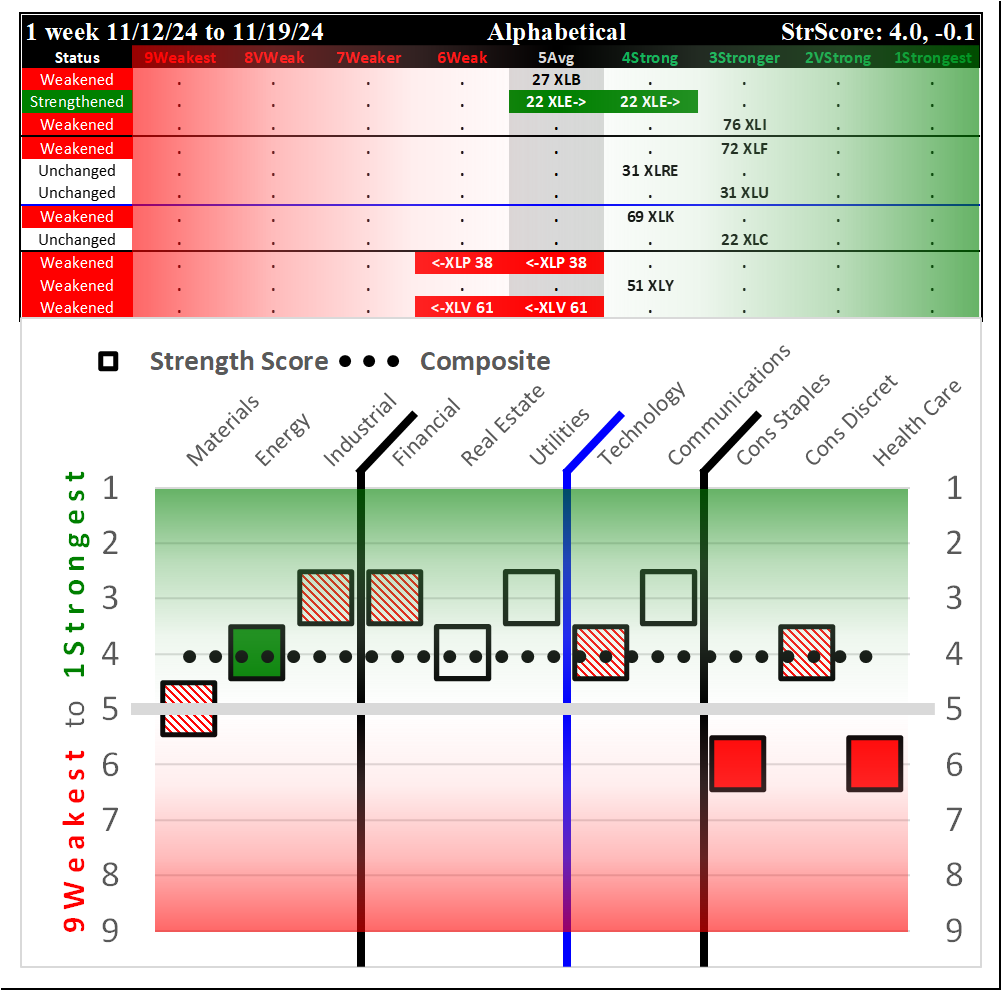
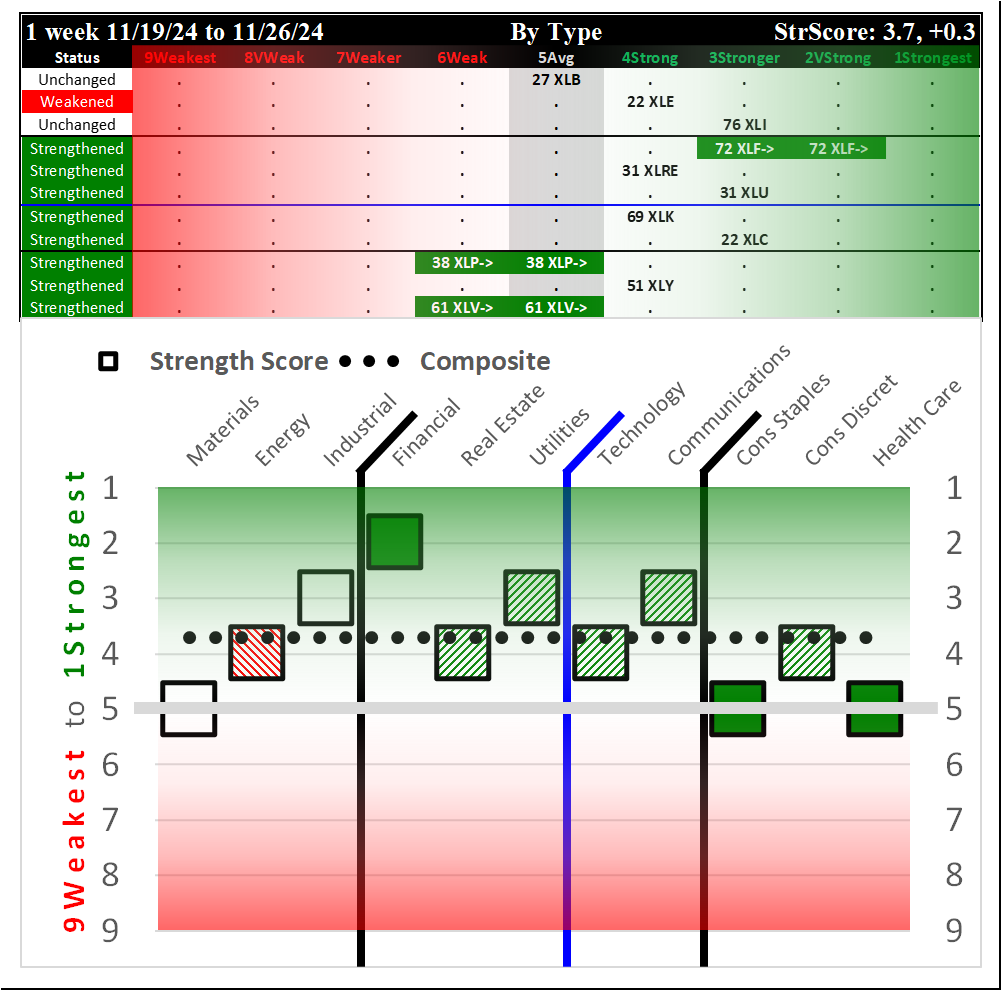
The following graphics show recent week-to-week changes ending on Tuesdays:
- 11/12/24: Mixed
- 11/19/24: Flat/Weakening
- 11/26/24: Strengthening
STRENGTHENING for the just-completed week ending Tuesday, 2024-11-26.
Current Status: 3.7 Composite Score, +0.3 this week
The following spectrum graph Strongest to Weakest shows the composition of the ETF ratings that comprise the current 3.7 composite score, in order of Strength Rating. This is followed by a spectrum graph with the ETFs listed alphabetically.
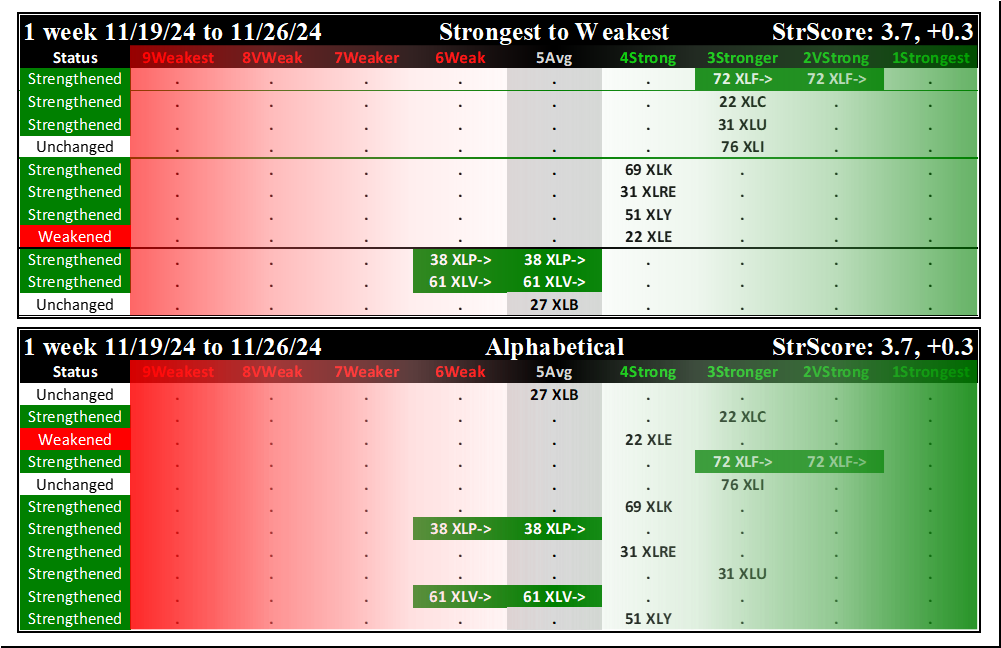
The upper spectrum graph shows the ETFs in decreasing order of Strength Rating and strengthening for the week while the lower spectrum graph is alphabetical. In the upper graphic, sectors with the same rating are listed in order of as follows: first, sectors that strengthened rating during the week; second, sectors with ratings that did not change during the week but did strengthen; third, sectors with ratings that did not change during the week but did weaken; and fourth, sectors which weakened rating during the week. The color-coded lines delineate different ratings - 4Strong or stronger are separated by green lines, 6Weak or weaker are separated by red lines, and 5Average is separated by black lines.
The ETFs are listed below based on their strength rating.
1Strongest
None
2VeryStrong
- XLF/Financial (Strengthened rating)
3Stronger
- XLC/Communications (Strengthened)
- XLU/Utilities (Strengthened)
- XLI/Industrials (Unchanged)
3.7 - Composite Score
4Strong
- XLK/Technology (Strengthened)
- XLRE/Real Estate (Strengthened)
- XLY/Consumer Discretionary (Strengthened)
- XLE/Energy (Weakened)
5Average
- XLP/Consumer Staples (Strengthened rating)
- XLV/Healthcare (Strengthened rating)
- XLB/Basic Materials (Unchanged)
6Weak
None
7Weaker
None
8VeryWeak
None
9Weakest
None
Today's Market Context
Key Headlines
"Dow, S&P 500 end at records as investors shake off Trump’s tariff threat"
"Fed plots more ‘gradual’ approach to cutting interest rates, minutes show"
"Why is bitcoin’s $100,000 push stalling? These long-term holders can’t resist selling."
"Inflation is heading in the wrong direction. Just how bad is it?"
(Marketwatch)
"Israel-Hezbollah permanent ceasefire has been accepted, Biden says"
"Trump vows an additional 10% tariff on China, 25% tariffs on Canada and Mexico"
"Bitcoin drops to $91,000 level as crypto markets slump: CNBC Crypto World"
(CNBC)
Key Current Readings
SP500: 6,022
Nasdaq: 19,174
Nasdaq 100: 20,923
Russell 2000: 2,424
10Y Treasury: 4.295%
2YT: 4.248%
Oil (WTI Crude): $68.77
Bitcoin: $91,831
Dollar Index: 106.89
Gold: $2,621
VIX: 14.1
(CNBC)
Sector ETF Analysis Contents
The following Stock Market Organizer strengthening/weakening analysis looks at the 11 SPDR ETFs and their underlying component stocks for the week ending Tuesday 2024-11-26, as follows:
- ETFs Summary
1.1 Current Overview
1.2 Historical Summaries - ETFs Detail
2.1 XLB Materials
2.2 XLC Communications
2.3 XLE Energy
2.4 XLF Financials
2.5 XLI Industrials
2.6 XLK Technology
2.7 XLP Consumer Staples
2.8 XLRE Real Estate
2.9 XLU Utilities
2.10 XLV Health Care
2.11 XLY Consumer Discretionary - Stock Detail (downloads)
1. ETFs Summary
1.1 Current Overview
The following graphs reflect the composition of each of the ETFs based on their underlying stock strength ratings which range from 1Strongest to 9Weakest. Since I only care about the strongest and weakest in each sector, stocks rated from 2VeryStrong through 8VeryWeak are categorized as "Ignore."
- Top row: XLB/Basic Materials, XLE/Energy, and XLI/Industrials
- Second row: interest rate-sensitive ETFs XLF/Financials, XLRE/Real Estate, and XLU/Utilities
- Third row: XLK/Technology and XLC/Communications
- Bottom row: XLP/Consumer Staples, XLY/Consumer Discretionary, and XLV/Healthcare
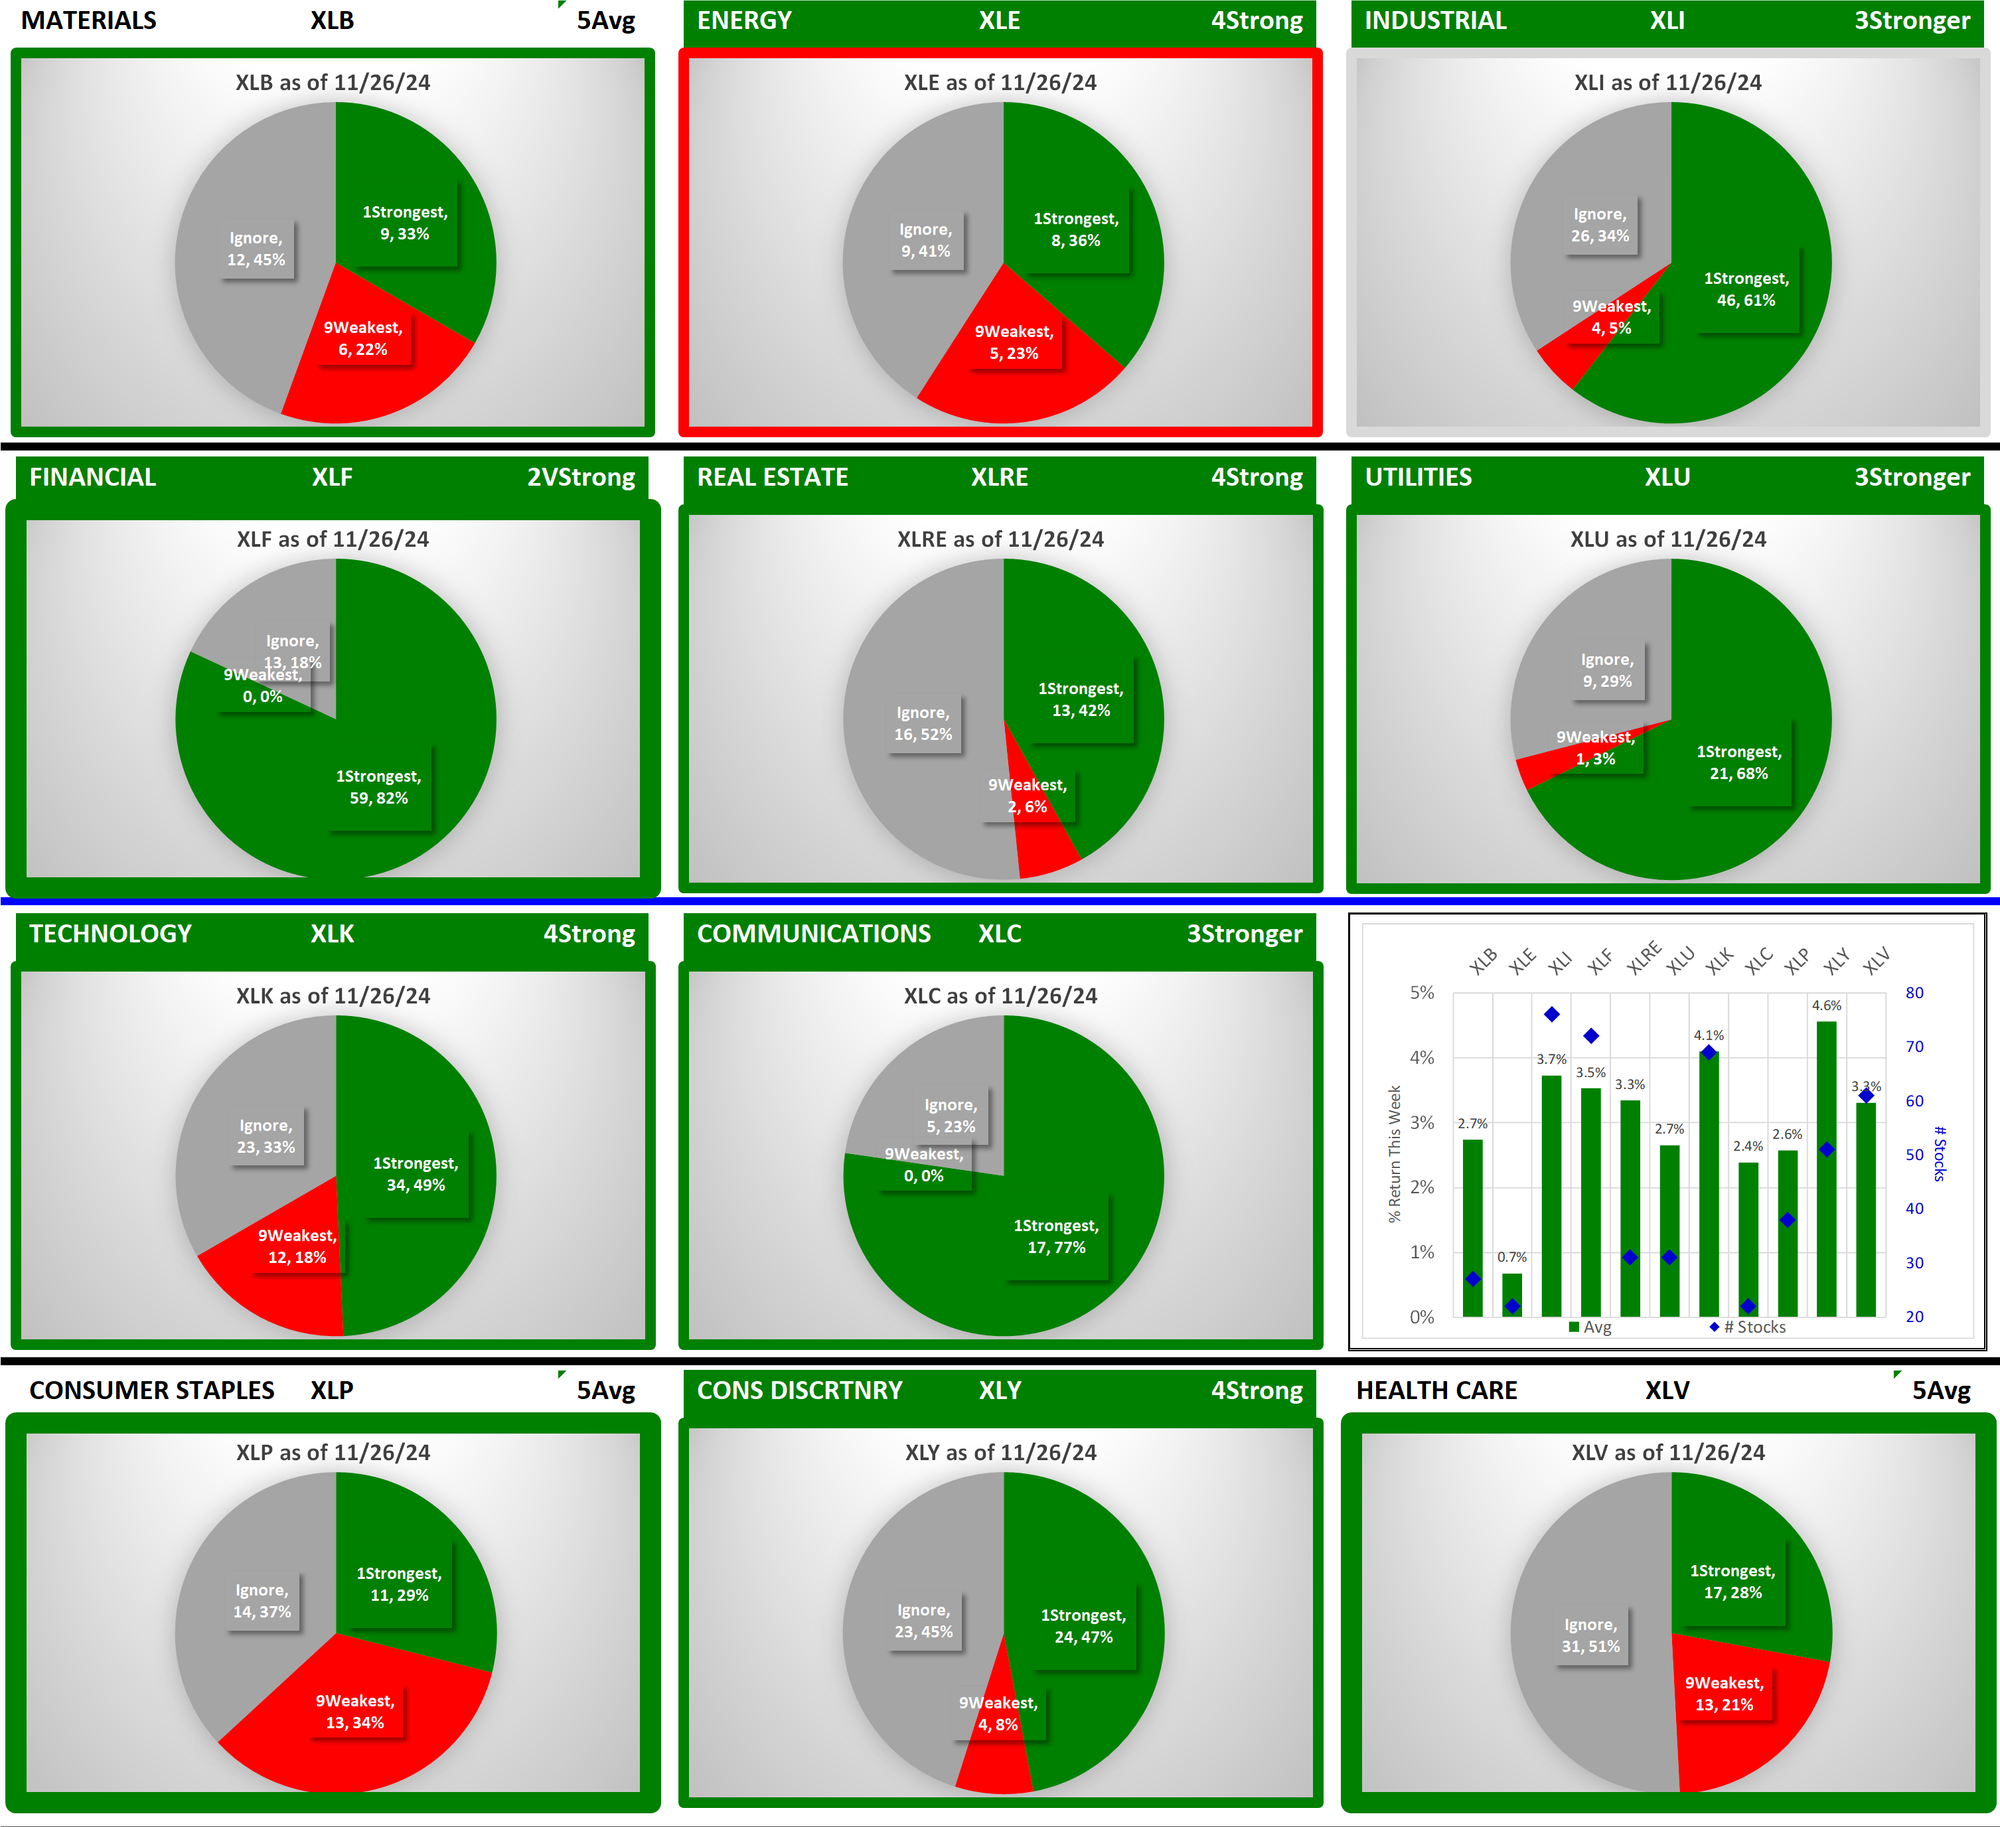
The headers for each graphic are color-coded. ETFs rated 4Strong or better have green headings - currently, 8 of 11 ETFs qualify. The weakest ETFs XLB/Materials, XLP/Consumer Staples, and XLY/Healthcare have 5Average ratings - a reflection of overall market strength. ETFs that changed rating this week have thick green or red borders. ETFs that strengthened or weakened but did not change rating have thin green or red borders.
1.2 Historical Summaries
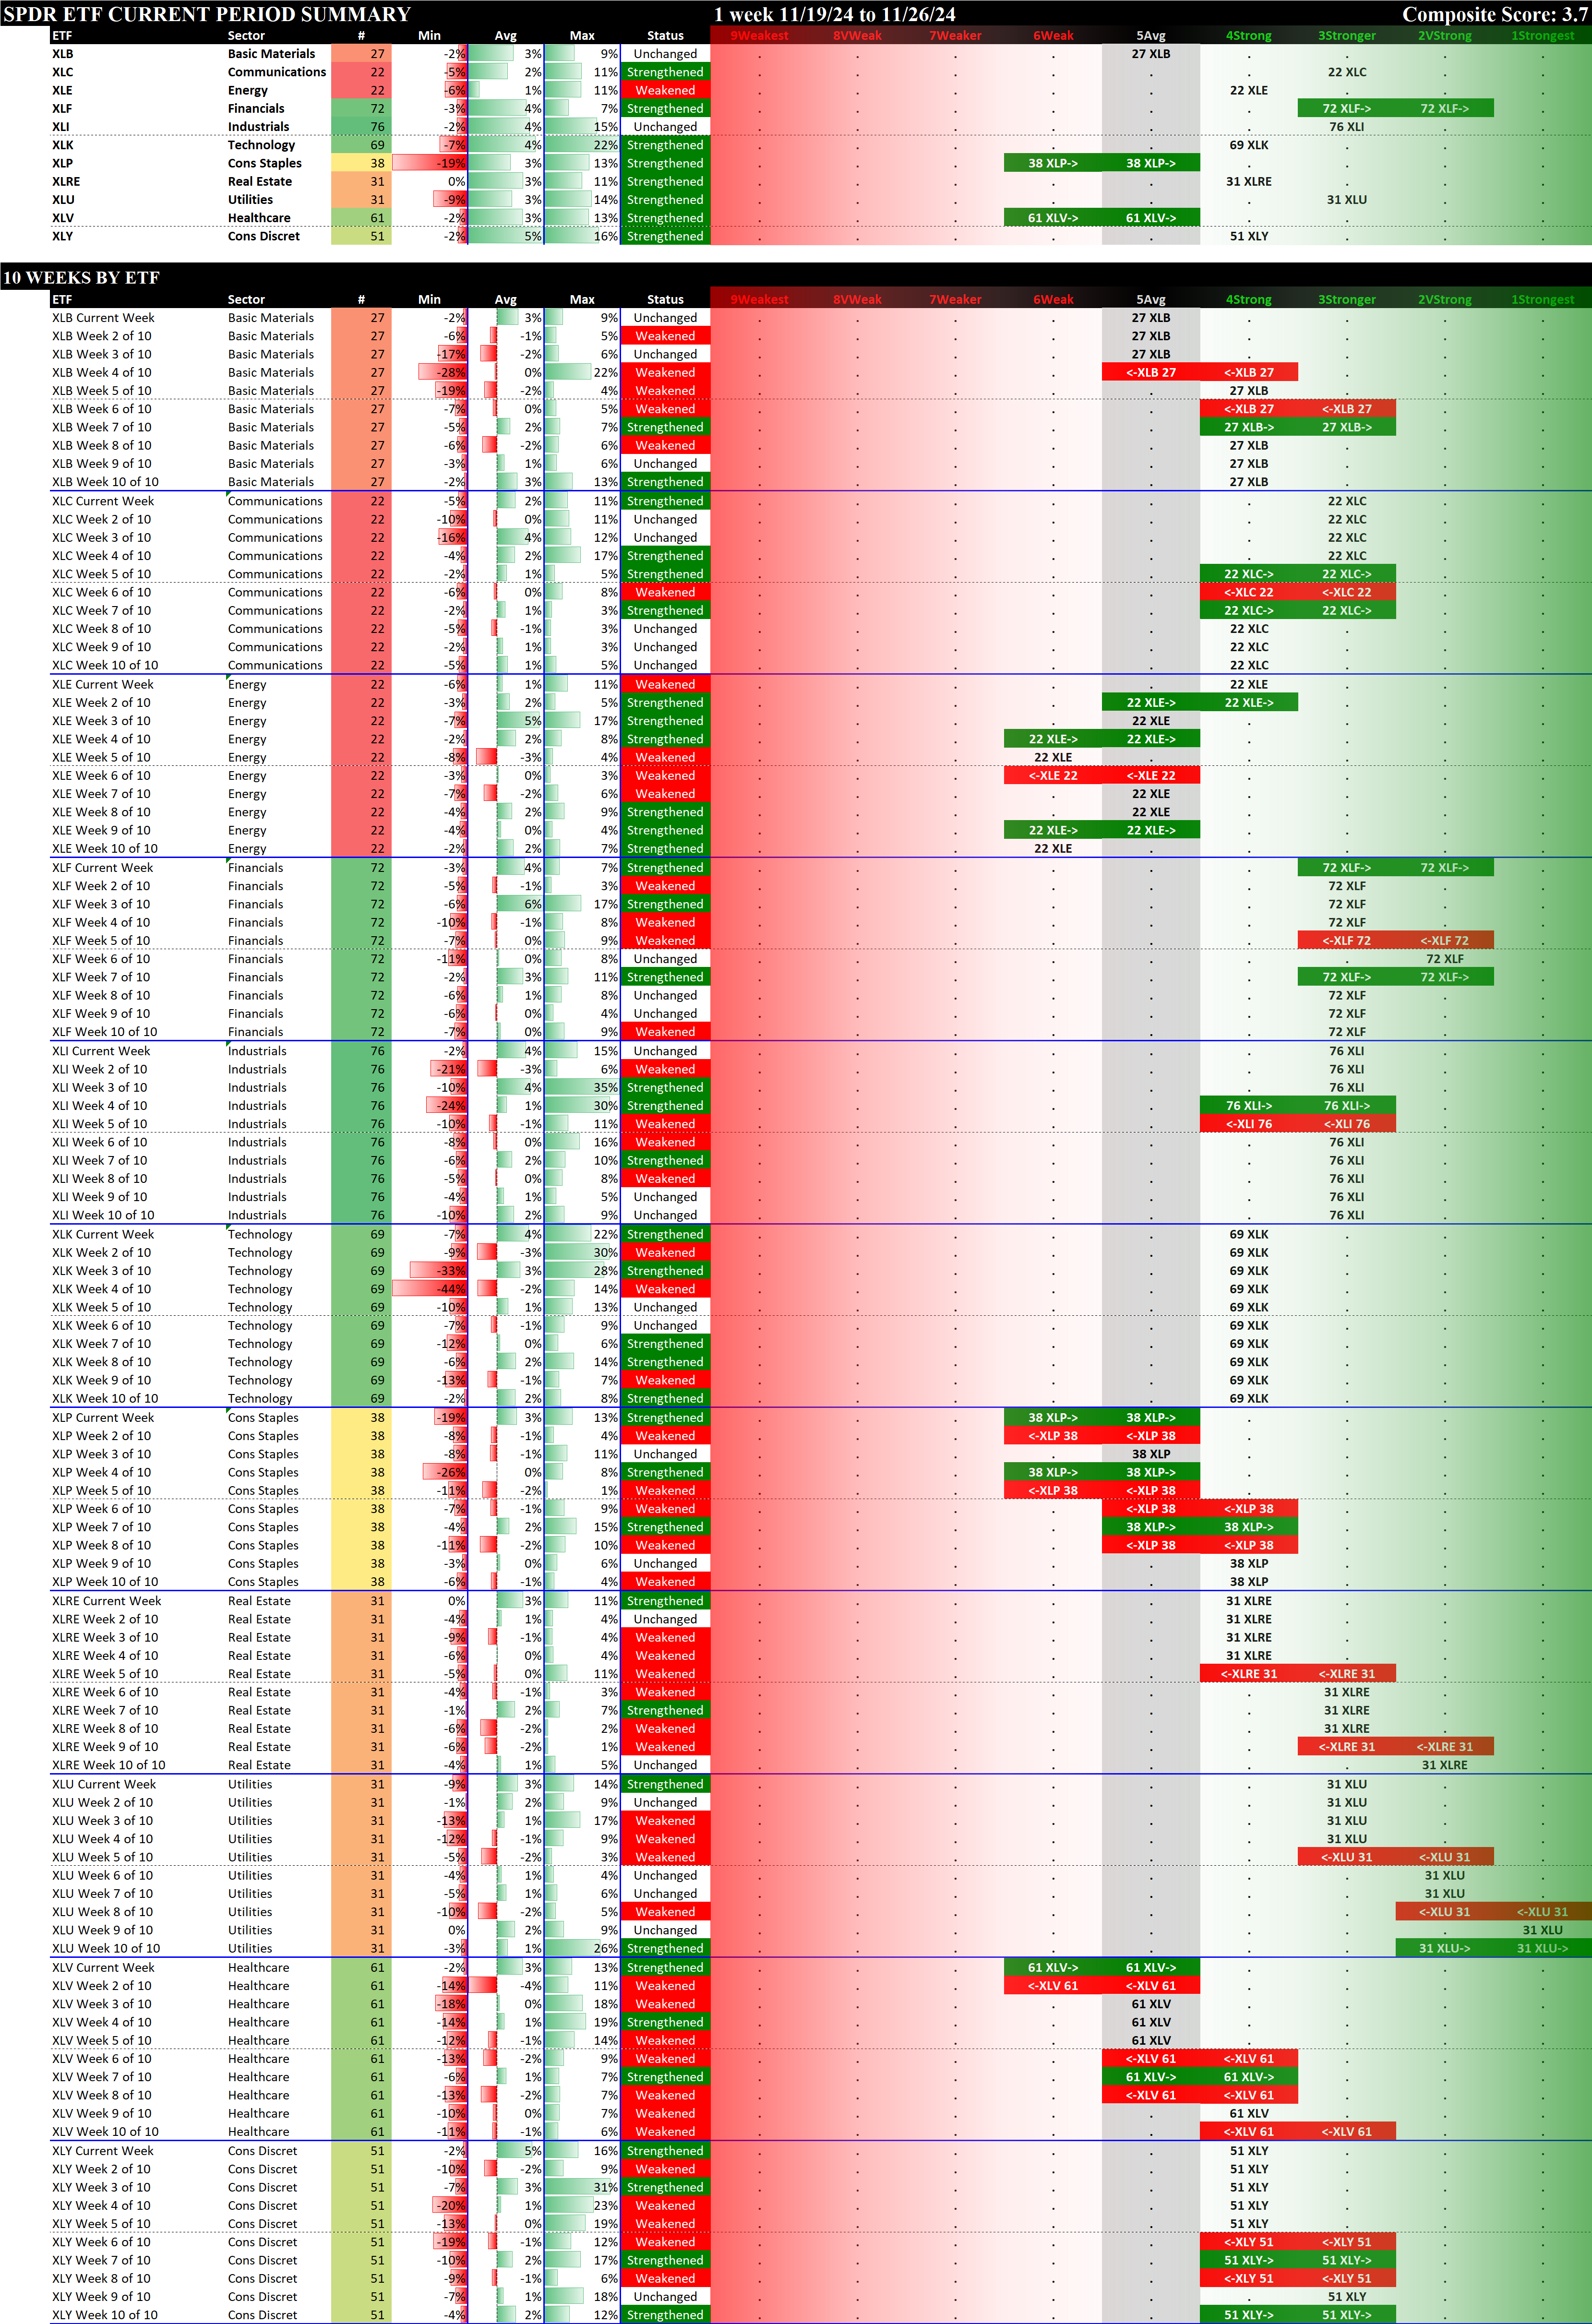
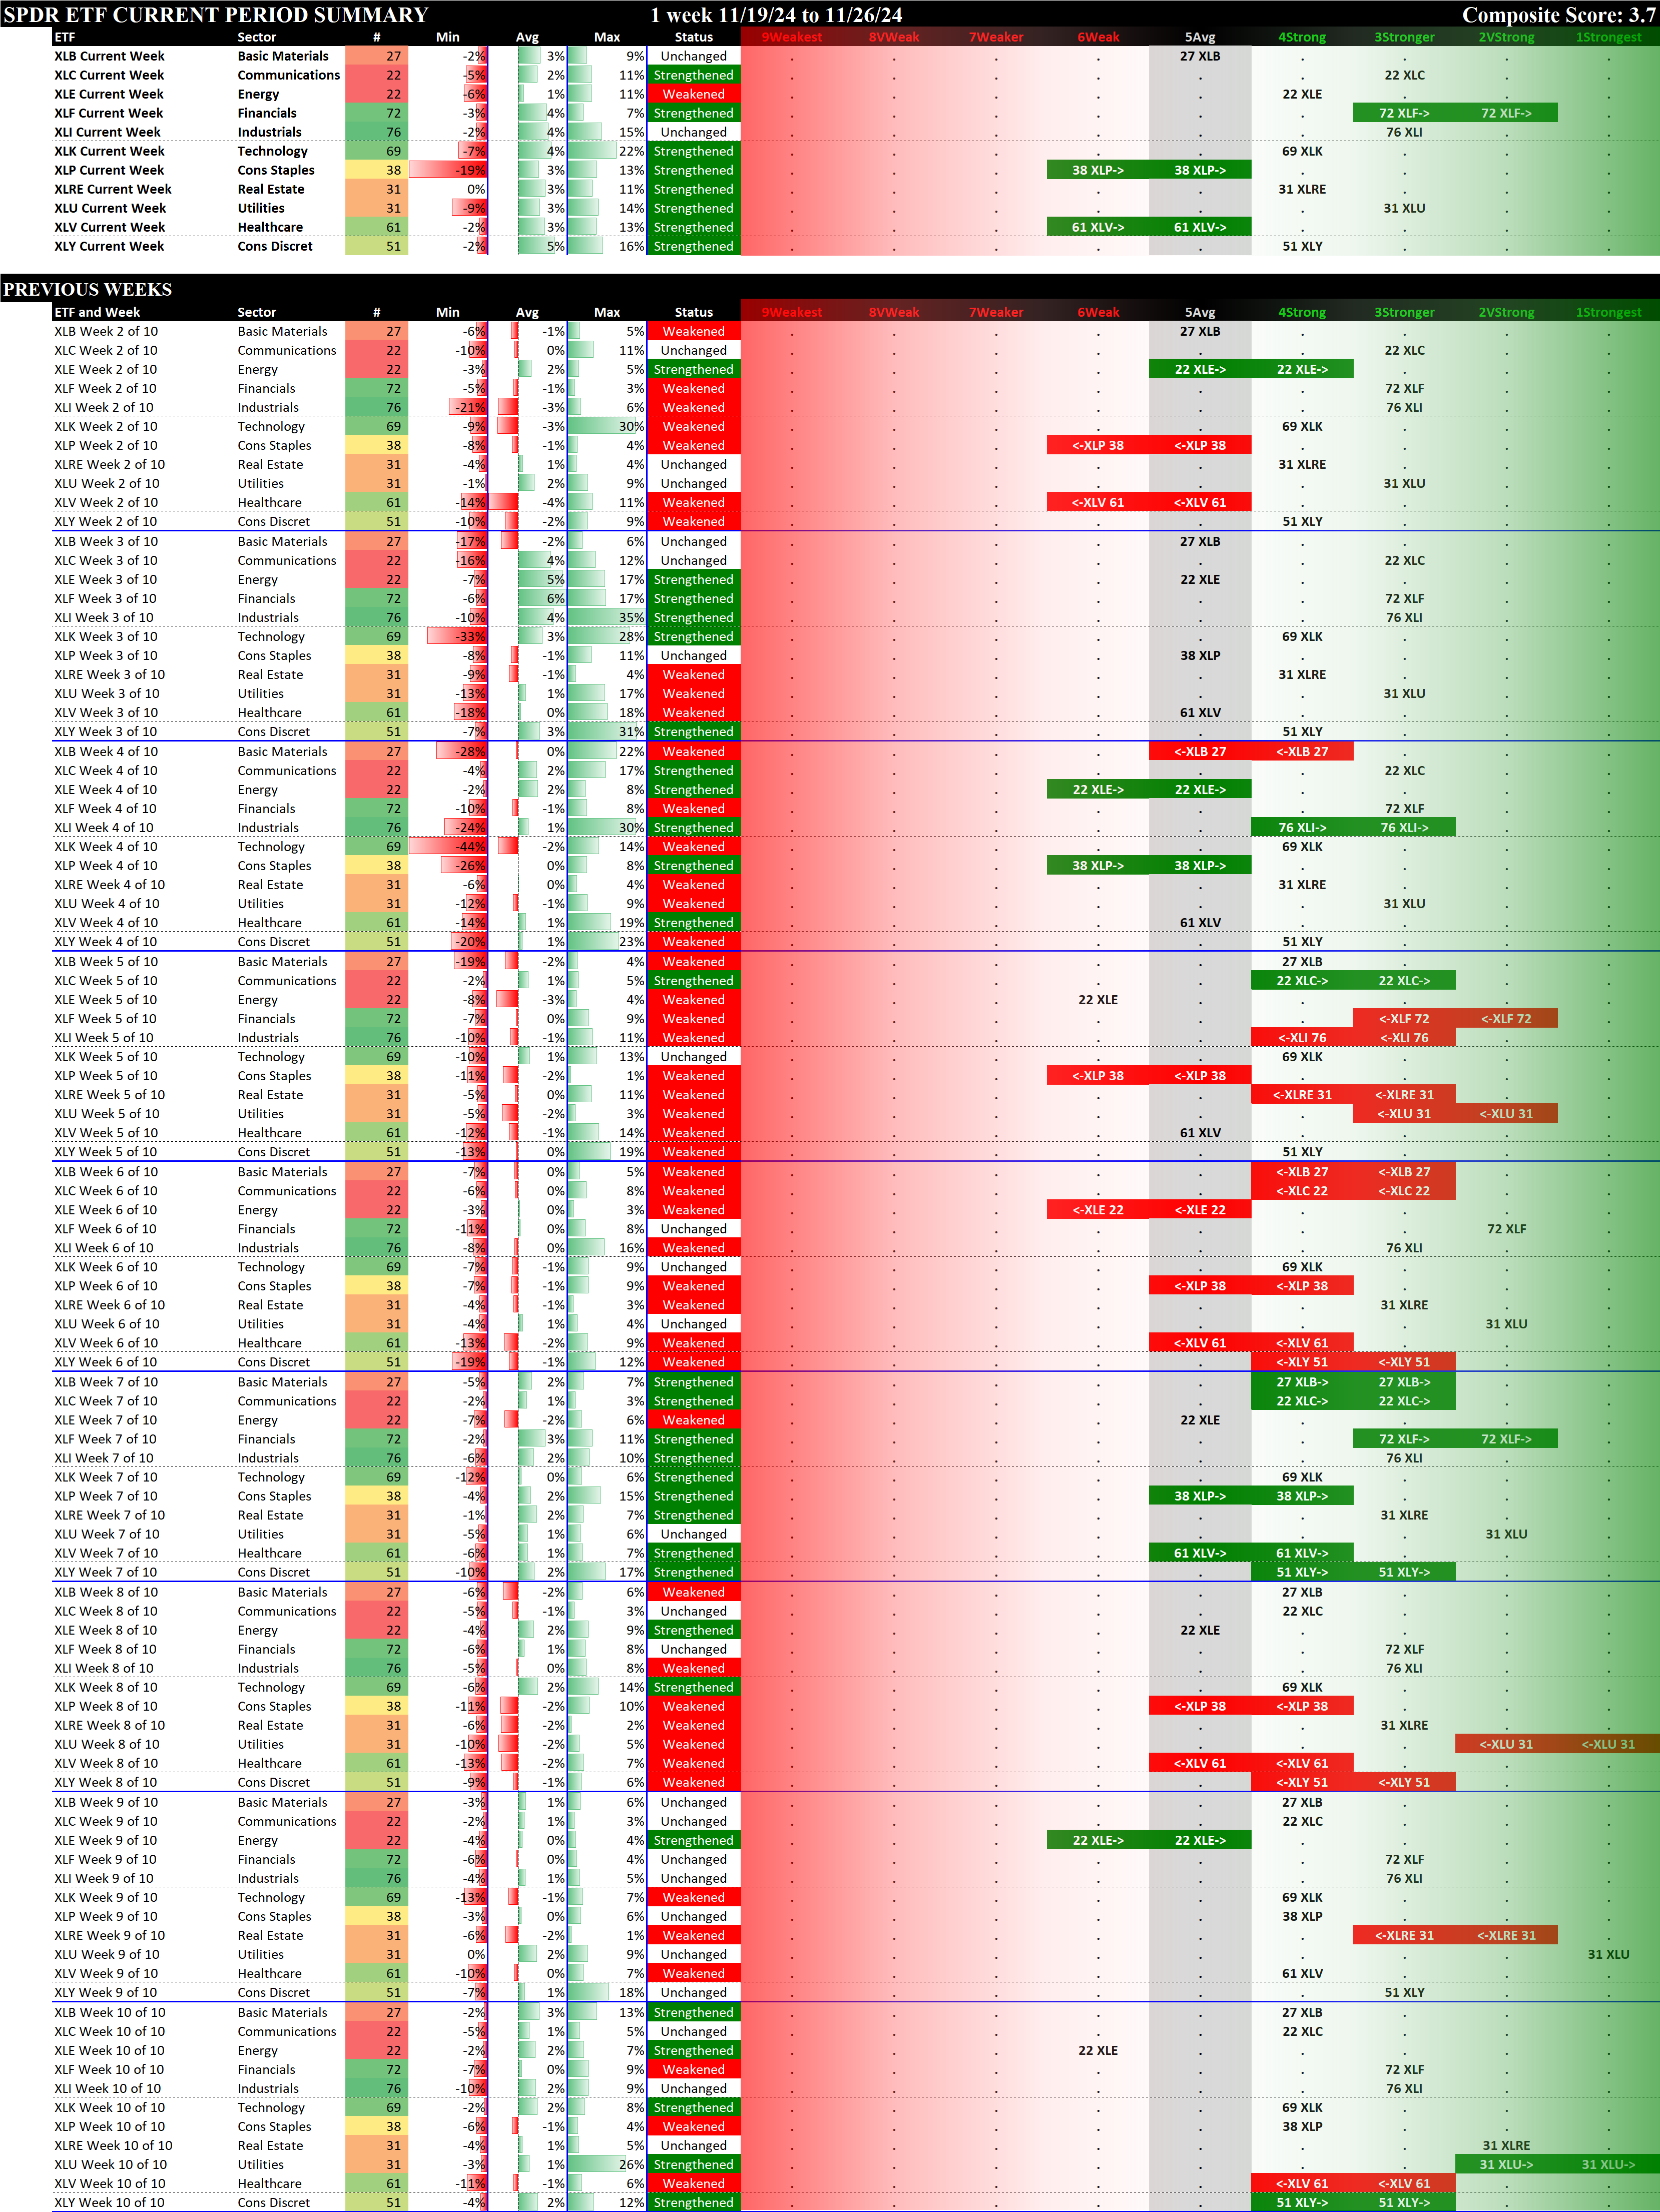
Below are 10-week historical strength rating summaries of the ETFs, sorted first by ETF and then by Week. The graphics make it easy to compare strengthening and weakening between ETFs over the most recent 10 weeks.
Sorted by ETF
This graphic shows the past 10 weeks strengthening and weakening segregated by ETF.
Sorted by Week
This graphic shows the past 10 weeks strengthening and weakening segregated by week.
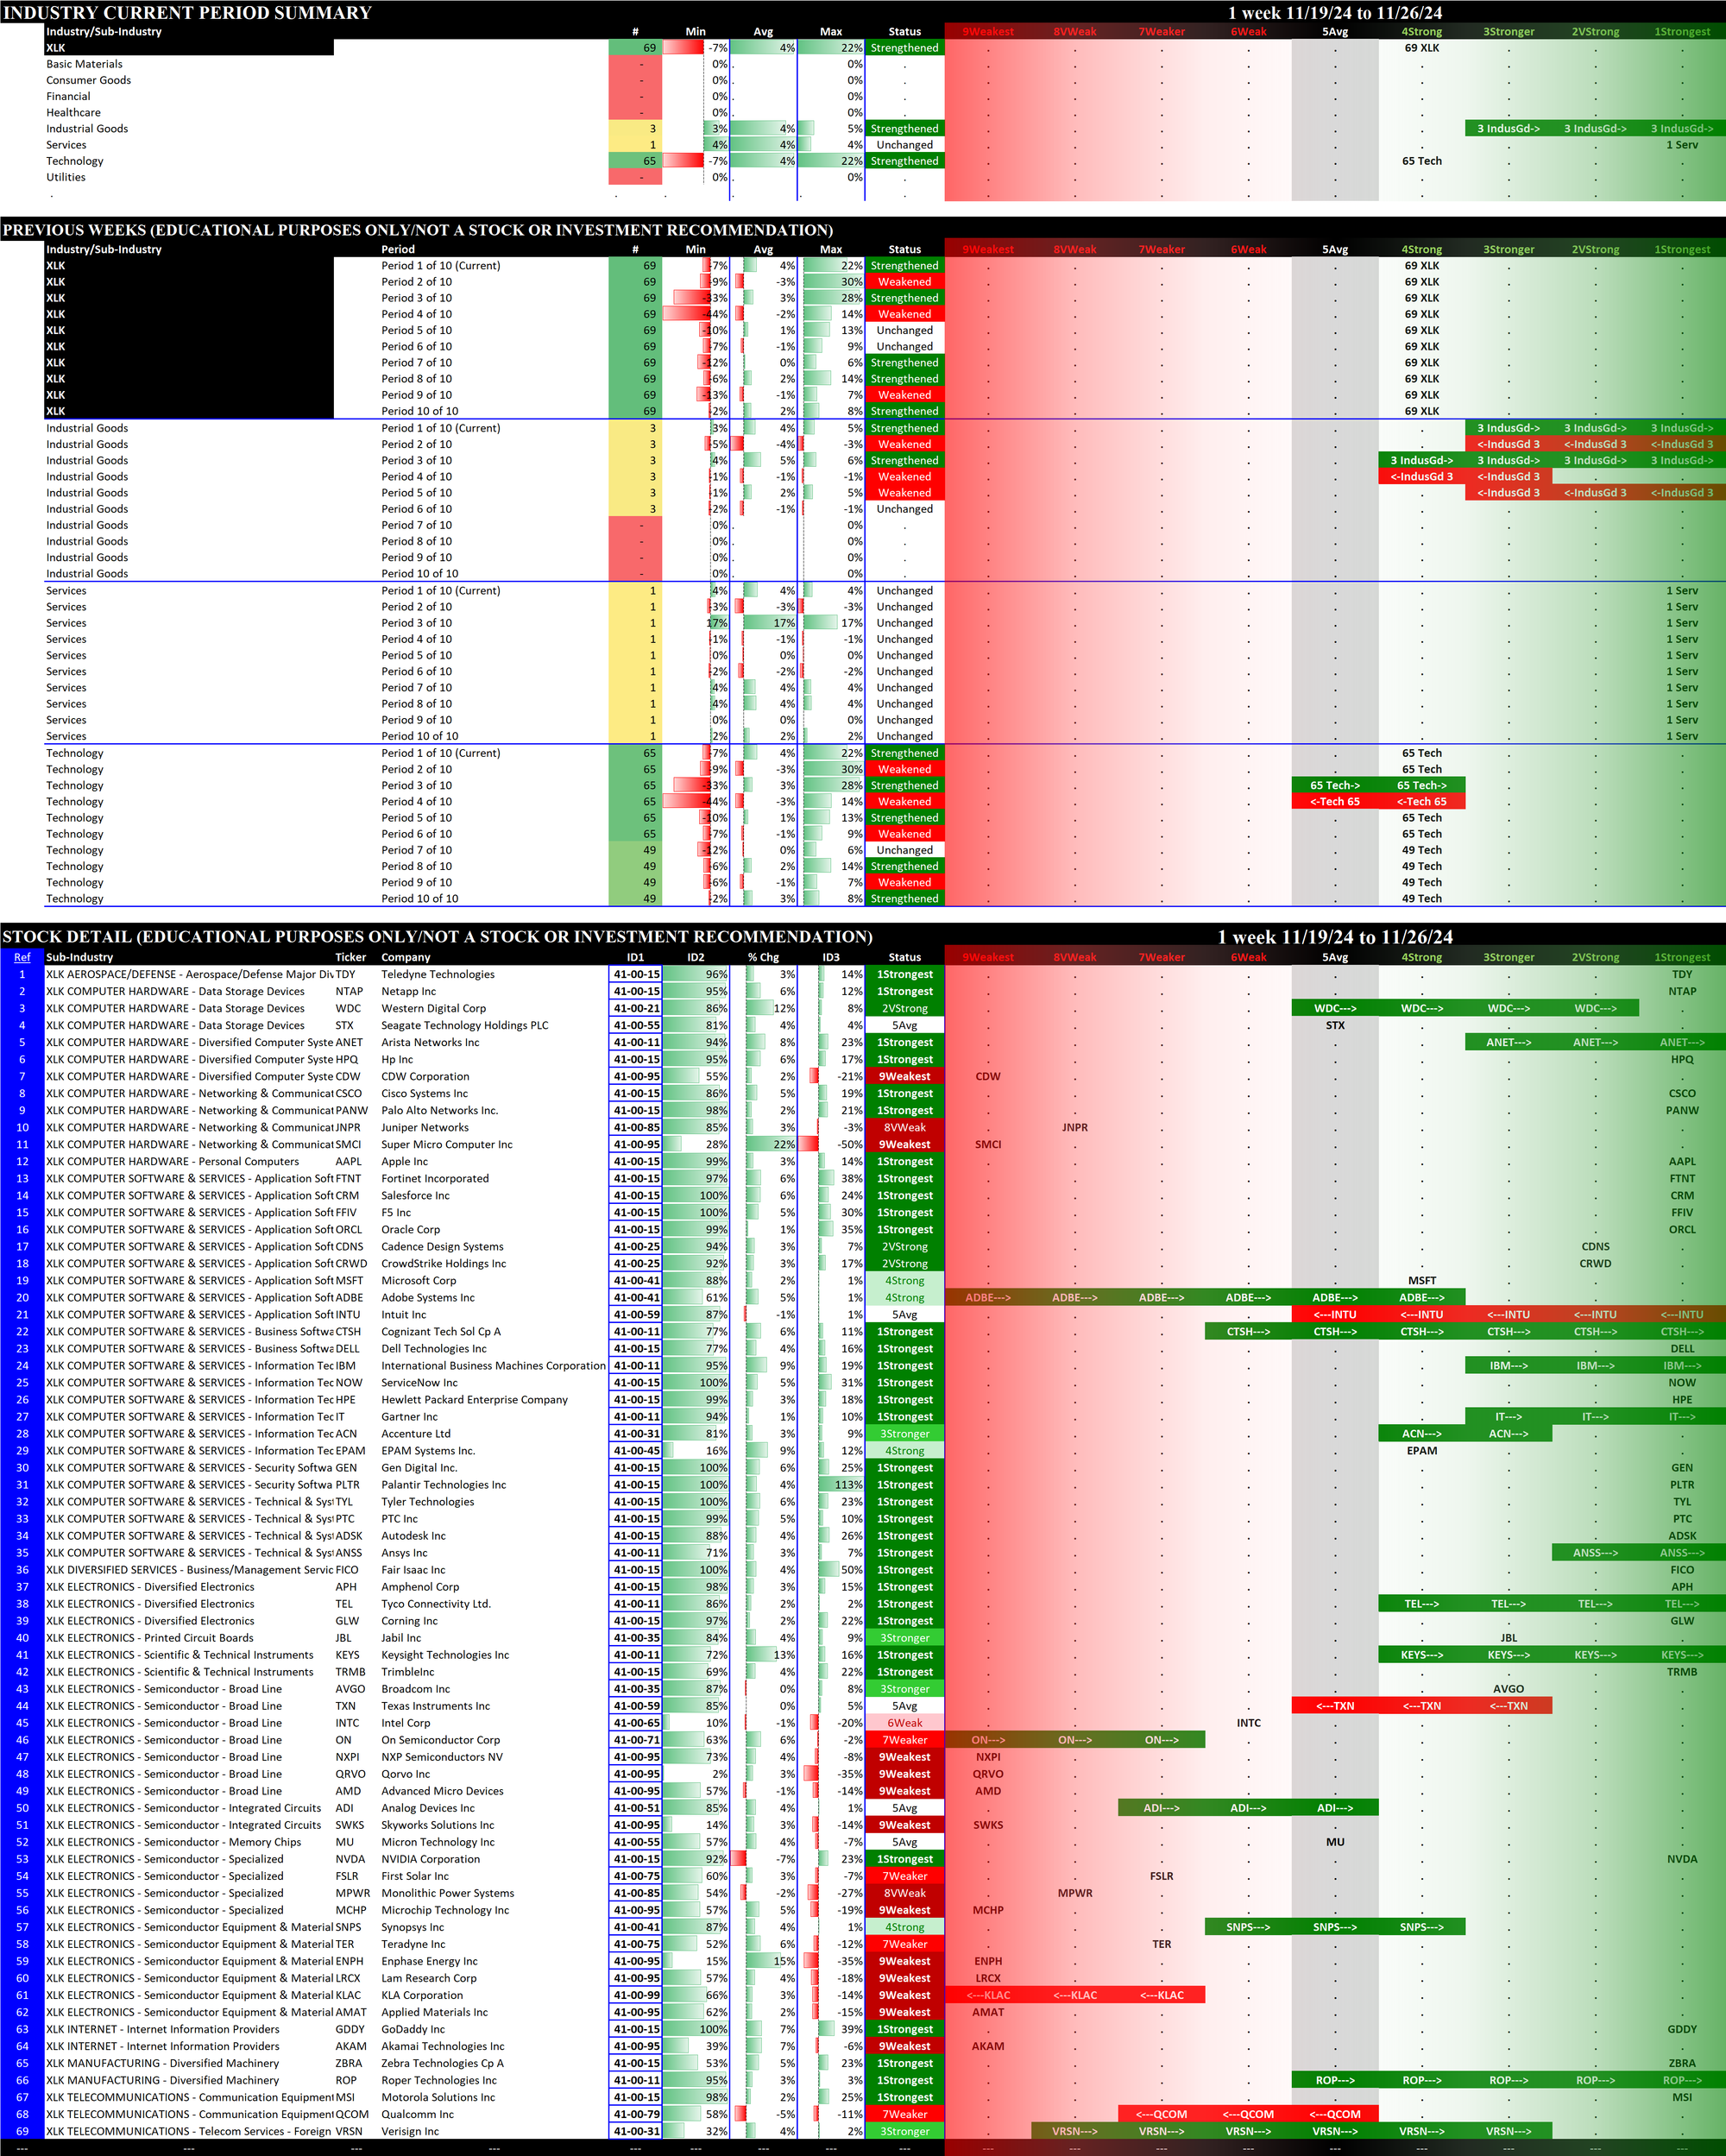
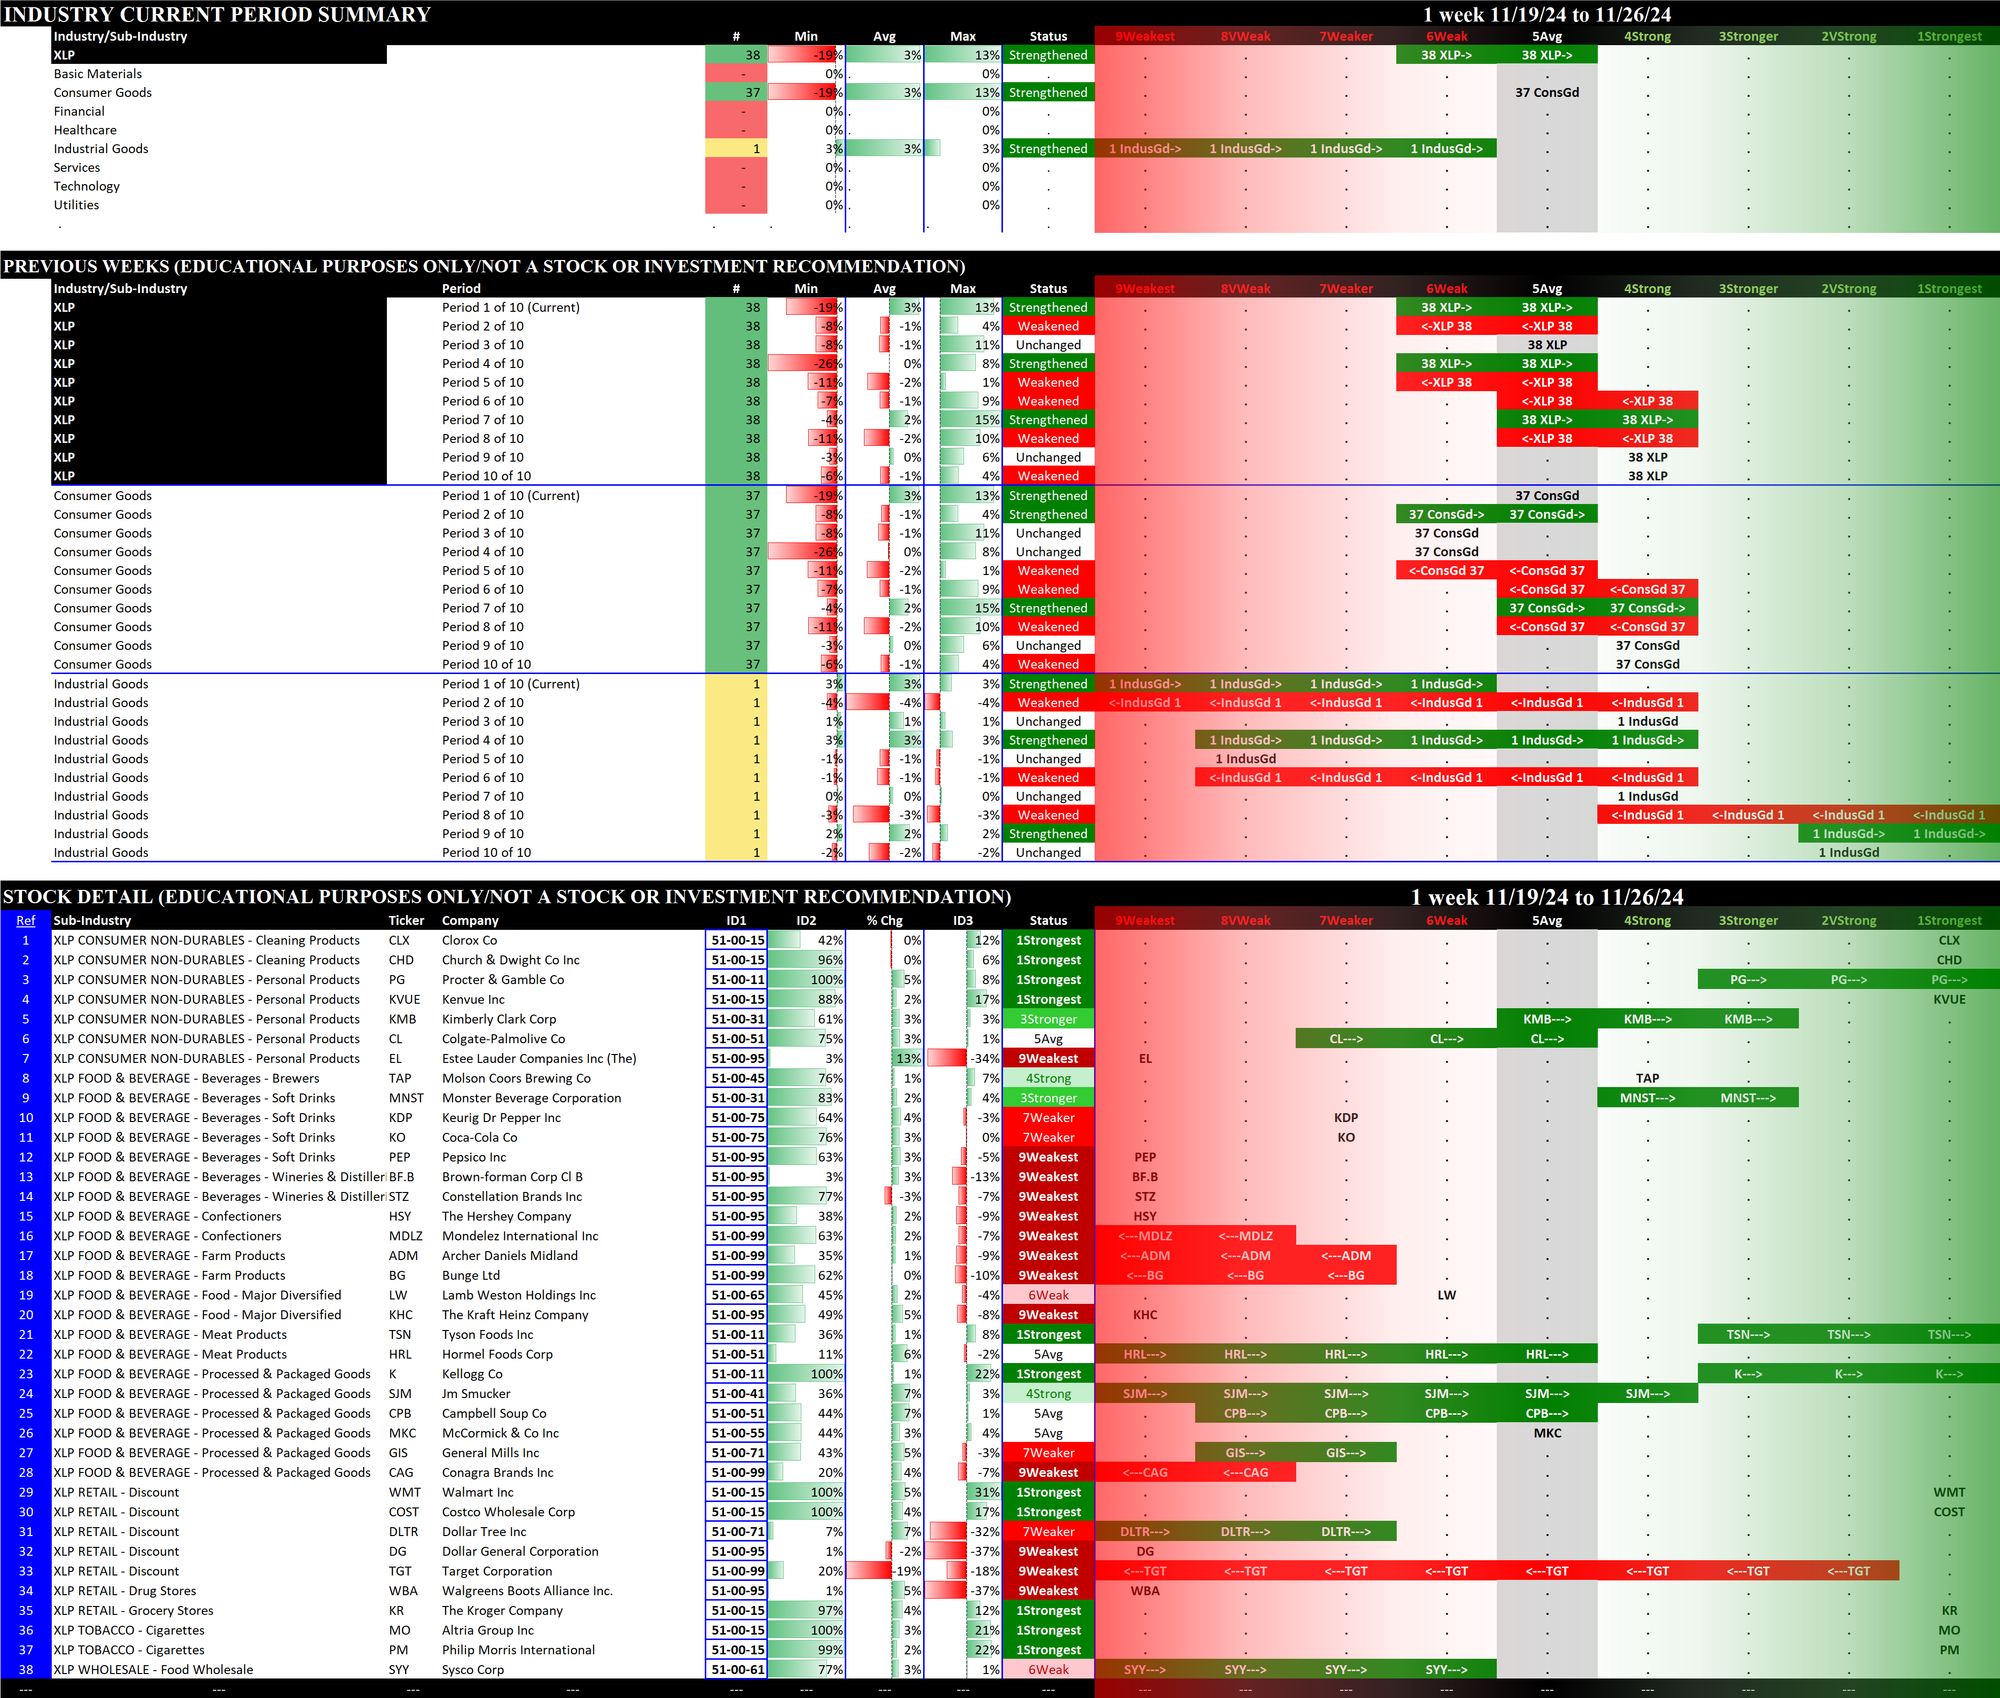
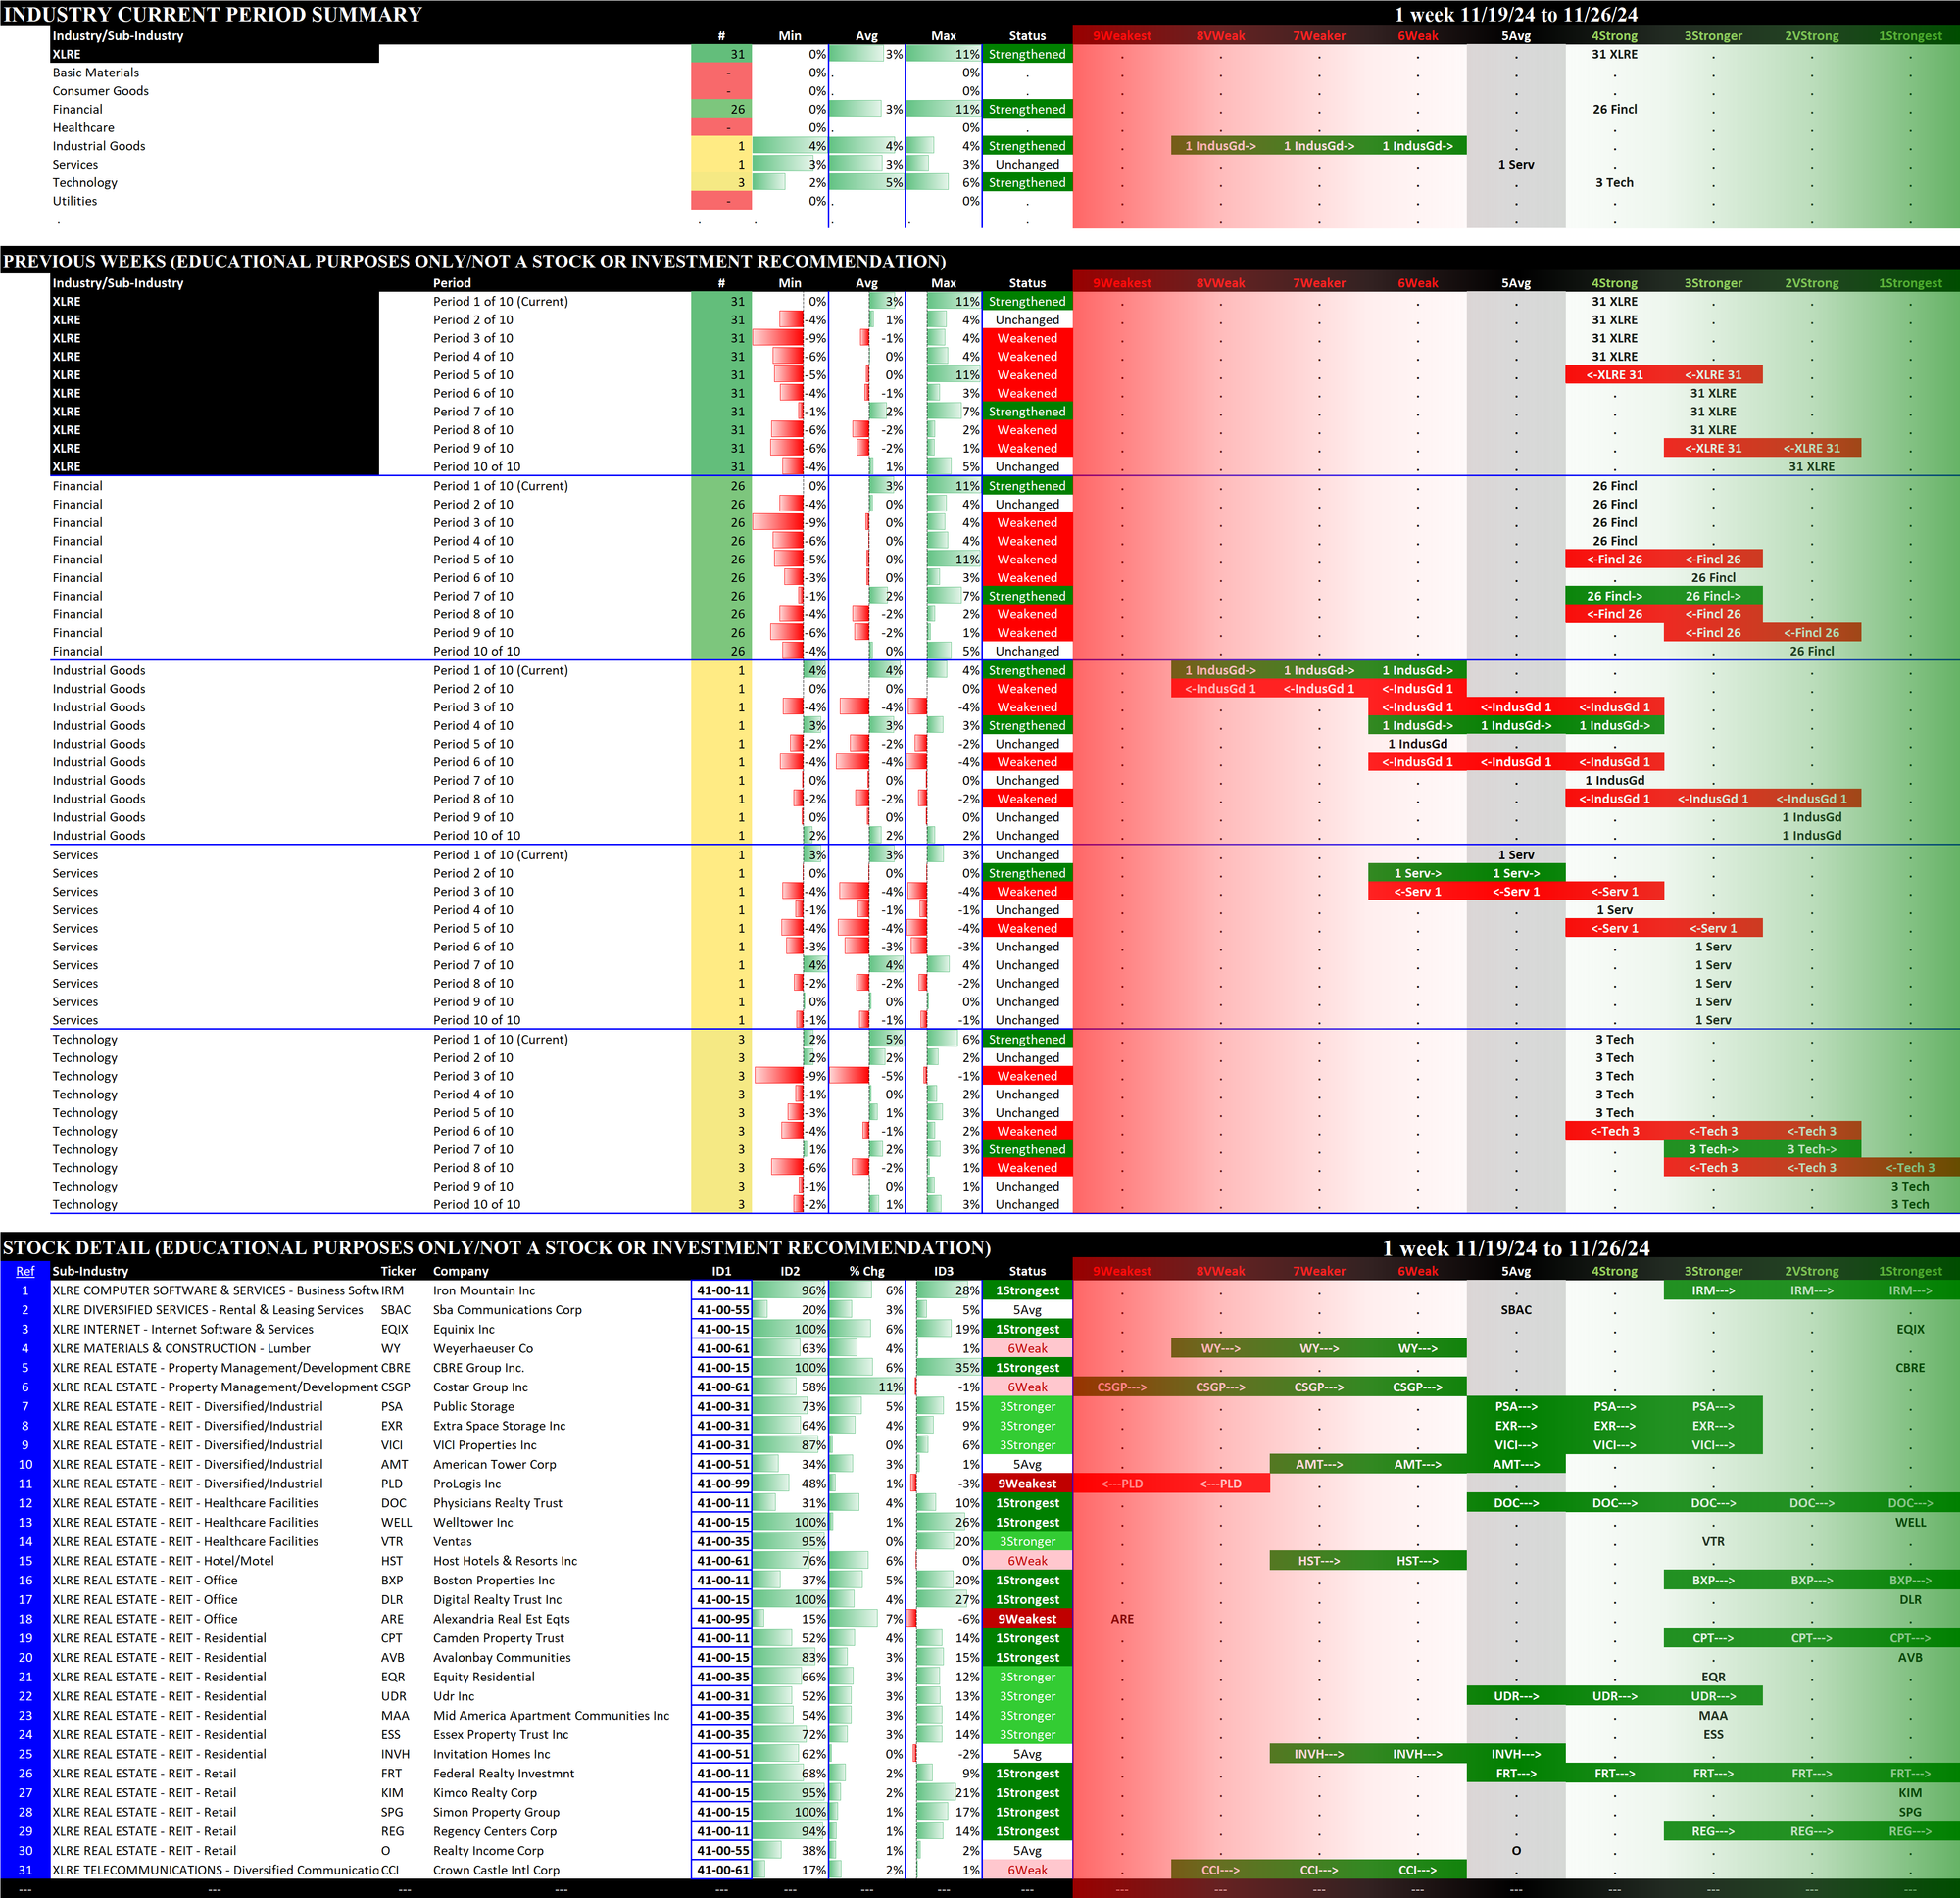
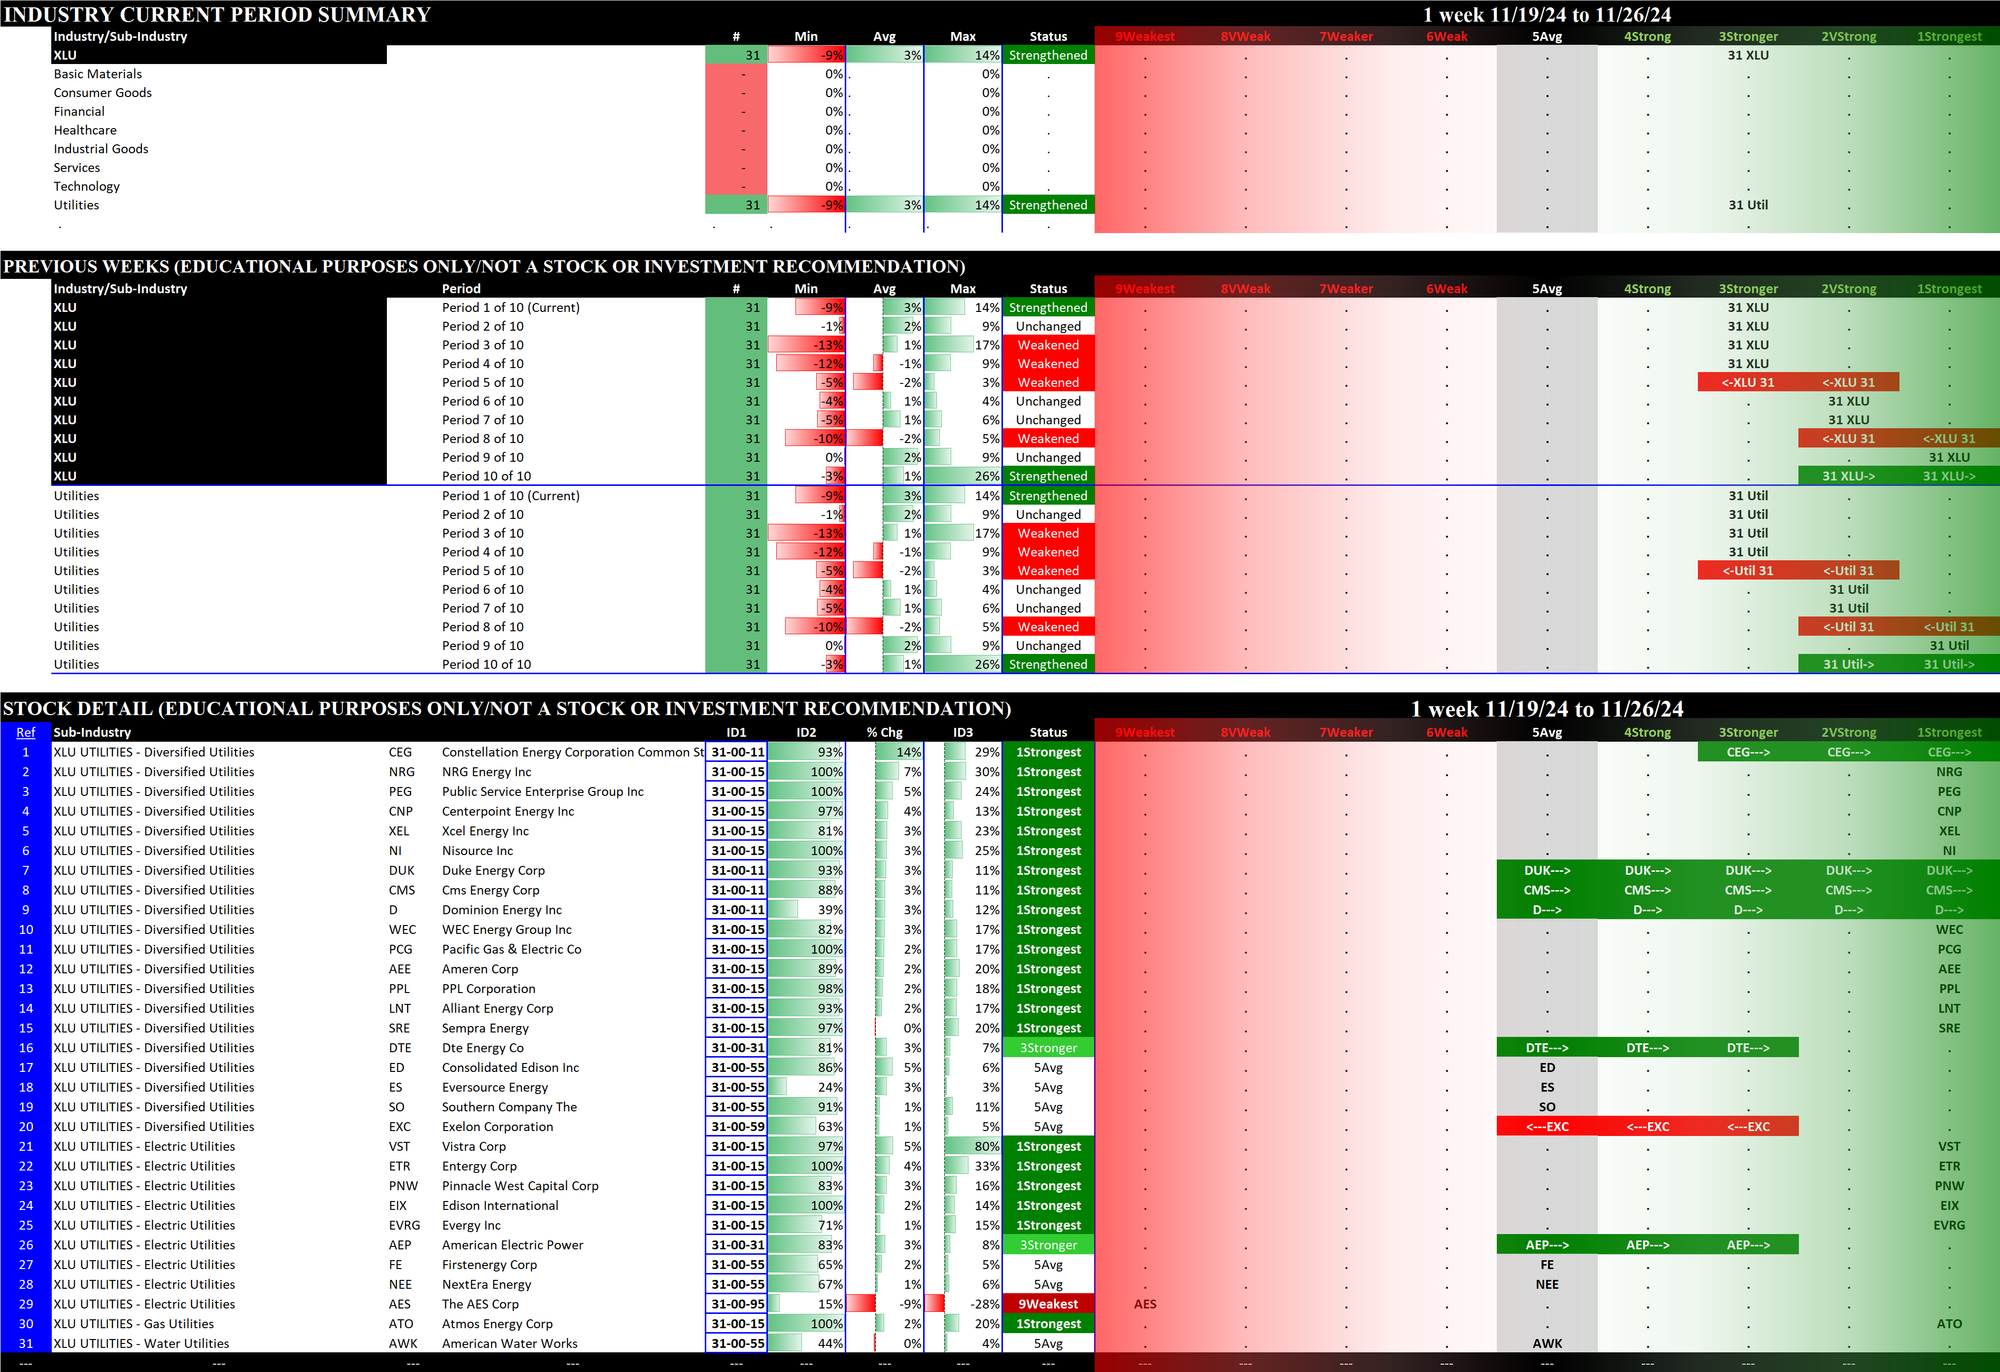
2. ETFs Detail
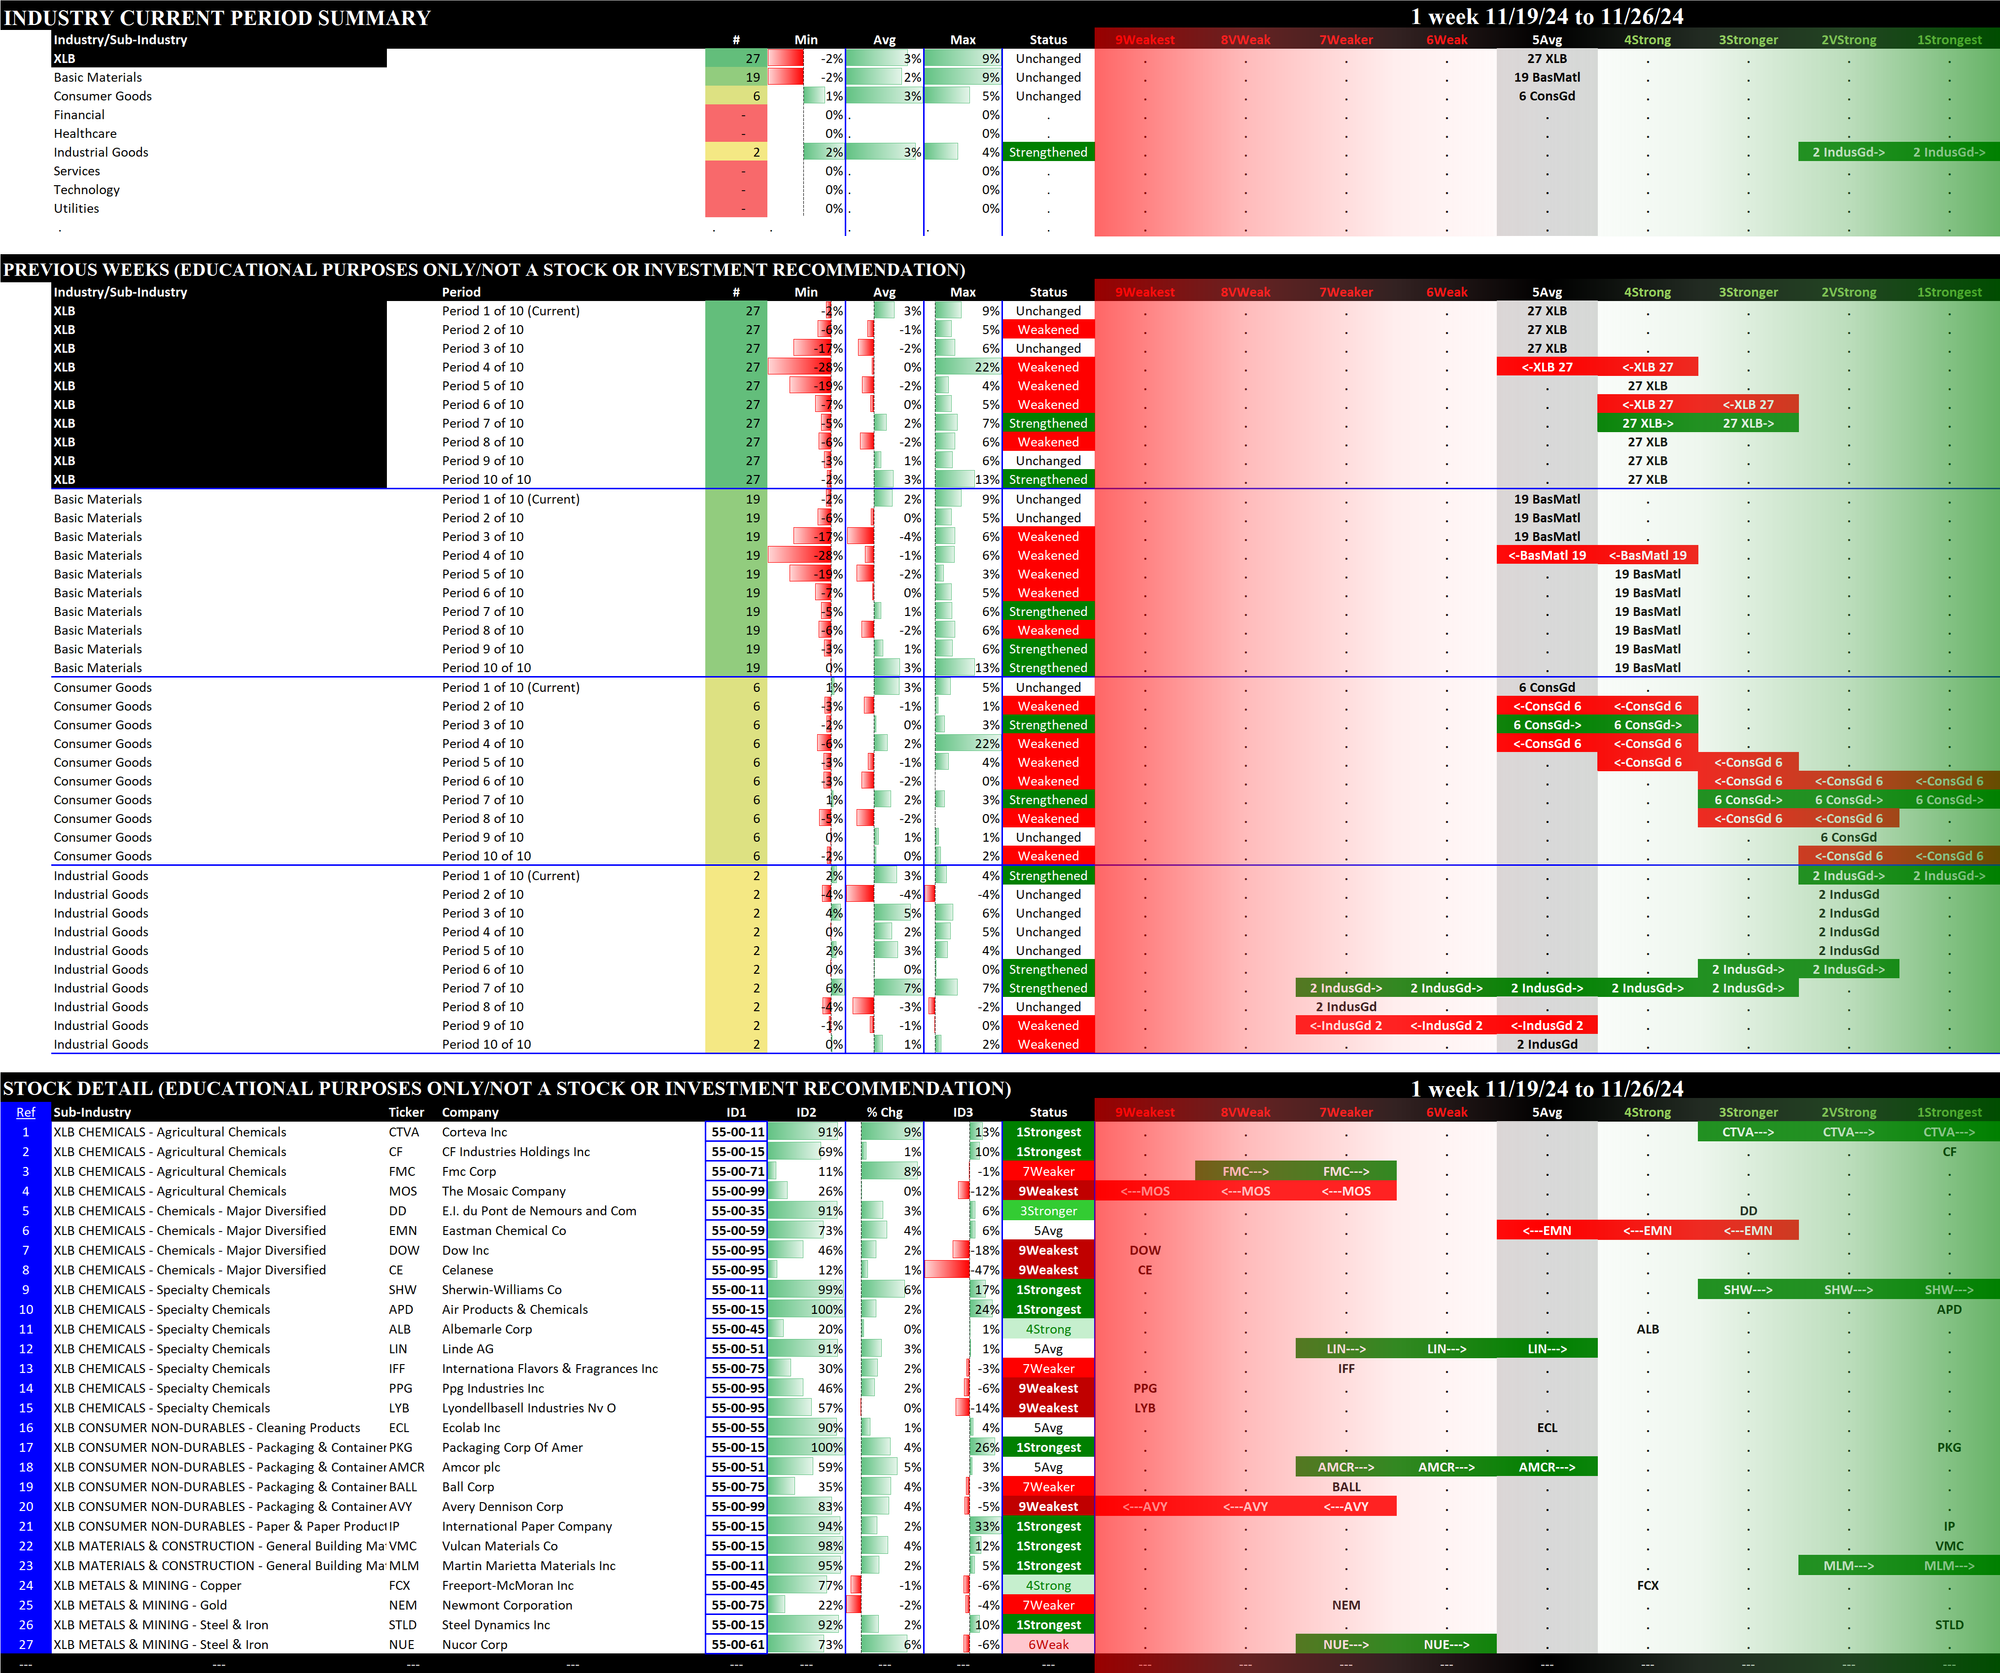
Details for each of the 11 ETFs are provided below. Comments:
- The top section shows the strength rating of the sectors comprising each ETF, based on the eight original Stock Market Organizer classifications and NOT the 11 ETF classifications. For example, the XLB Basic Materials ETF consists of 19 Basic Materials stocks, 6 Consumer Goods stocks, and 2 Industrial Goods stocks.
- The middle section shows the previous 10 weeks' strengthening and weakening of the relevant sectors. For example, since the XLB has Basic Materials, Consumer Goods, and Industrial Goods stocks, these three sectors are shown in the middle section of the XLB detail. The XLF (Financial) has Financial, Services, and Tech stocks.
- The bottom section shows strengthening/weakening for the underlying ETF components stocks, and includes the listing of their Stock Market Organizer industries and sub-industries. These stocks are listed in order based on Sub-industry then strongest to weakest comparative stock strength rating. The Basic Materials XLB ETF includes both Newmont Corporation/NEM in the Gold sub-industry within the Metals & Mining industry and Dow Inc./DOW in the Specialty Chemicals sub-industry within the Chemicals industry.
In these bottom sections, one can visually see the strength/strengthening and weakness/weakening of the component stocks in each ETF.
2.1 XLB Materials (27 stocks, small), Unchanged at 5Avg = tied for WORST
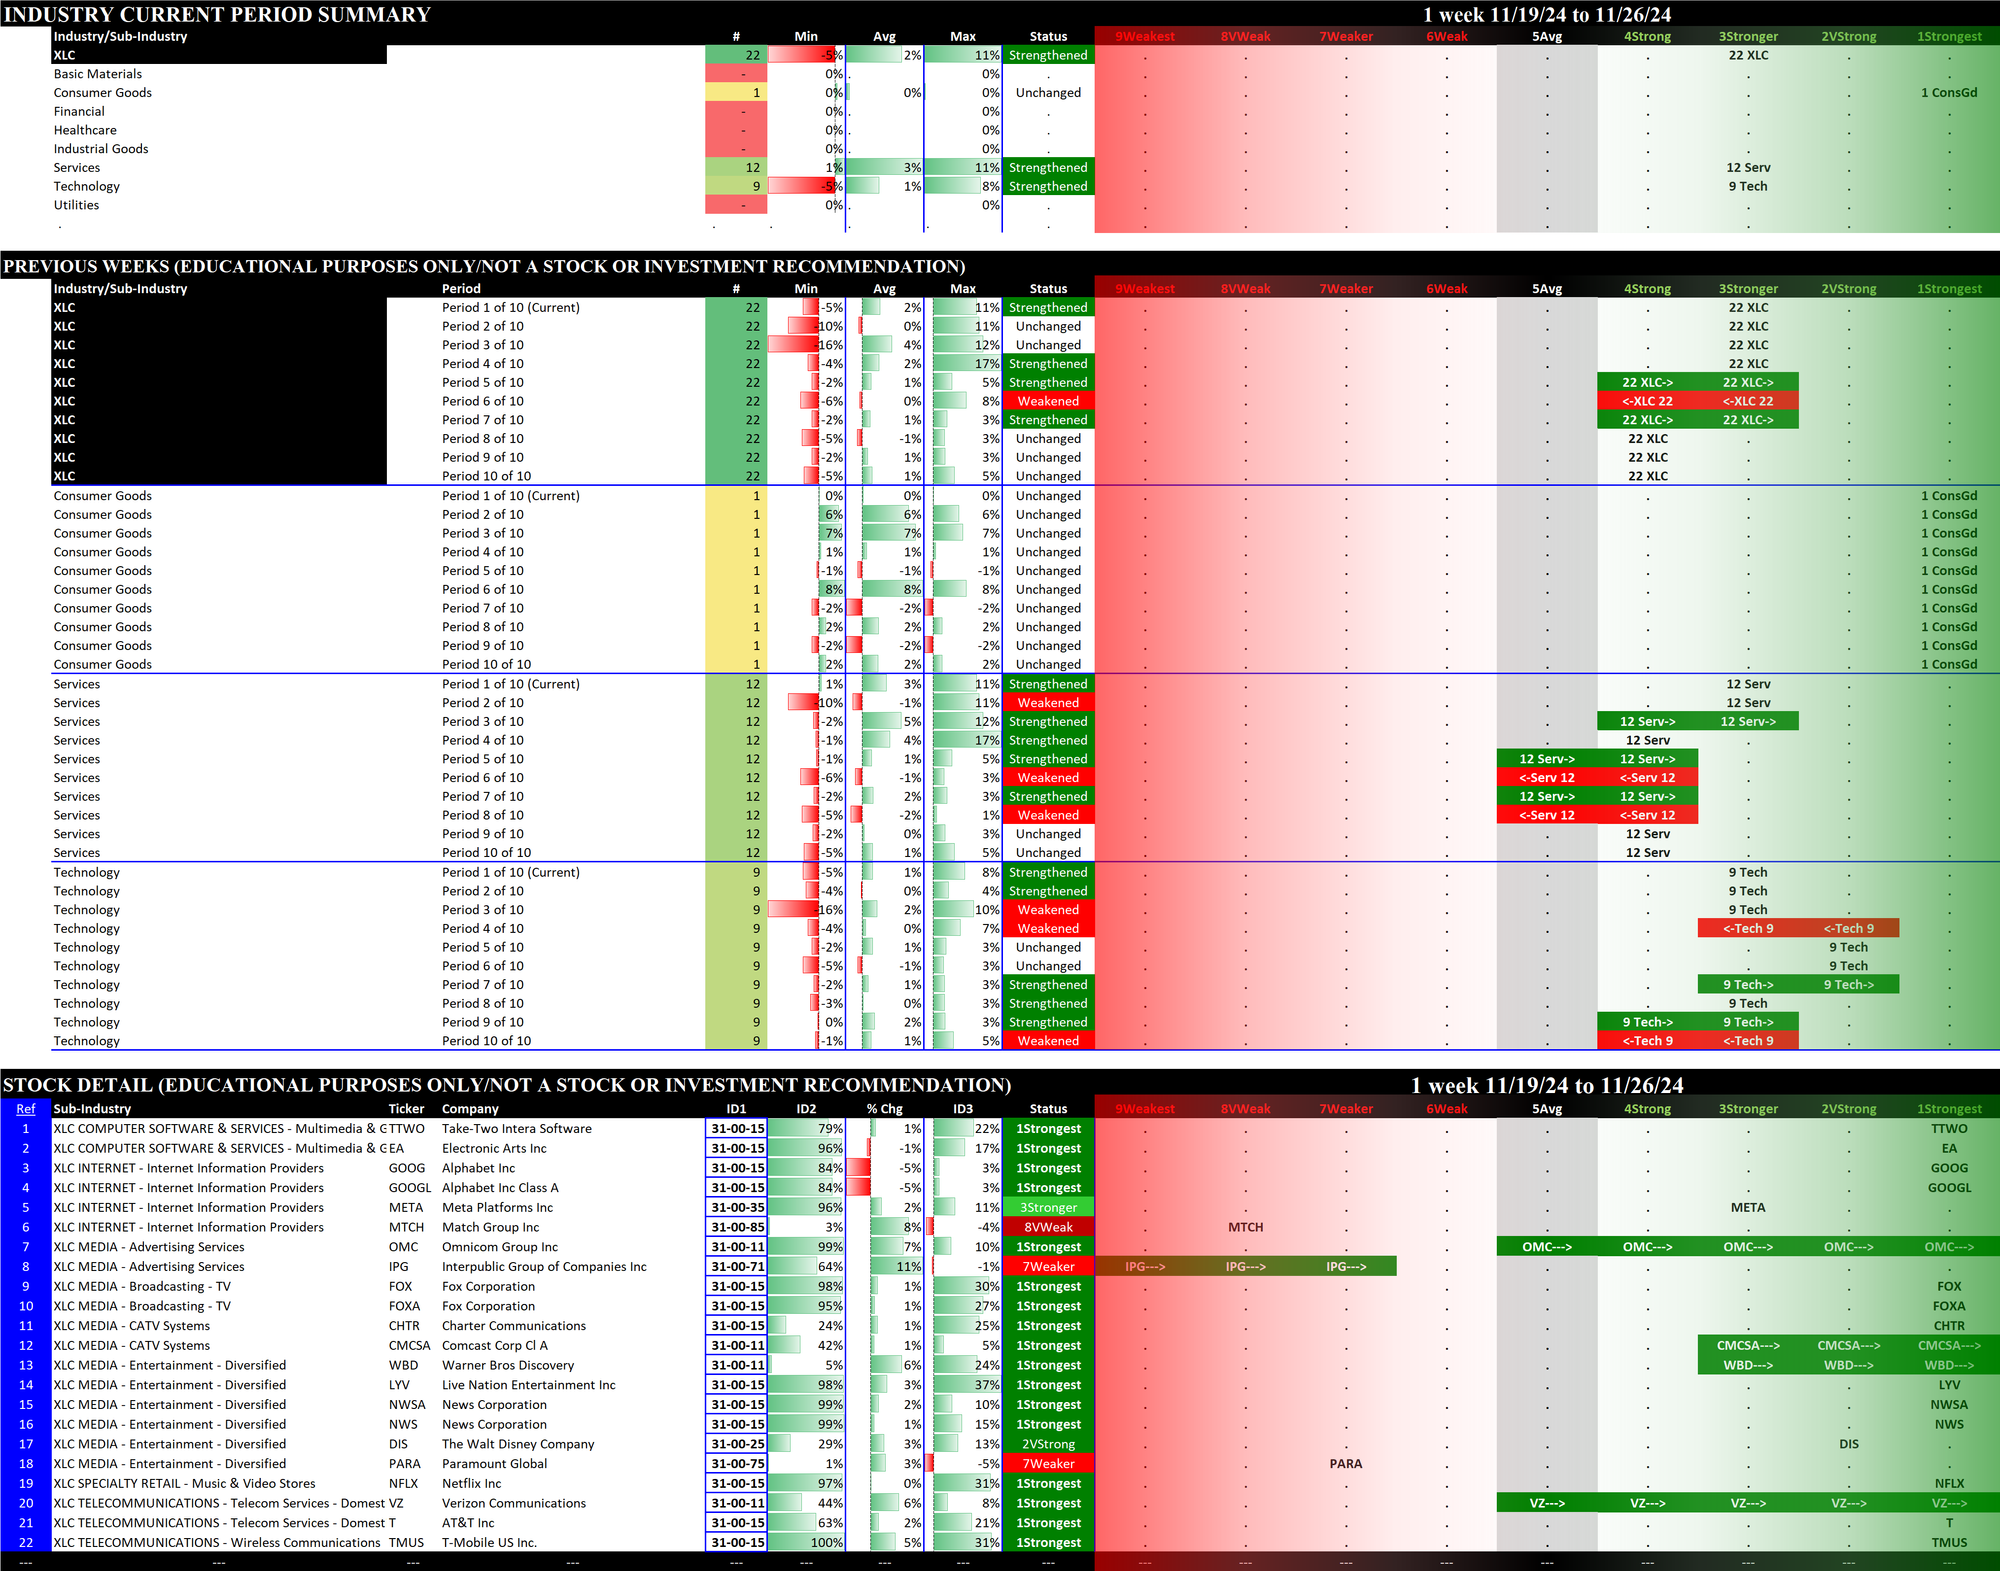
2.2 XLC Communication Services (22 stocks, small), Strengthened at 3Stronger
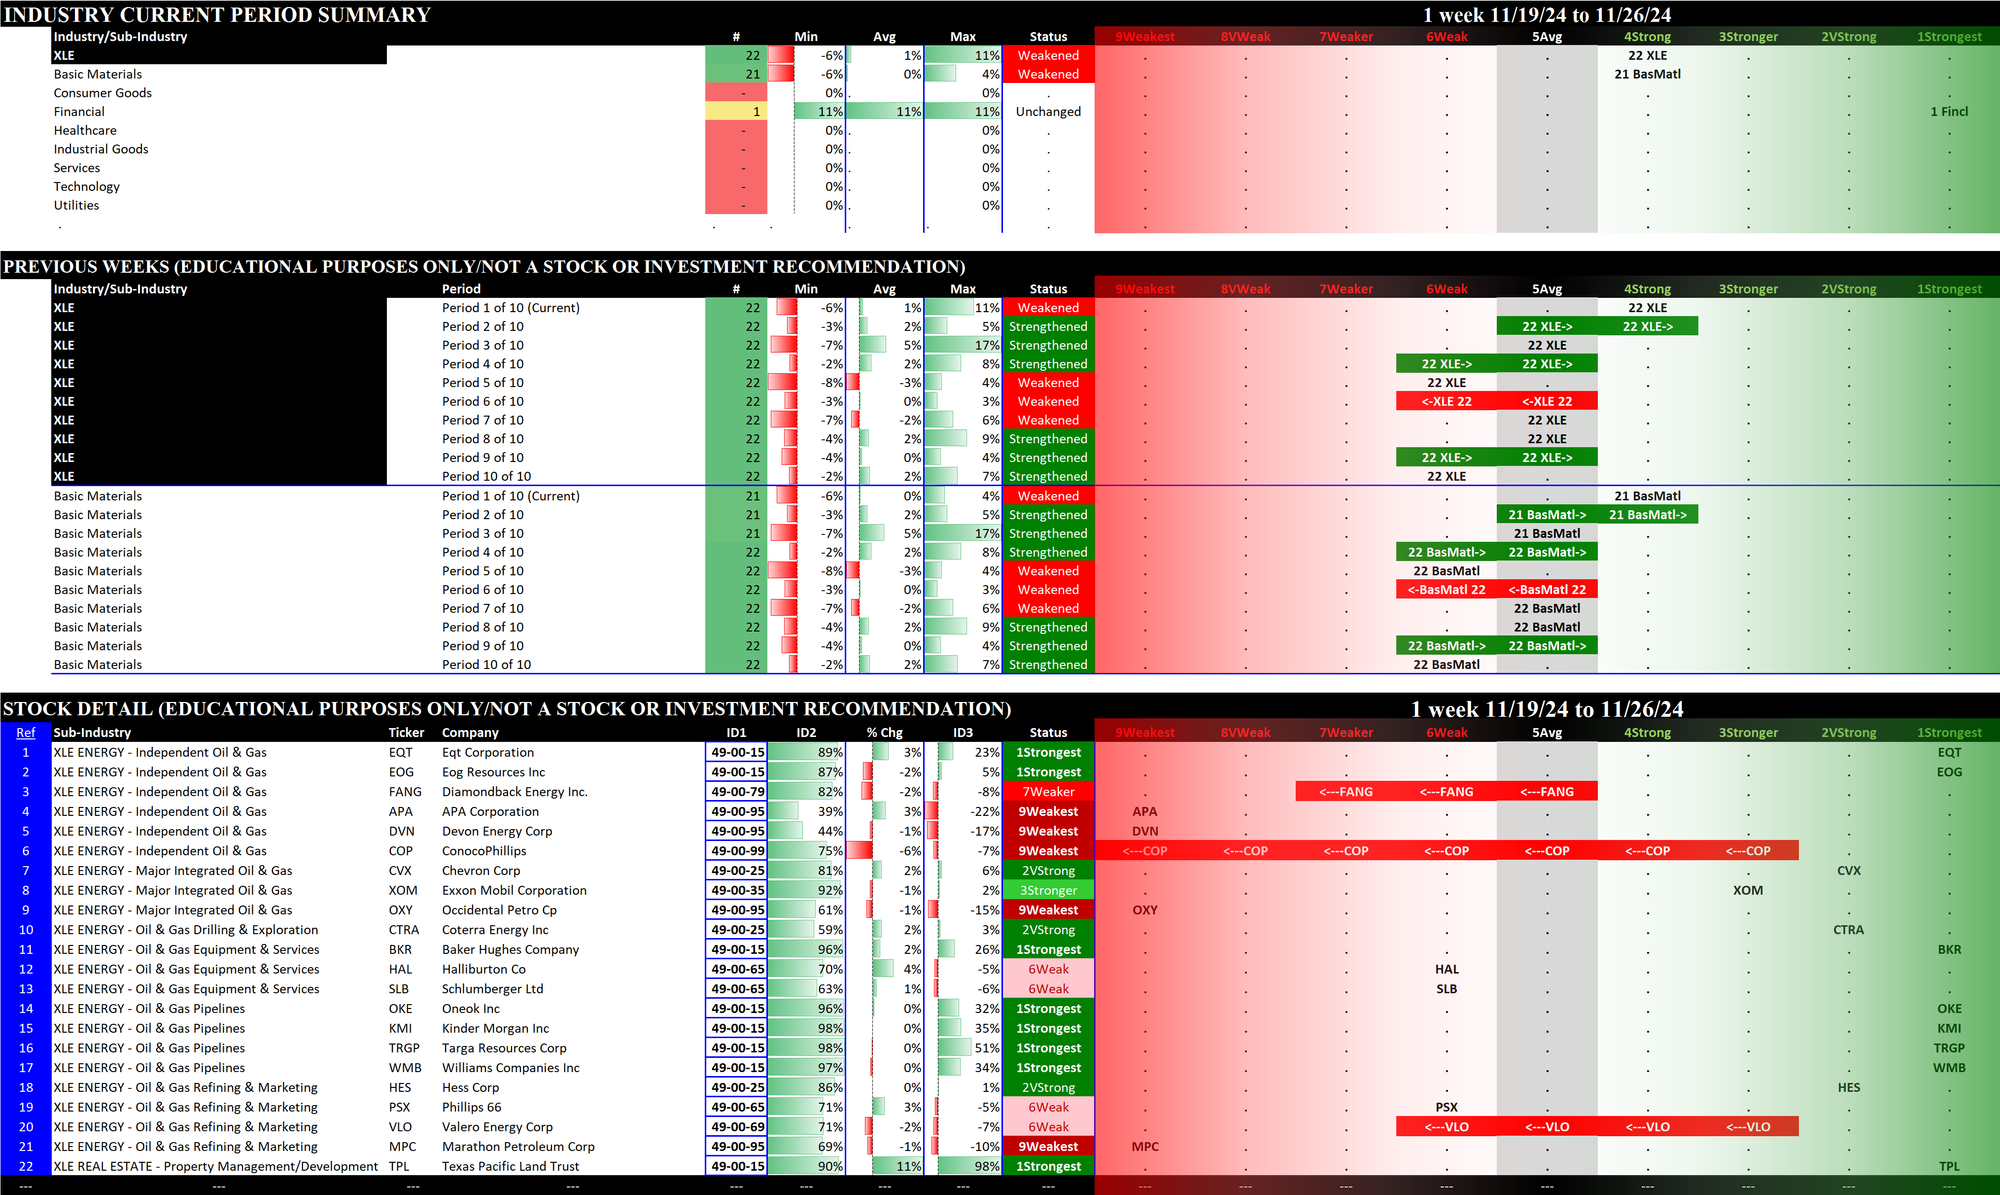
2.3 XLE Energy (22 stocks, small), Weakened at 4Strong
Note that as of 11/22/24 ConocoPhillips completed its acquisition of Marathon Oil Corporation (formerly MRO). The latter has been replaced in XLE/Energy by TPL/Texas Pacific Land Trust.
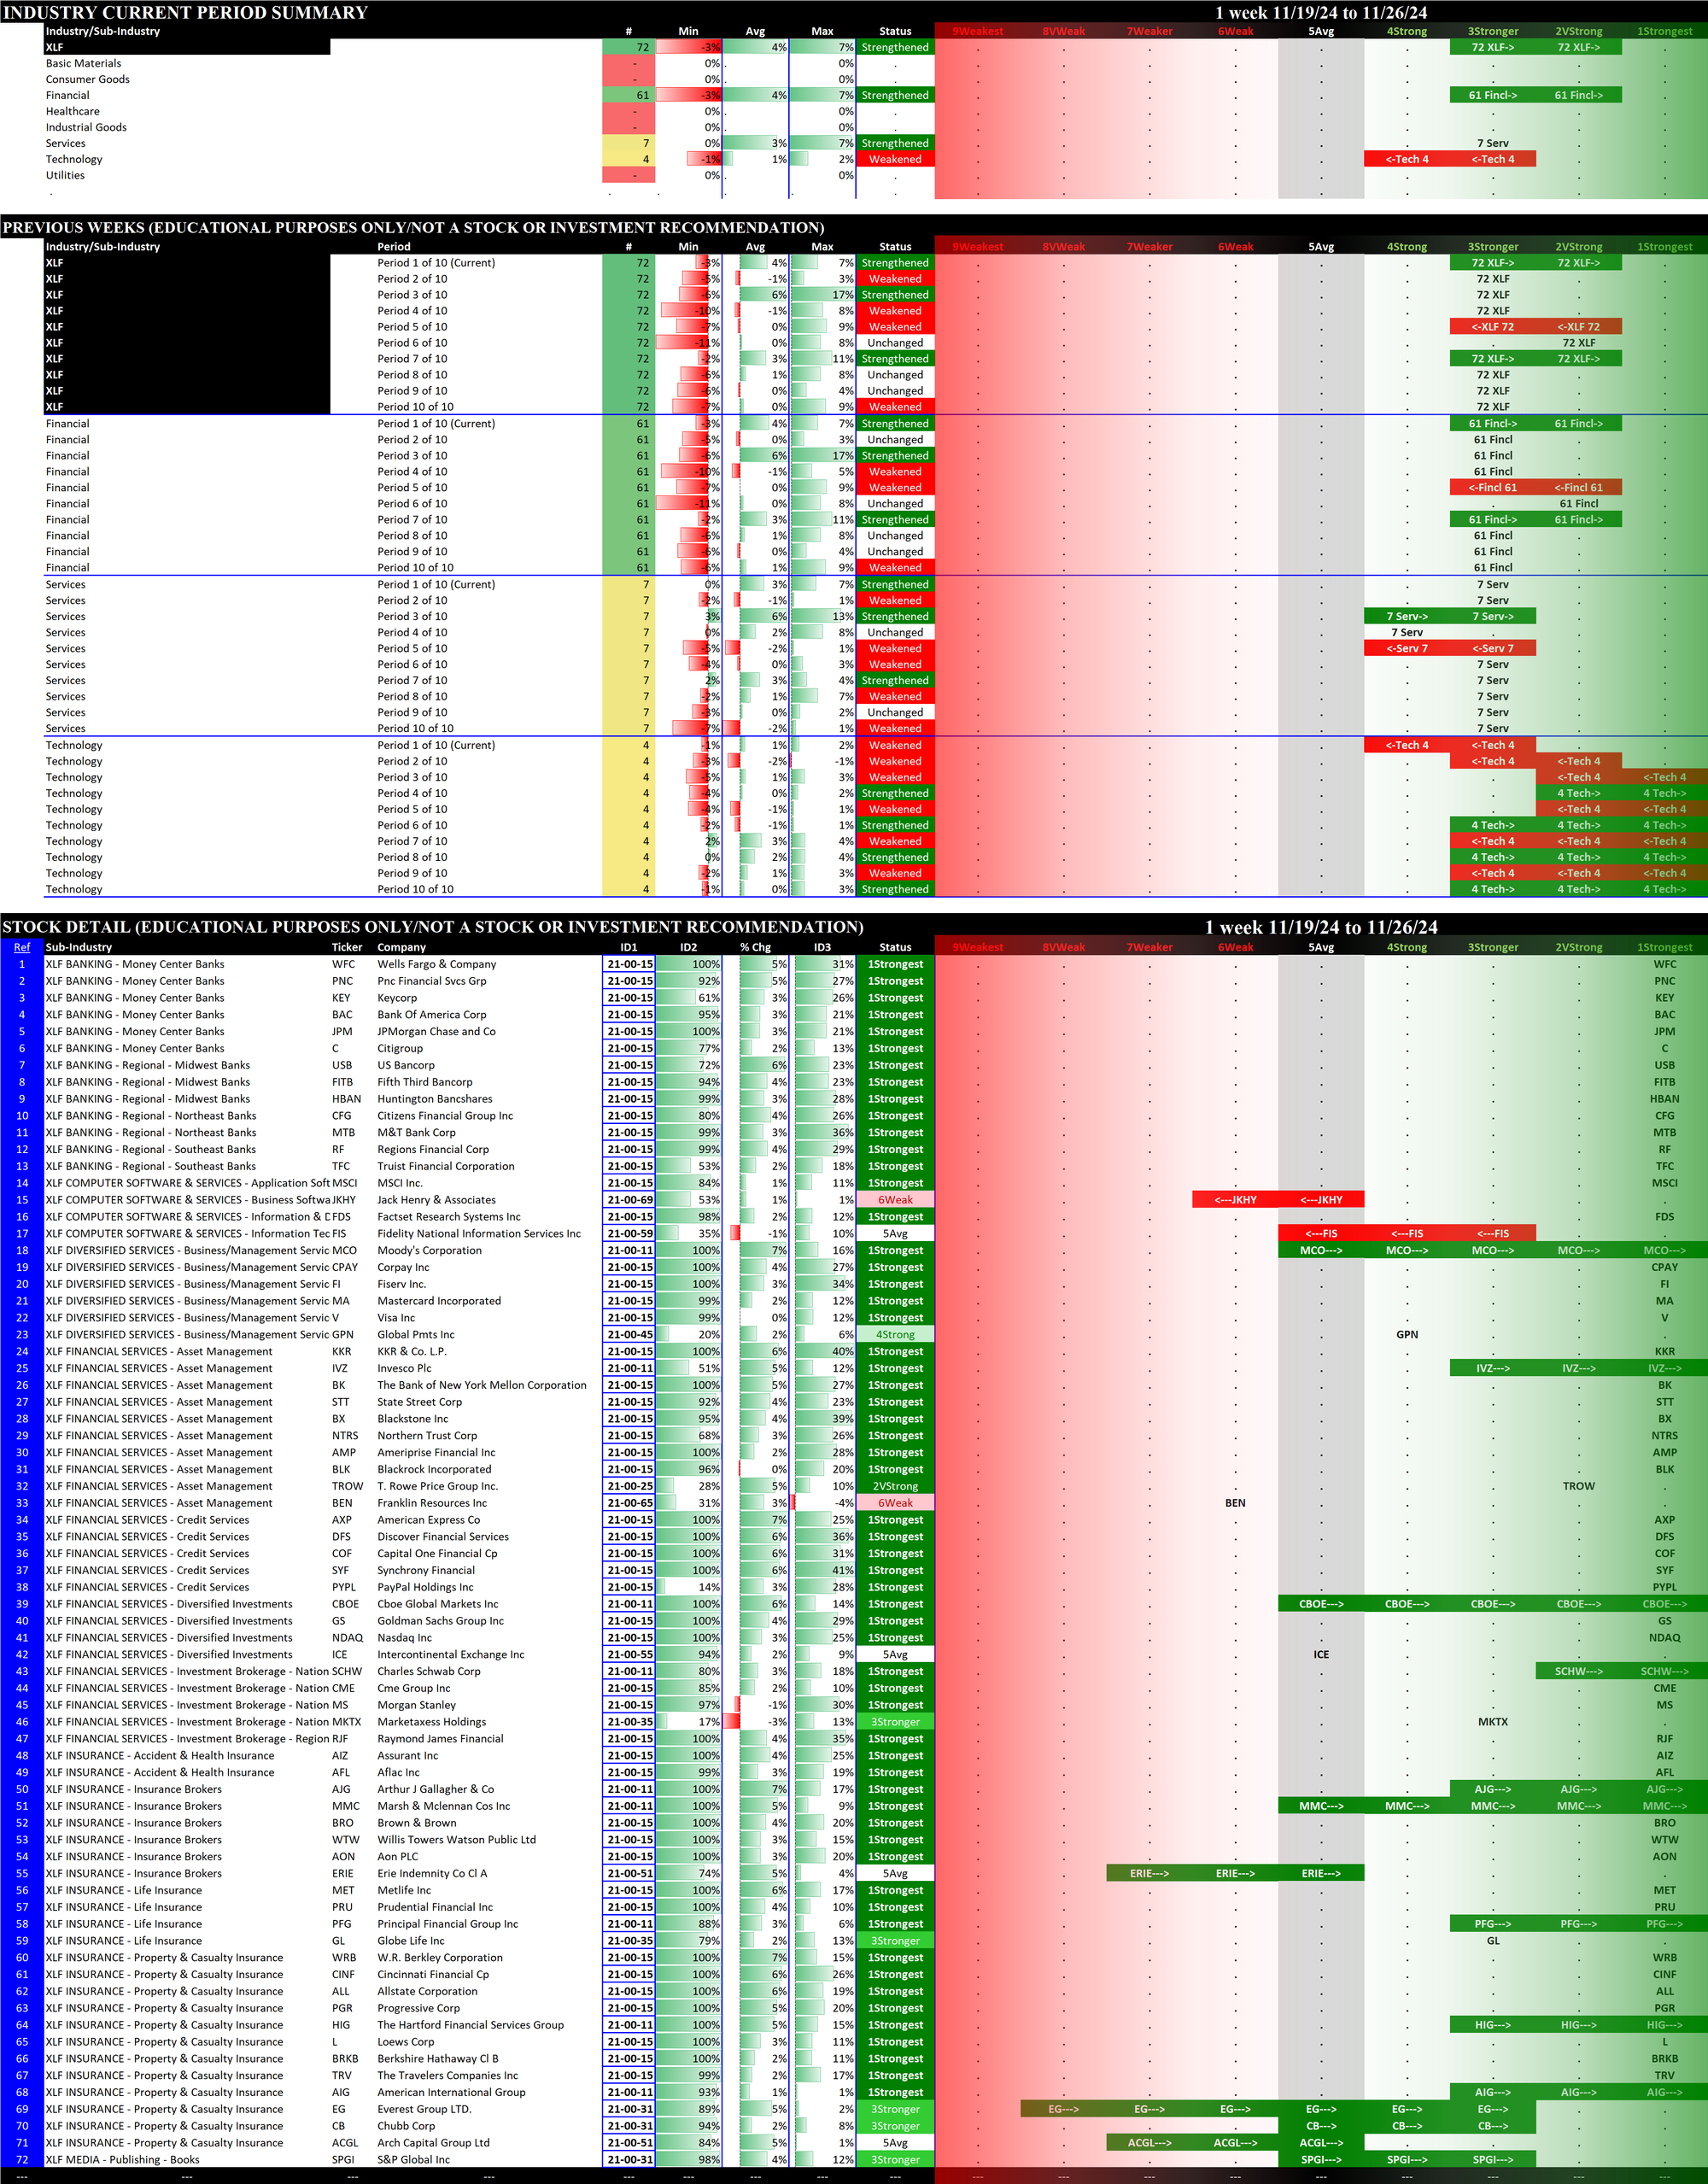
2.4 XLF Financial (72 stocks, large), STRENGTHENED RATING TO 2VStrong = BEST
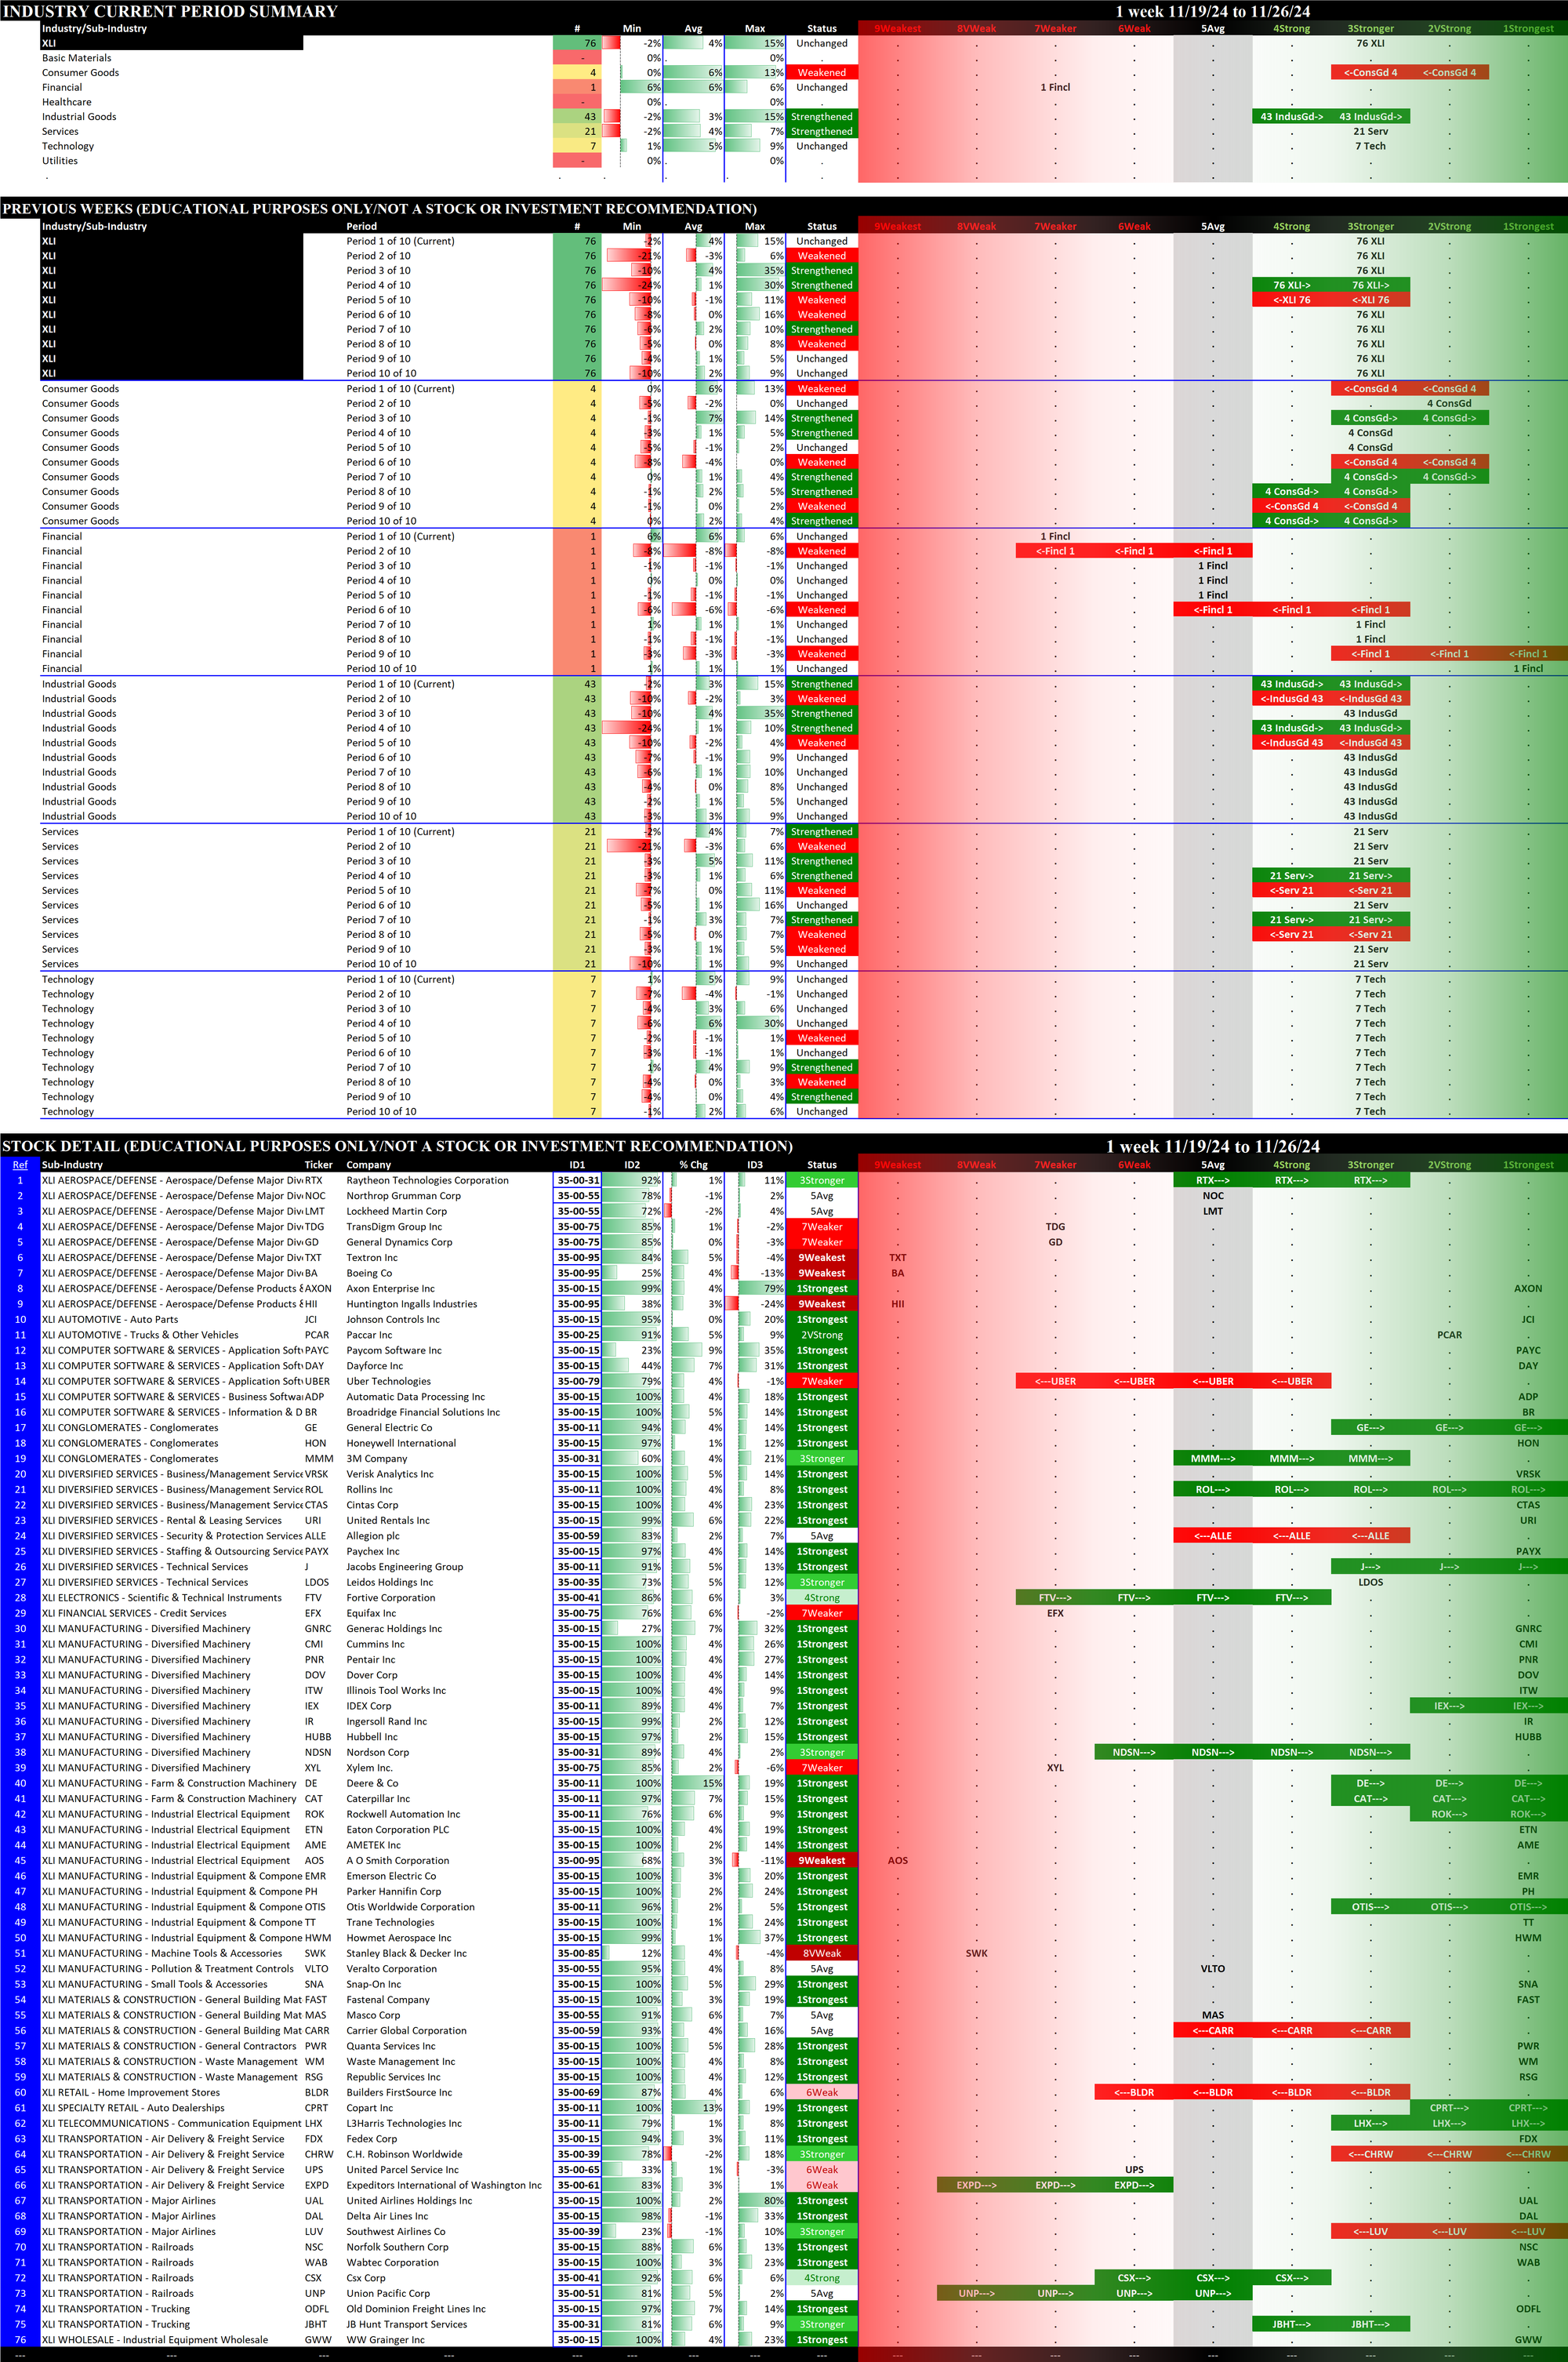
2.5 XLI Industrial (76 stocks, large), Unchanged at 3Stronger
2.6 XLK Technology (69 stocks, large), Strengthened at 4Strong
2.7 XLP Consumer Staples (38 stocks, mid-sized), STRENGTHENED RATING TO 5Avg = tied for WORST
2.8 XLRE Real Estate (31 stocks, small/mid-sized), Strengthened at 4Strong
2.9 XLU Utilities (31 stocks, small/mid-sized), Strengthened at 3Stronger
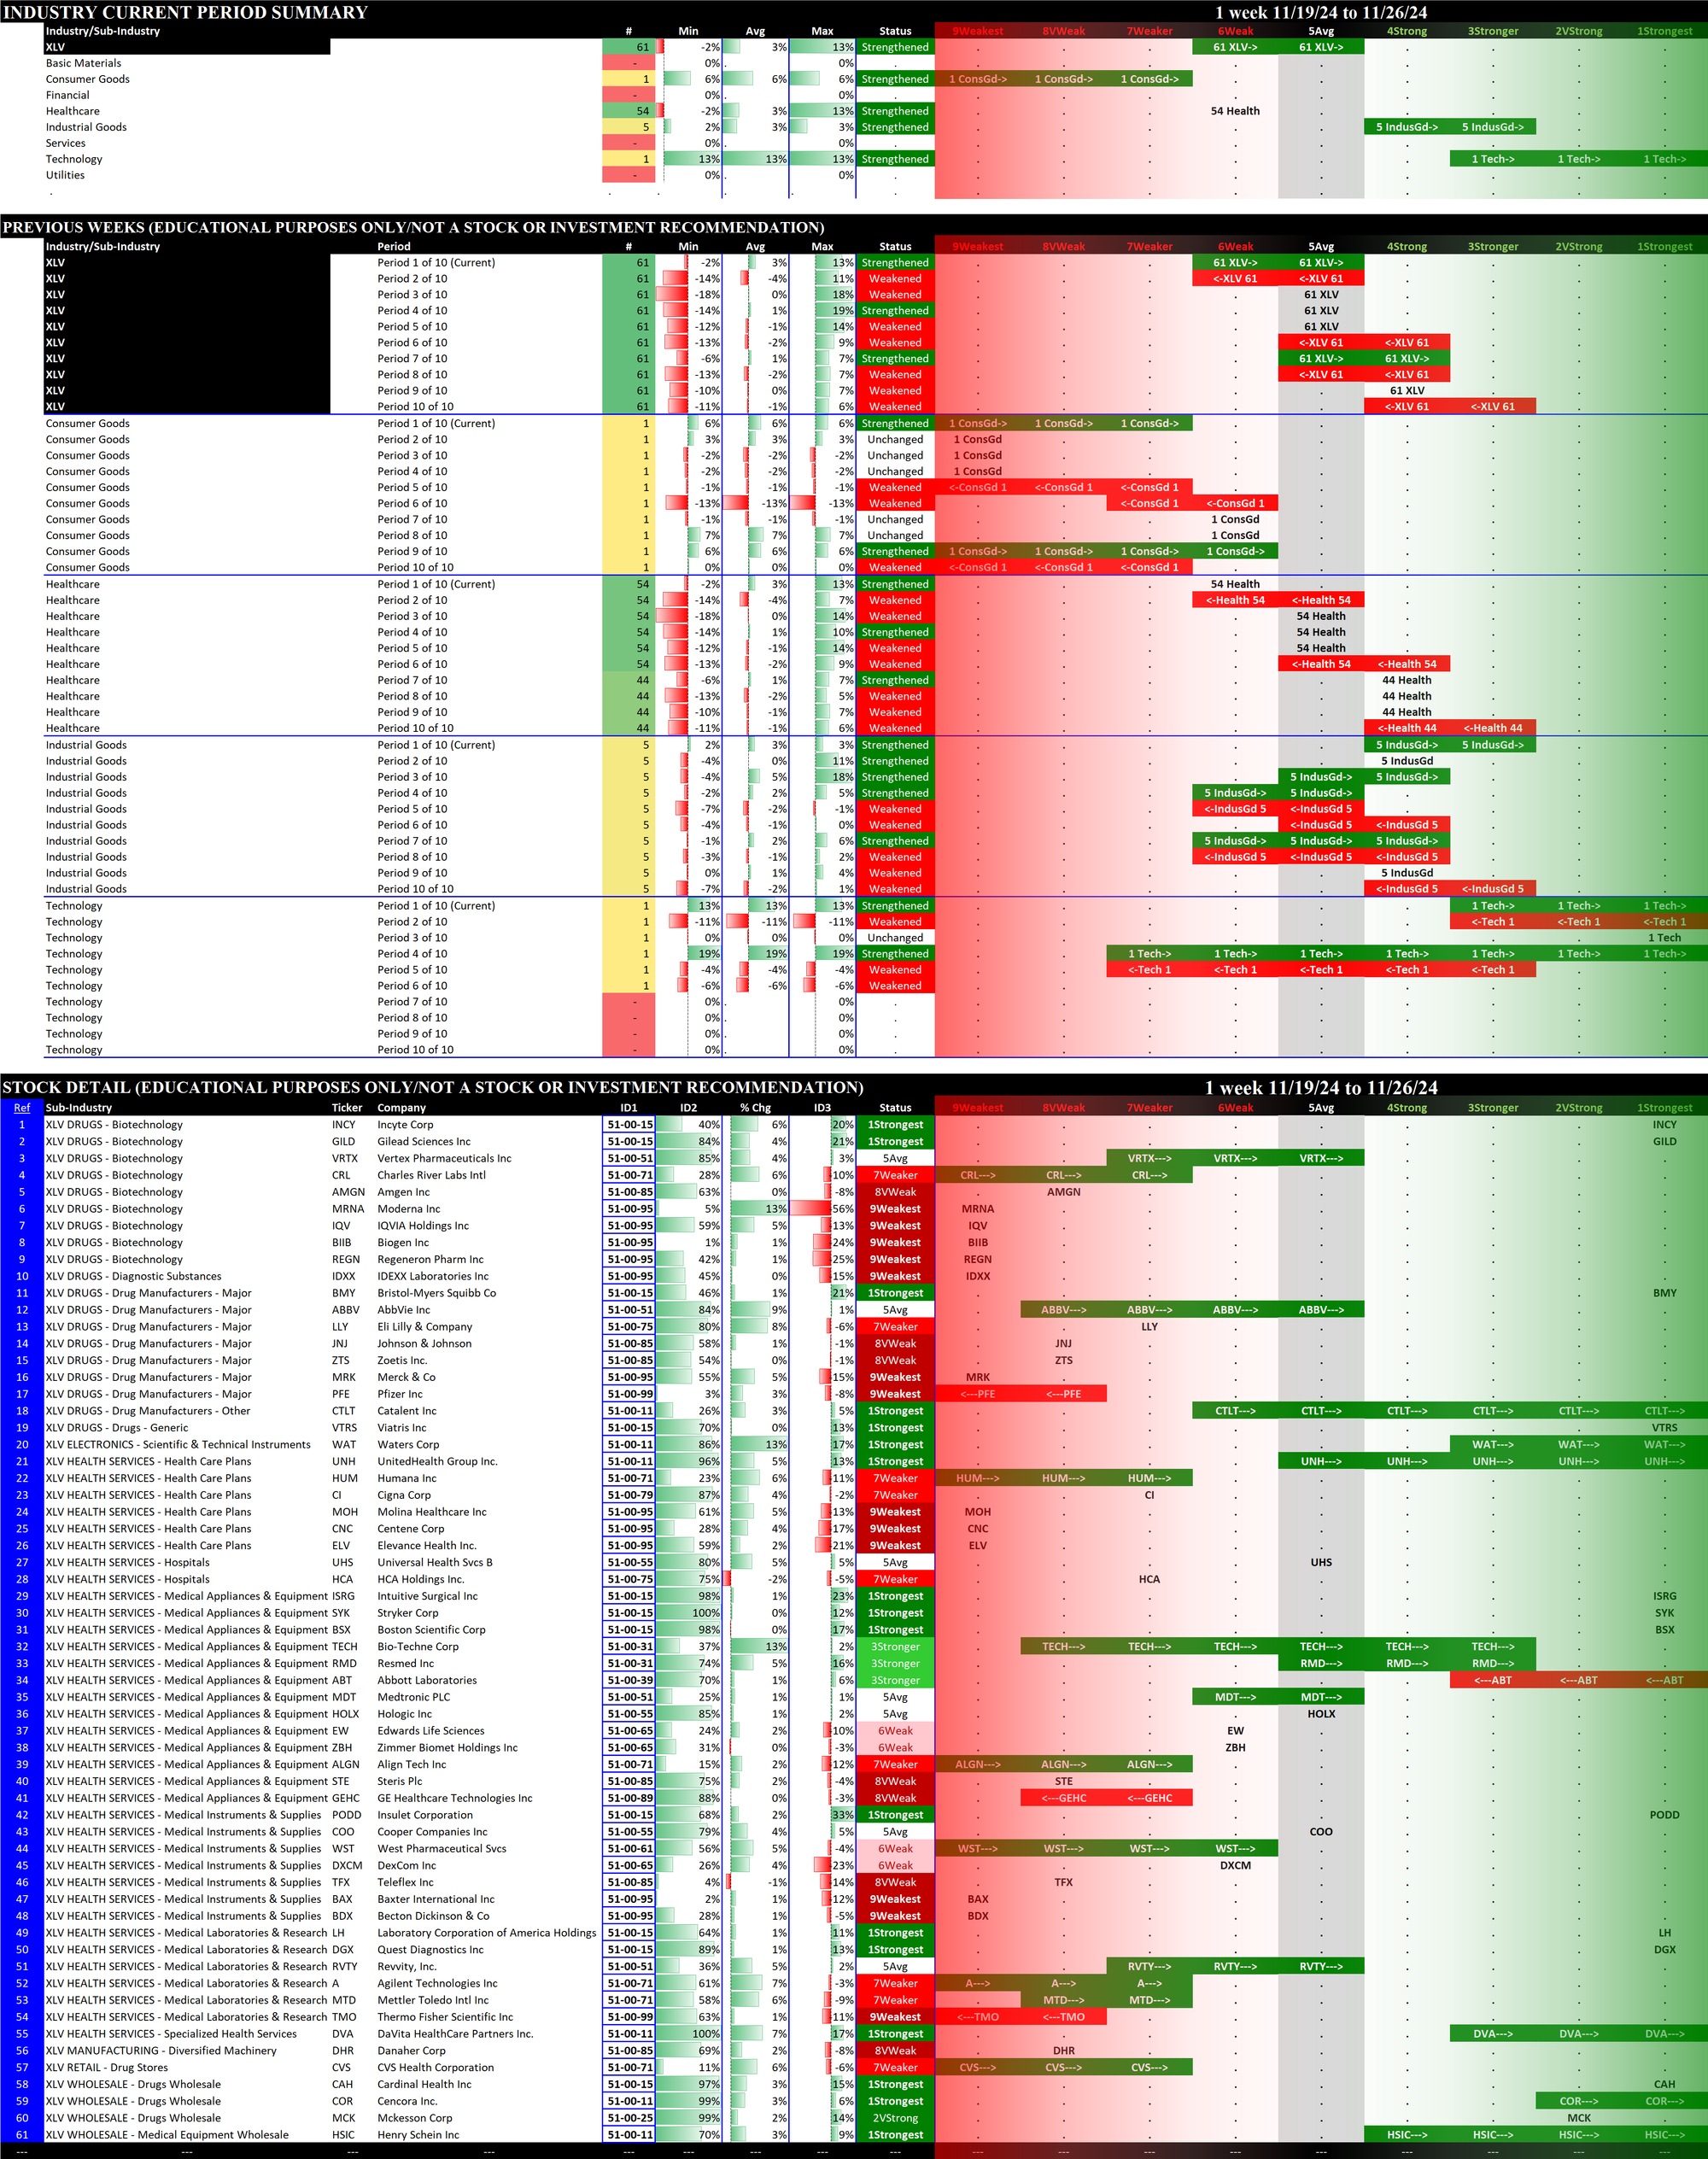
2.10 XLV Health Care (61 stocks, large), STRENGTHENED RATING TO 5Avg = tied for WORST
2.11 XLY Consumer Discretionary (51 stocks, mid-sized/large), Strengthened at 4Strong

3. Stock Detail
The downloadable PDF below lists all component stocks in order of first Strongest to Weakest ETF and second Strongest to Weakest Stock. The difference between this report and the 11 ETF stock listings above is this report consolidates all component stocks whereas the above listings are segregated by ETF.
Download the following Excel file if you are interested in sorting results yourself.