SMO Exclusive: SPDR Sector ETFs Strength Report Tuesday 2024-11-19 Weakened -0.1 to 4.0 Strength Score
Background
This analysis consists of the Stock Market Organizer stock-by-stock strength analysis applied to the 500 stocks that comprise the 11 SPDR Select ETFs.
These results are combined with overall market environment readings (via the Market Strength Score and the Sector Risk Gauge) to discern appropriate portfolio exposure given prevailing market and sector conditions.
Average, Minimum, and Maximum Returns
The returns for the underlying stocks in each ETF are shown below.
Only three ETFs had positive average returns:
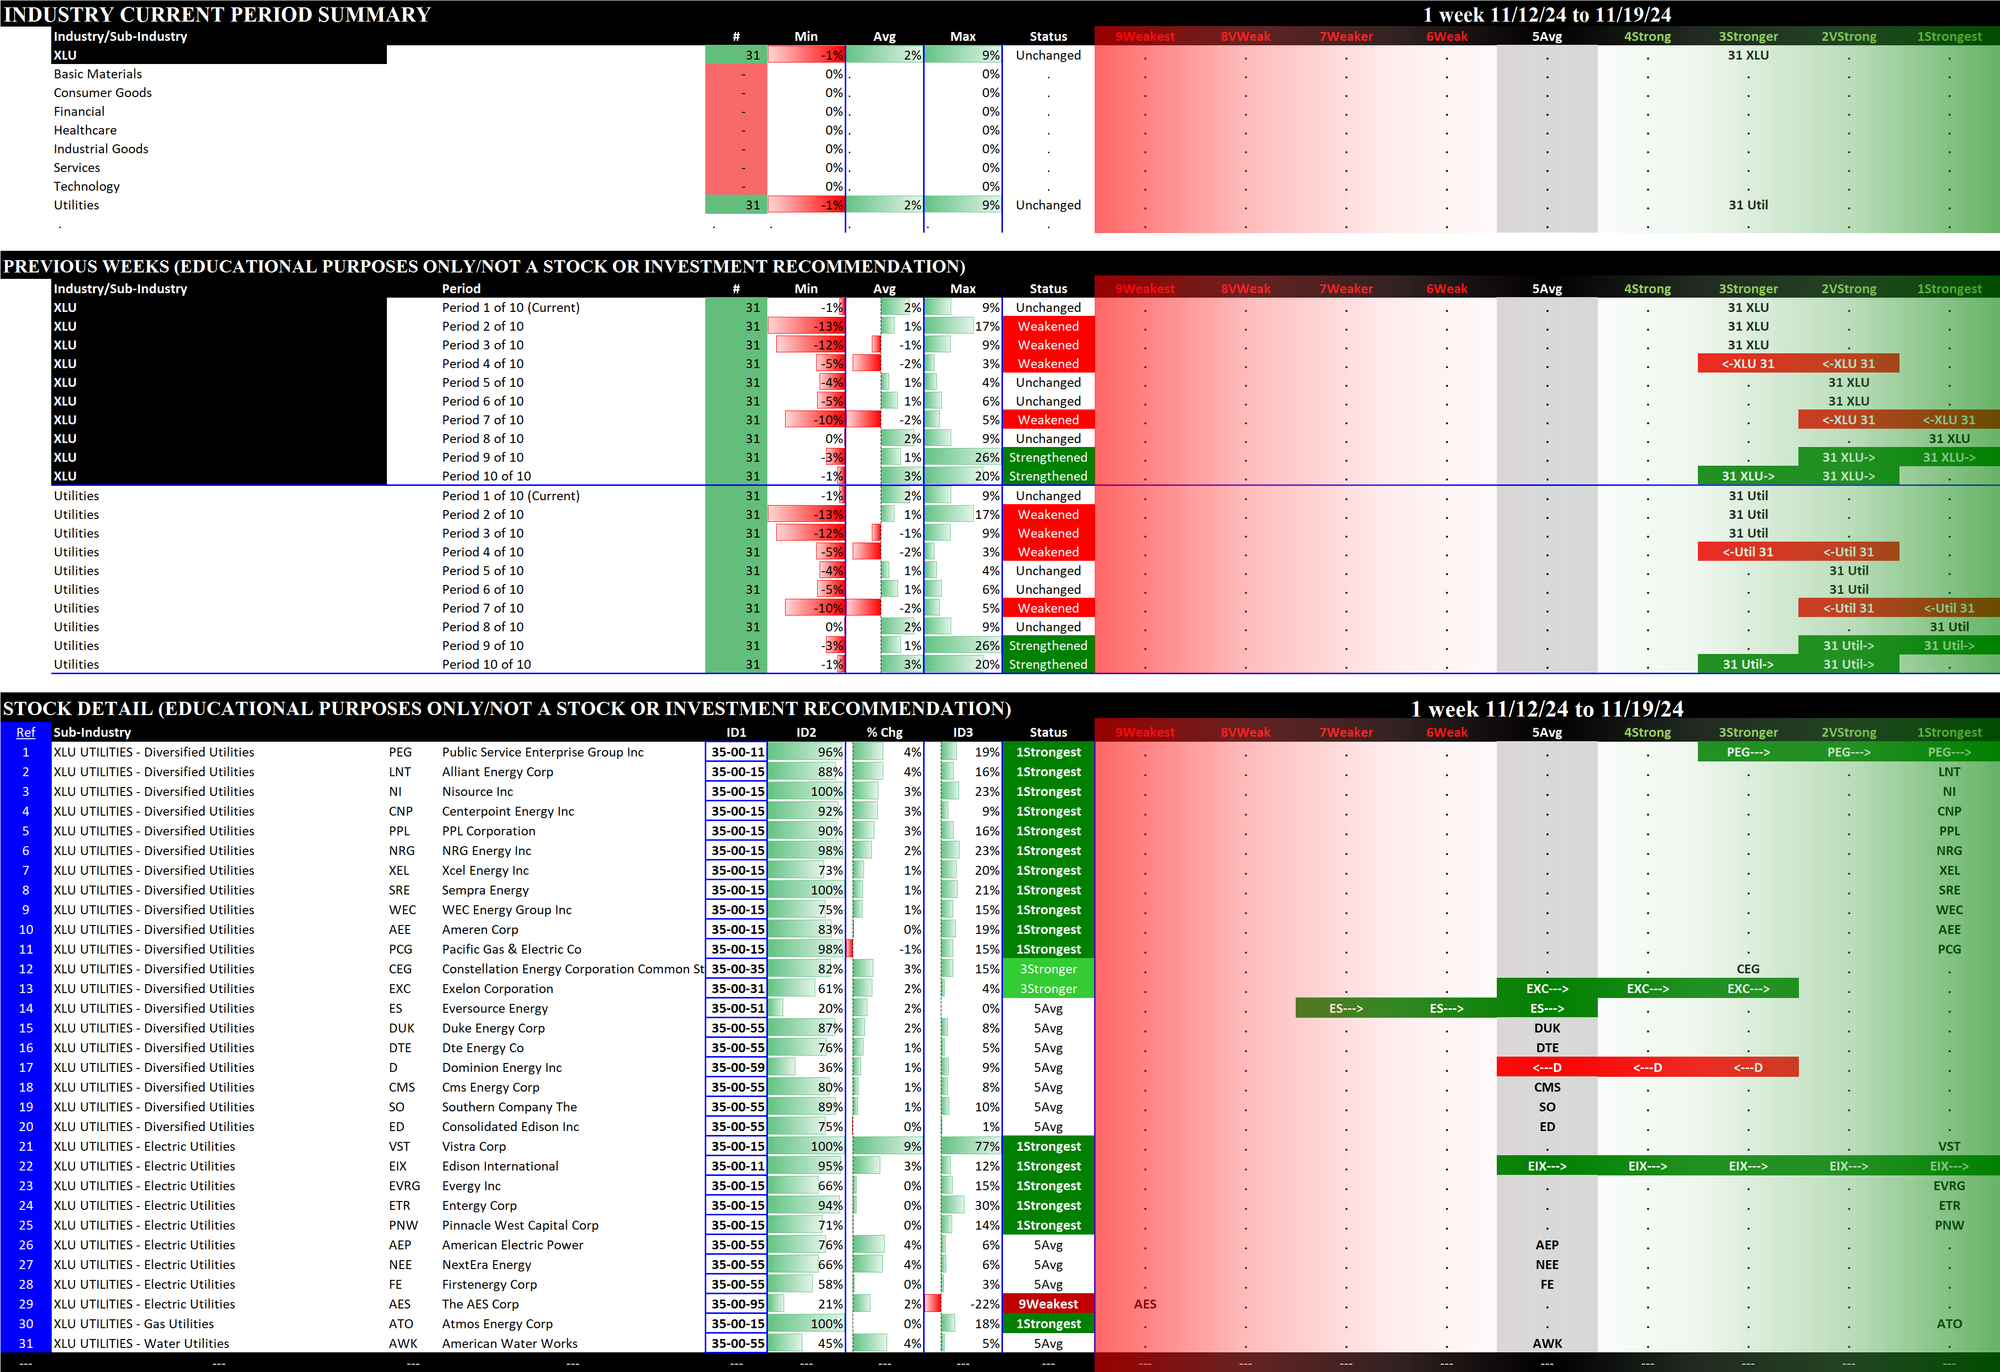
- XLU/Utilities, +2.0% for its 31 stocks - note the not-unexpected narrow range between the minimum and maximum returns this week
- XLE/Energy, +1.6% for its 22 stocks
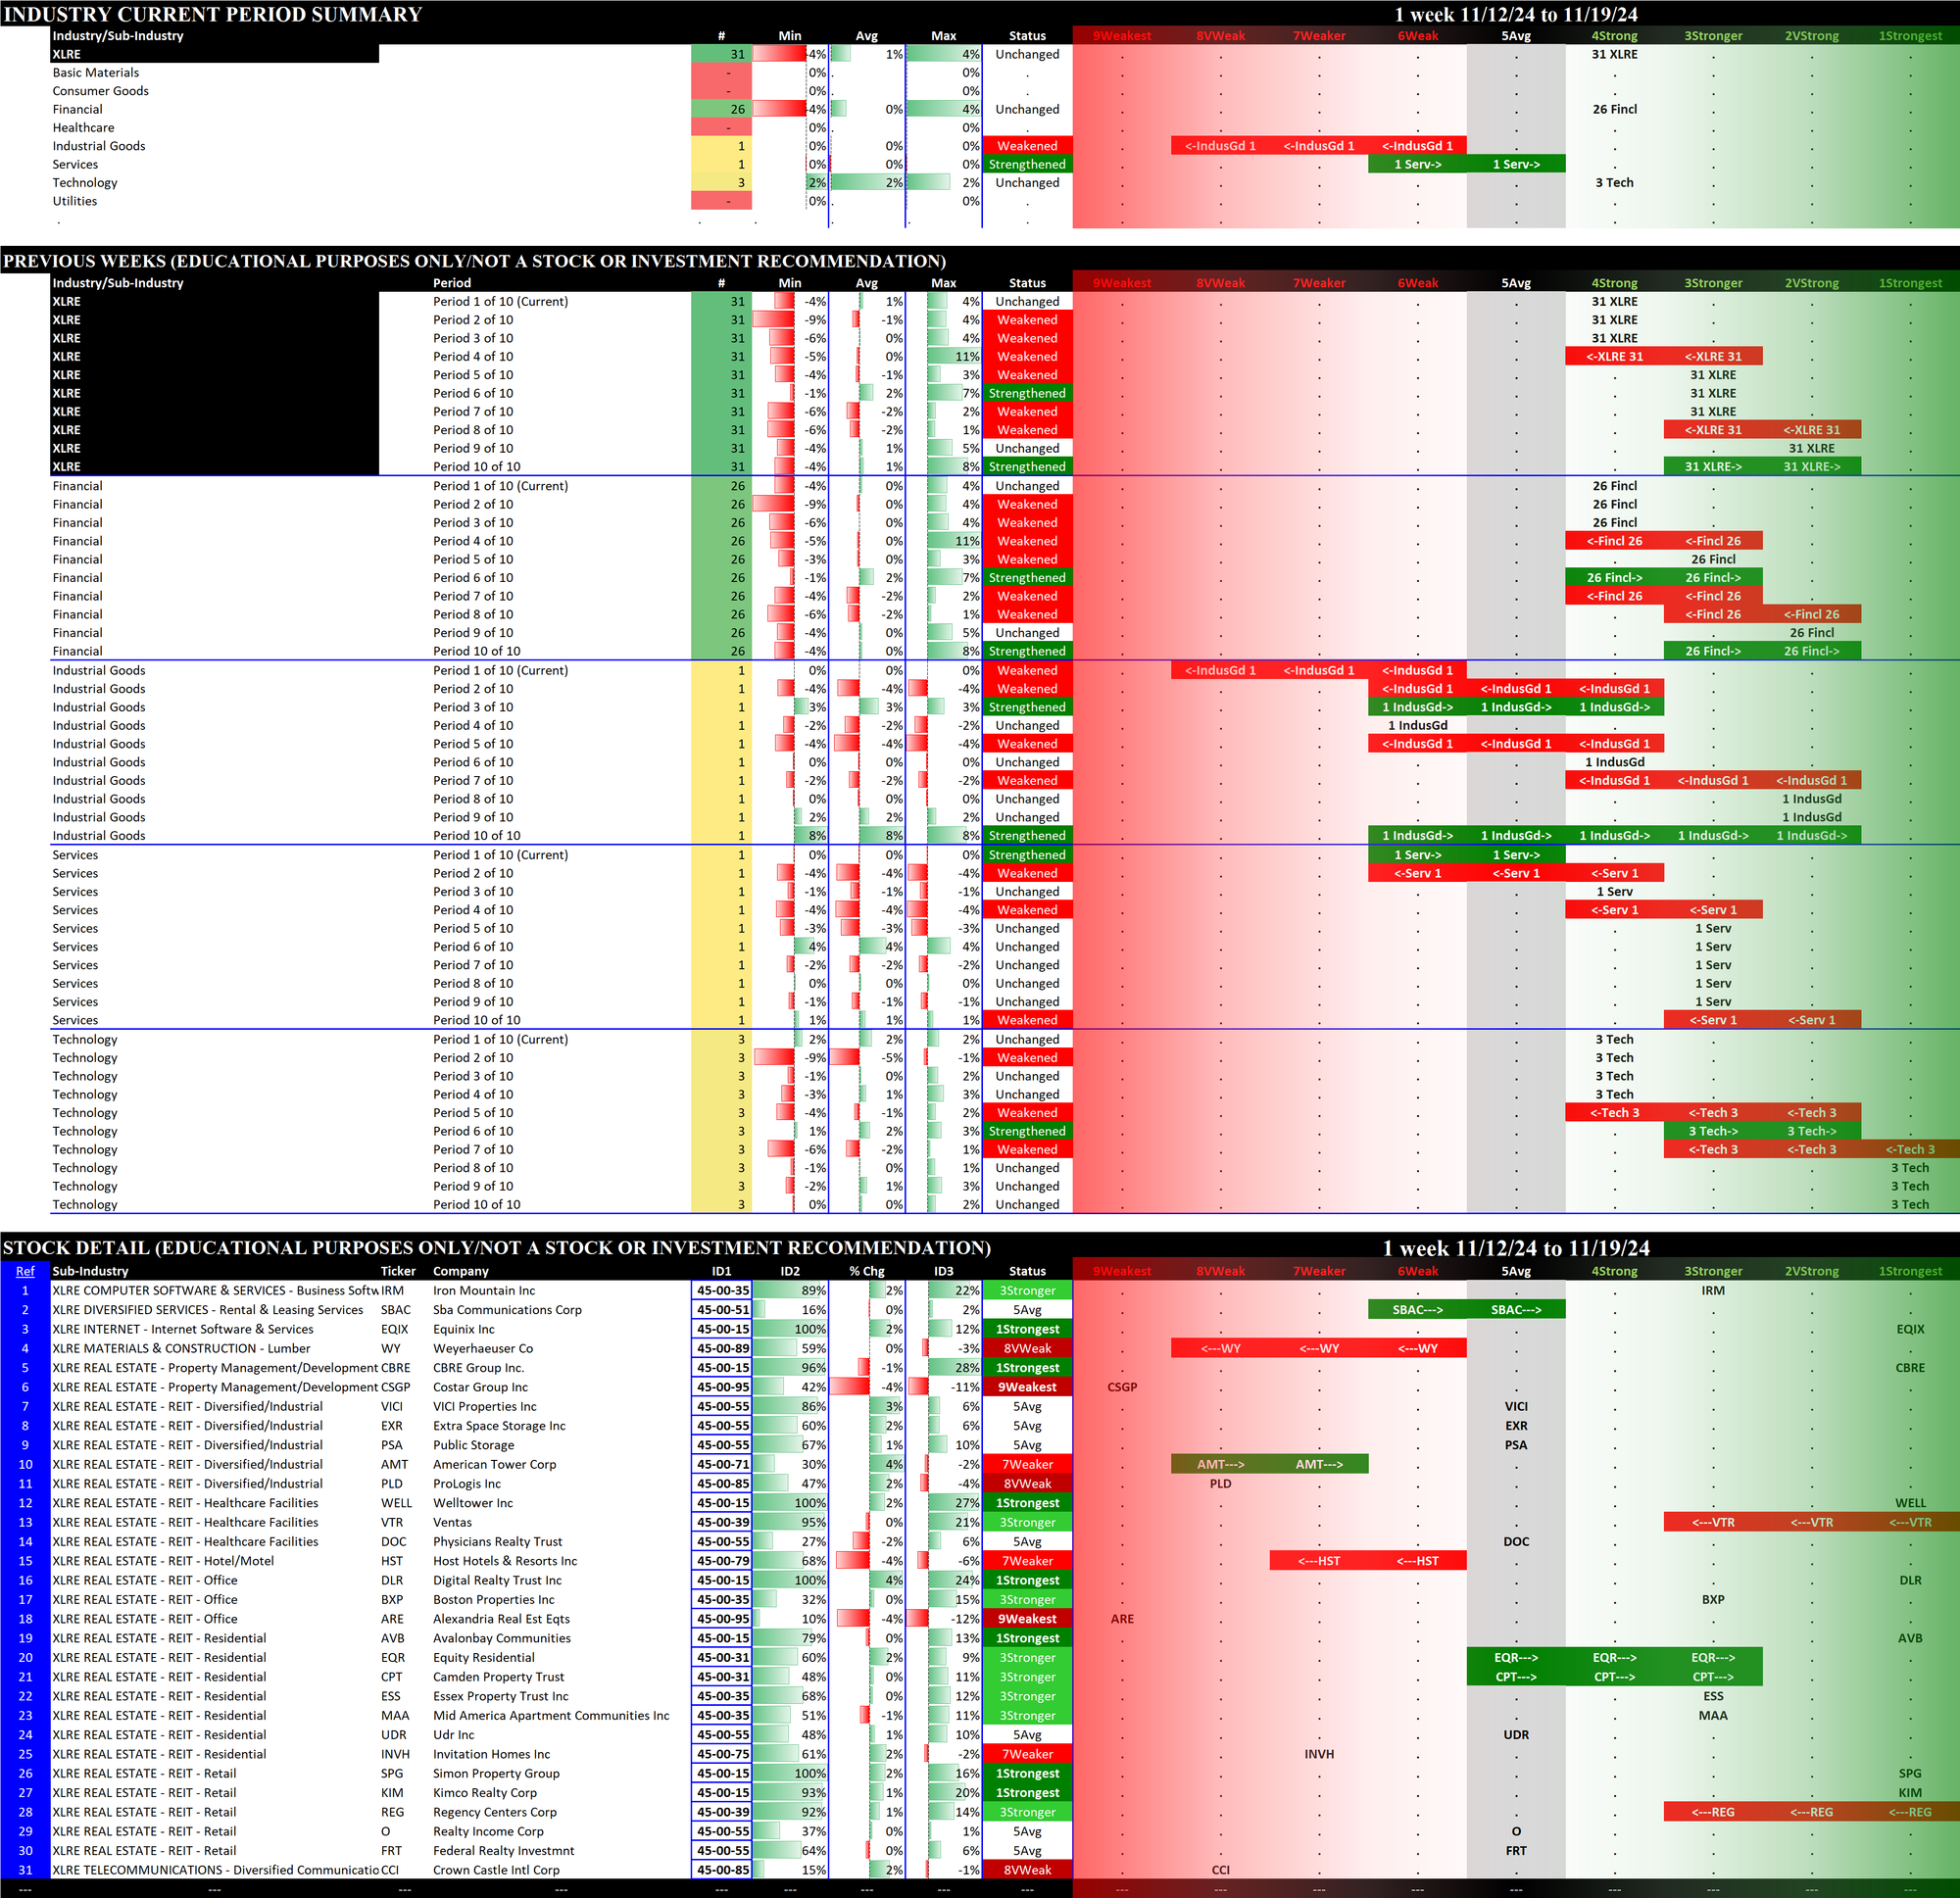
- XLRE/Real Estate, +0.5 for its 31 stocks
The worst performers:
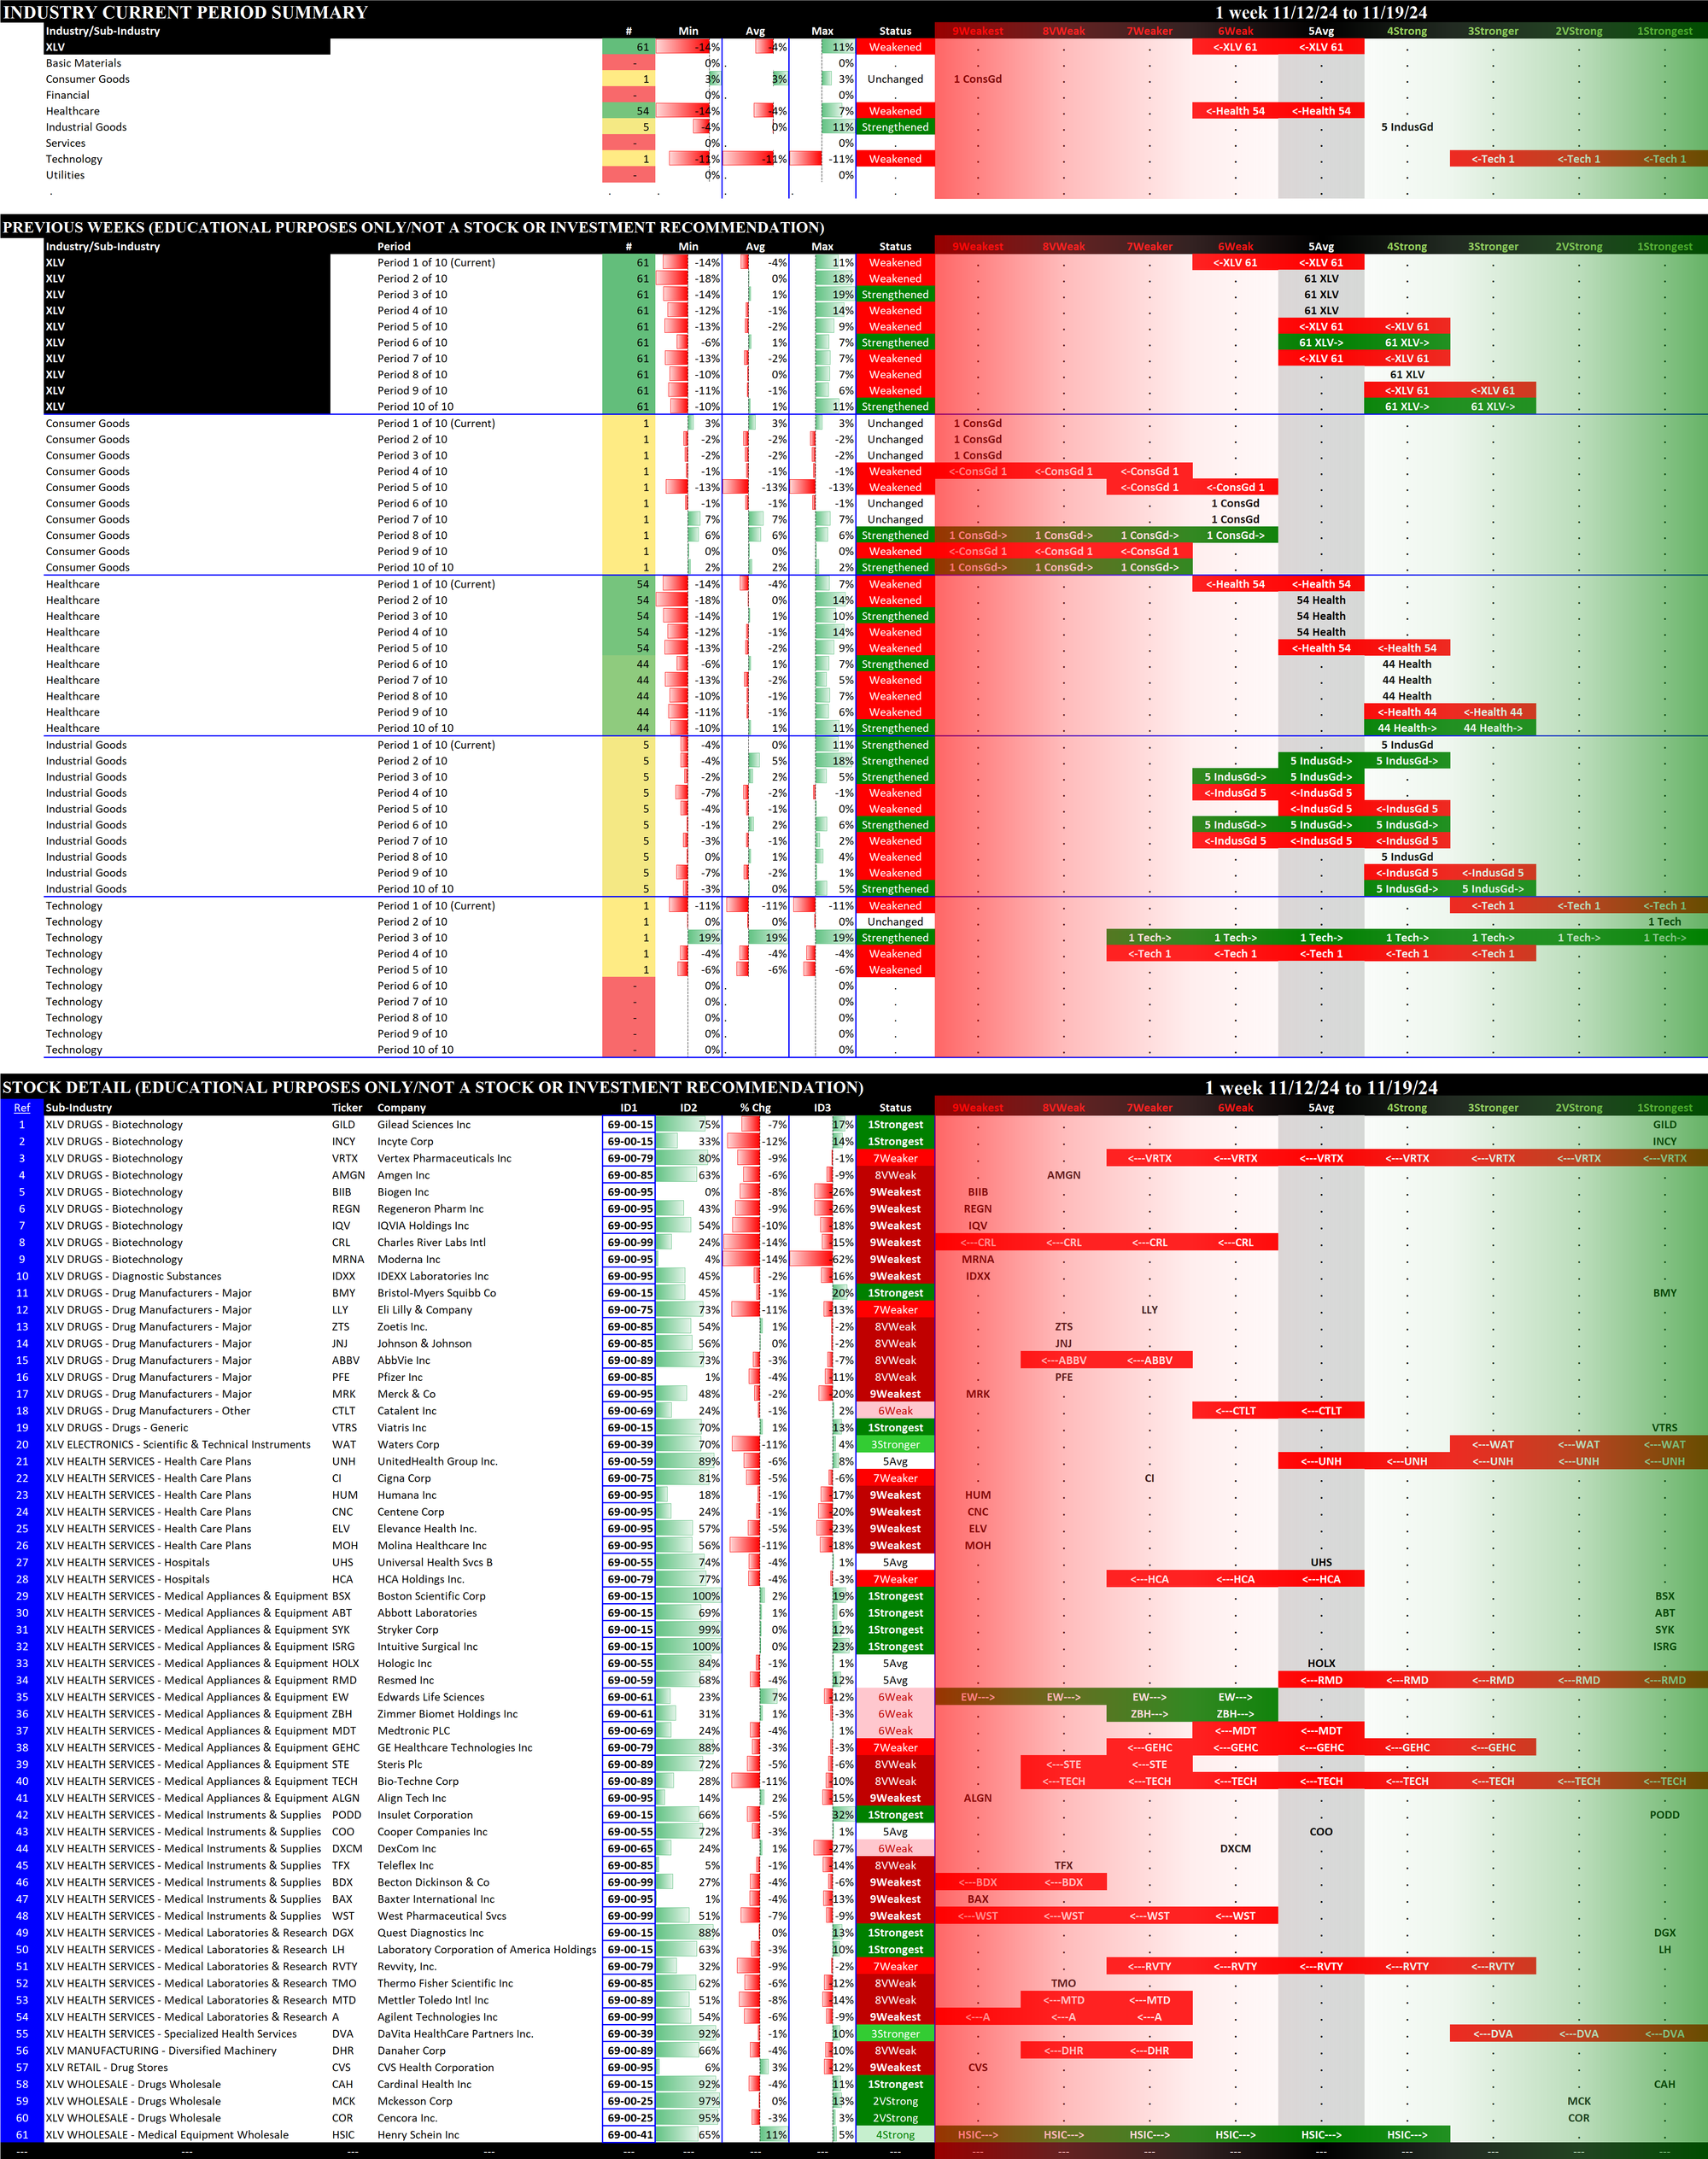
- XLV/Health Care, -3.7% average for 61 stocks
- XLK/Technology, -2.6% average for 69 stocks
- XLI/Industrial, -2.5% average for 76 stocks
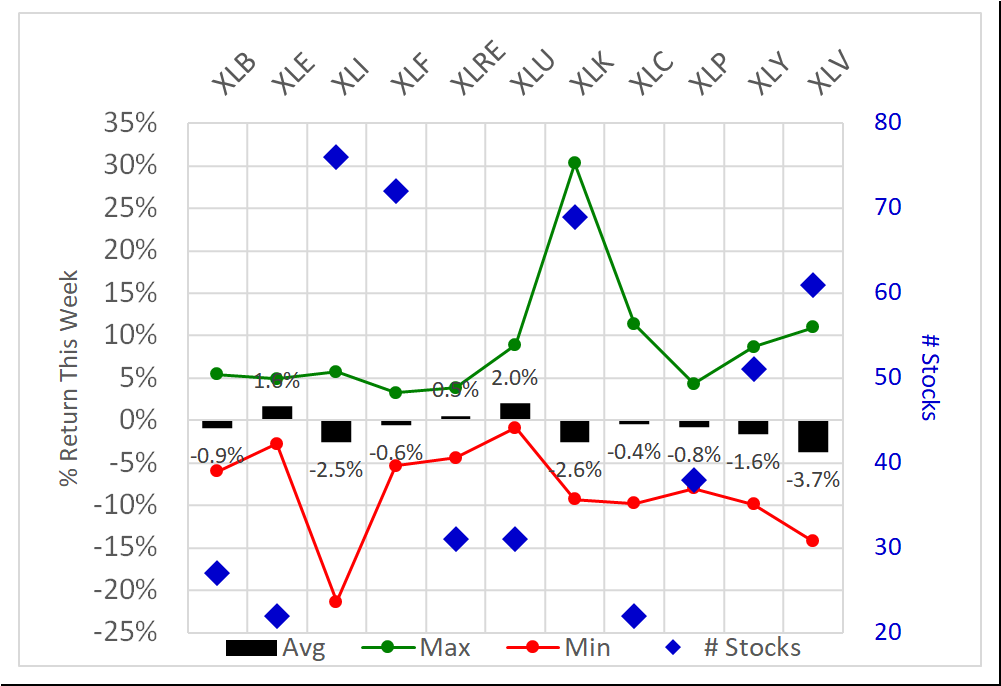
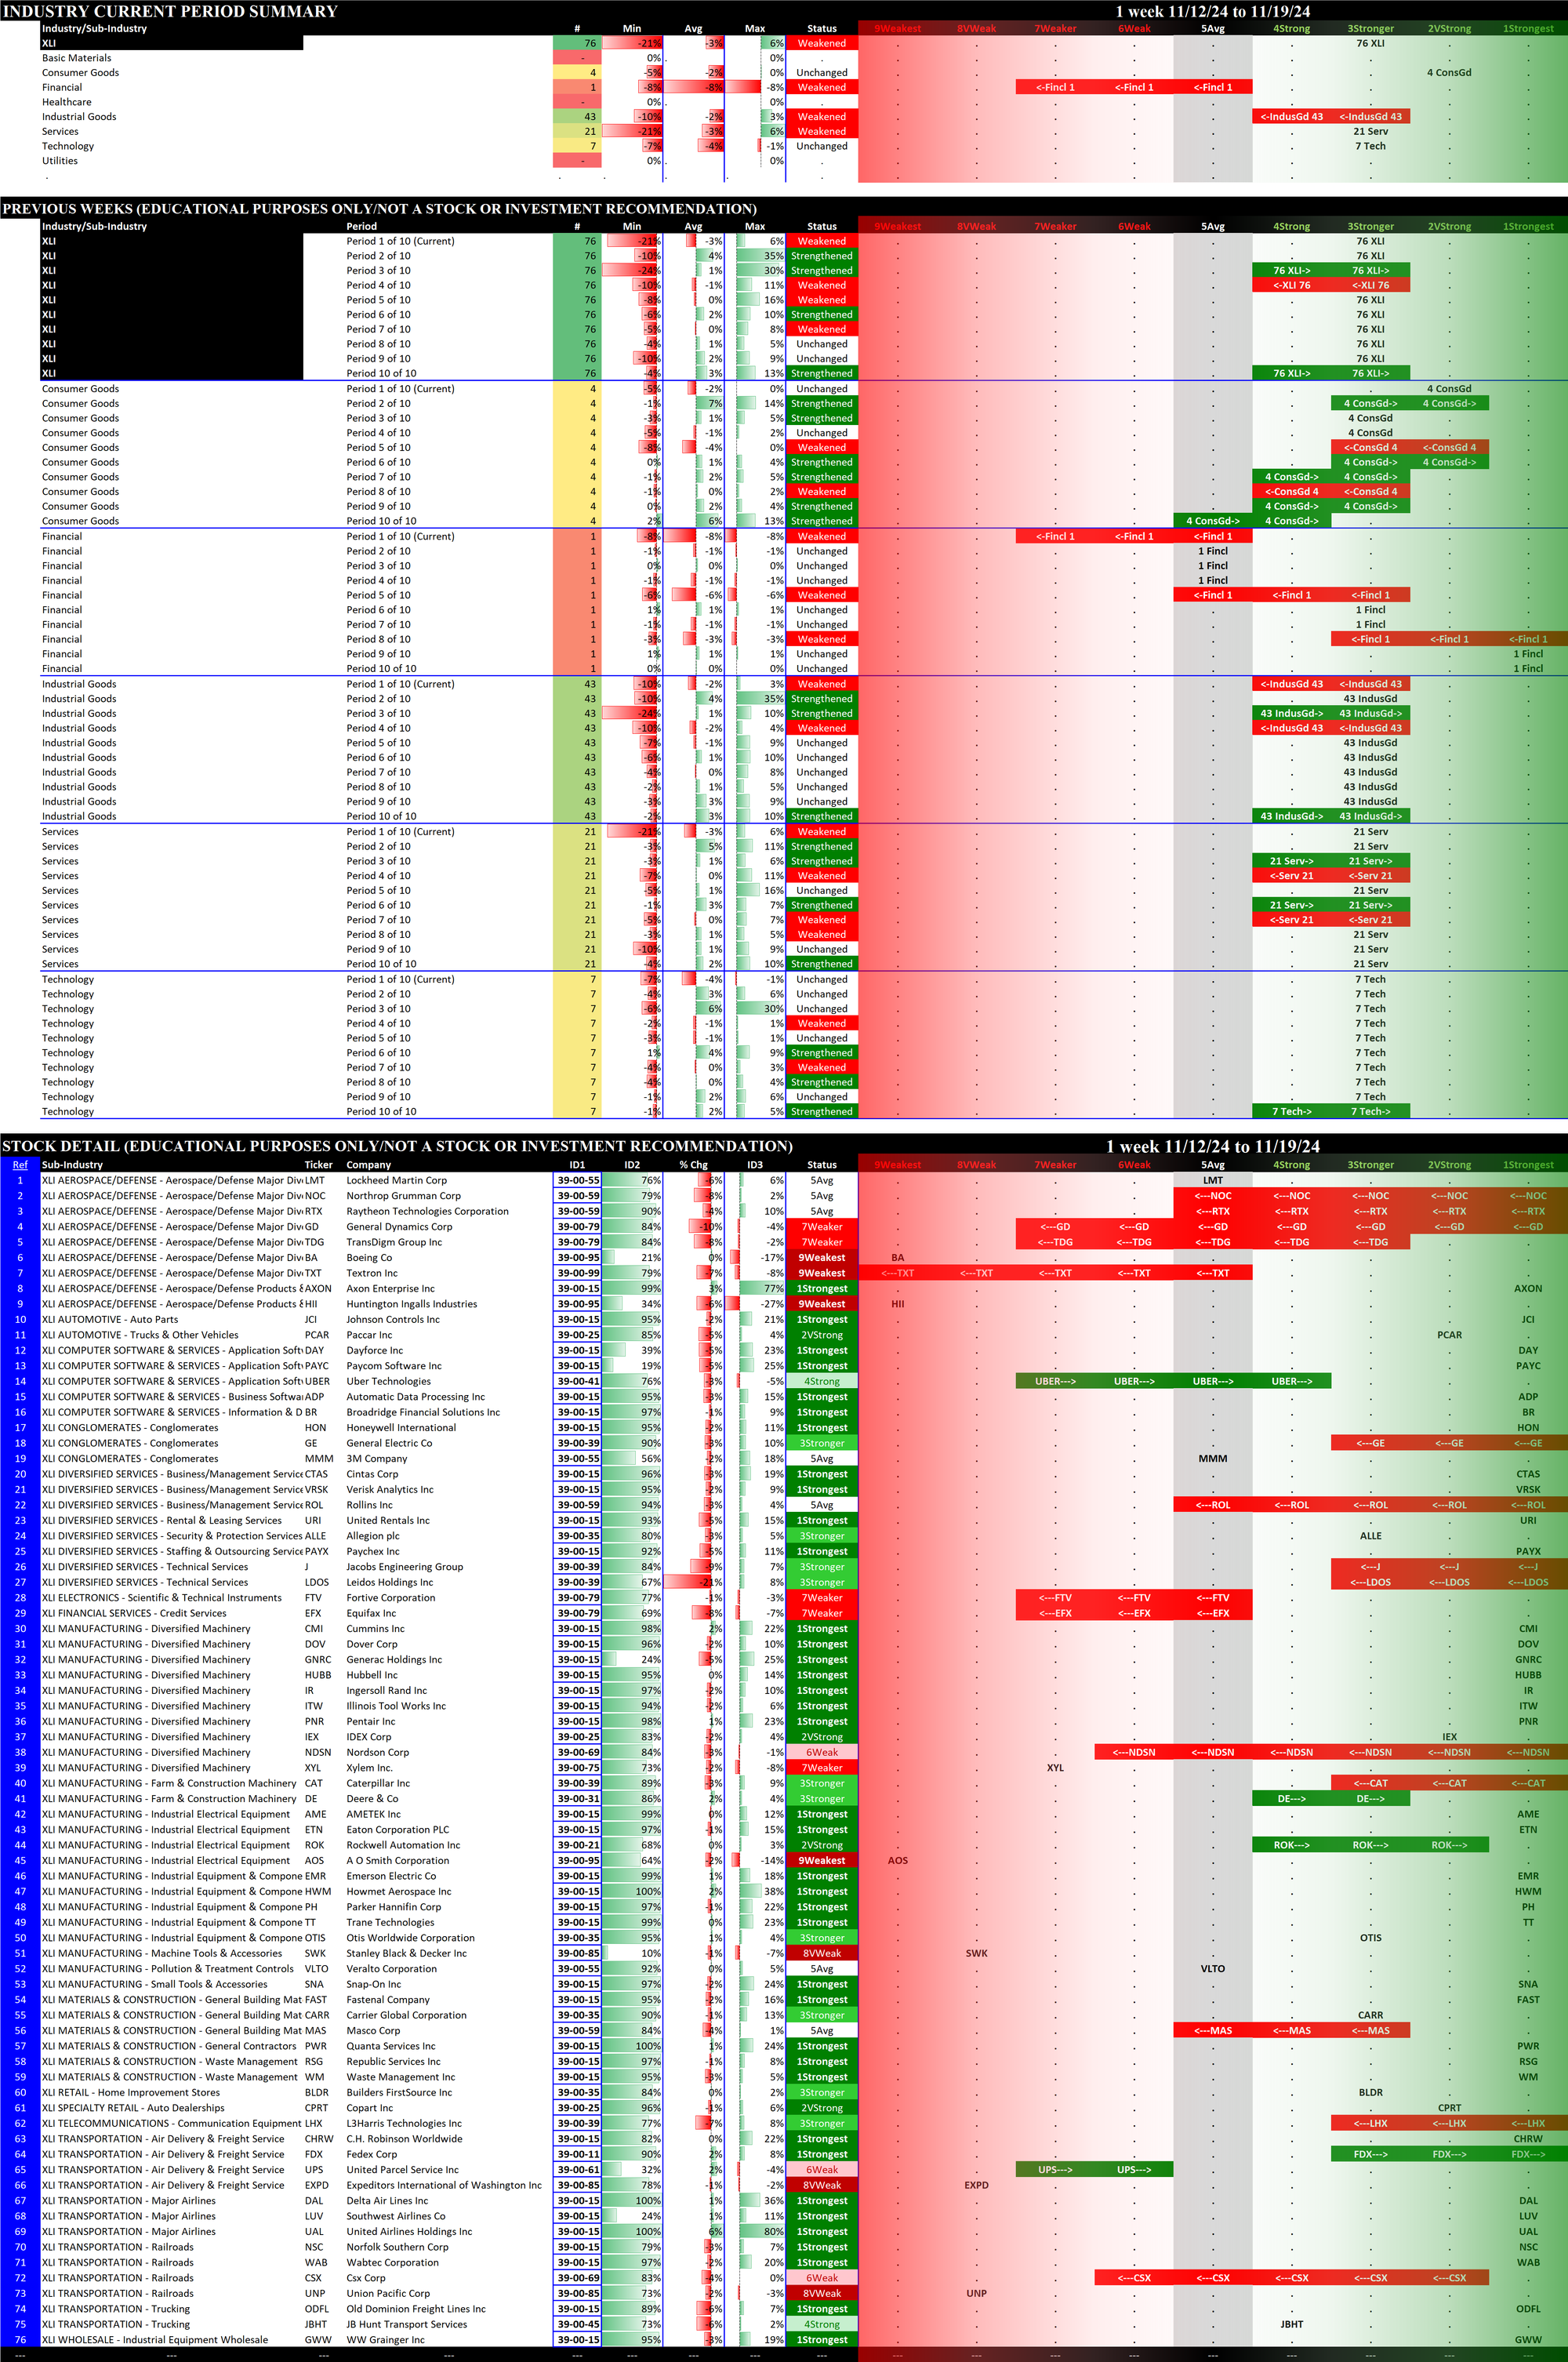
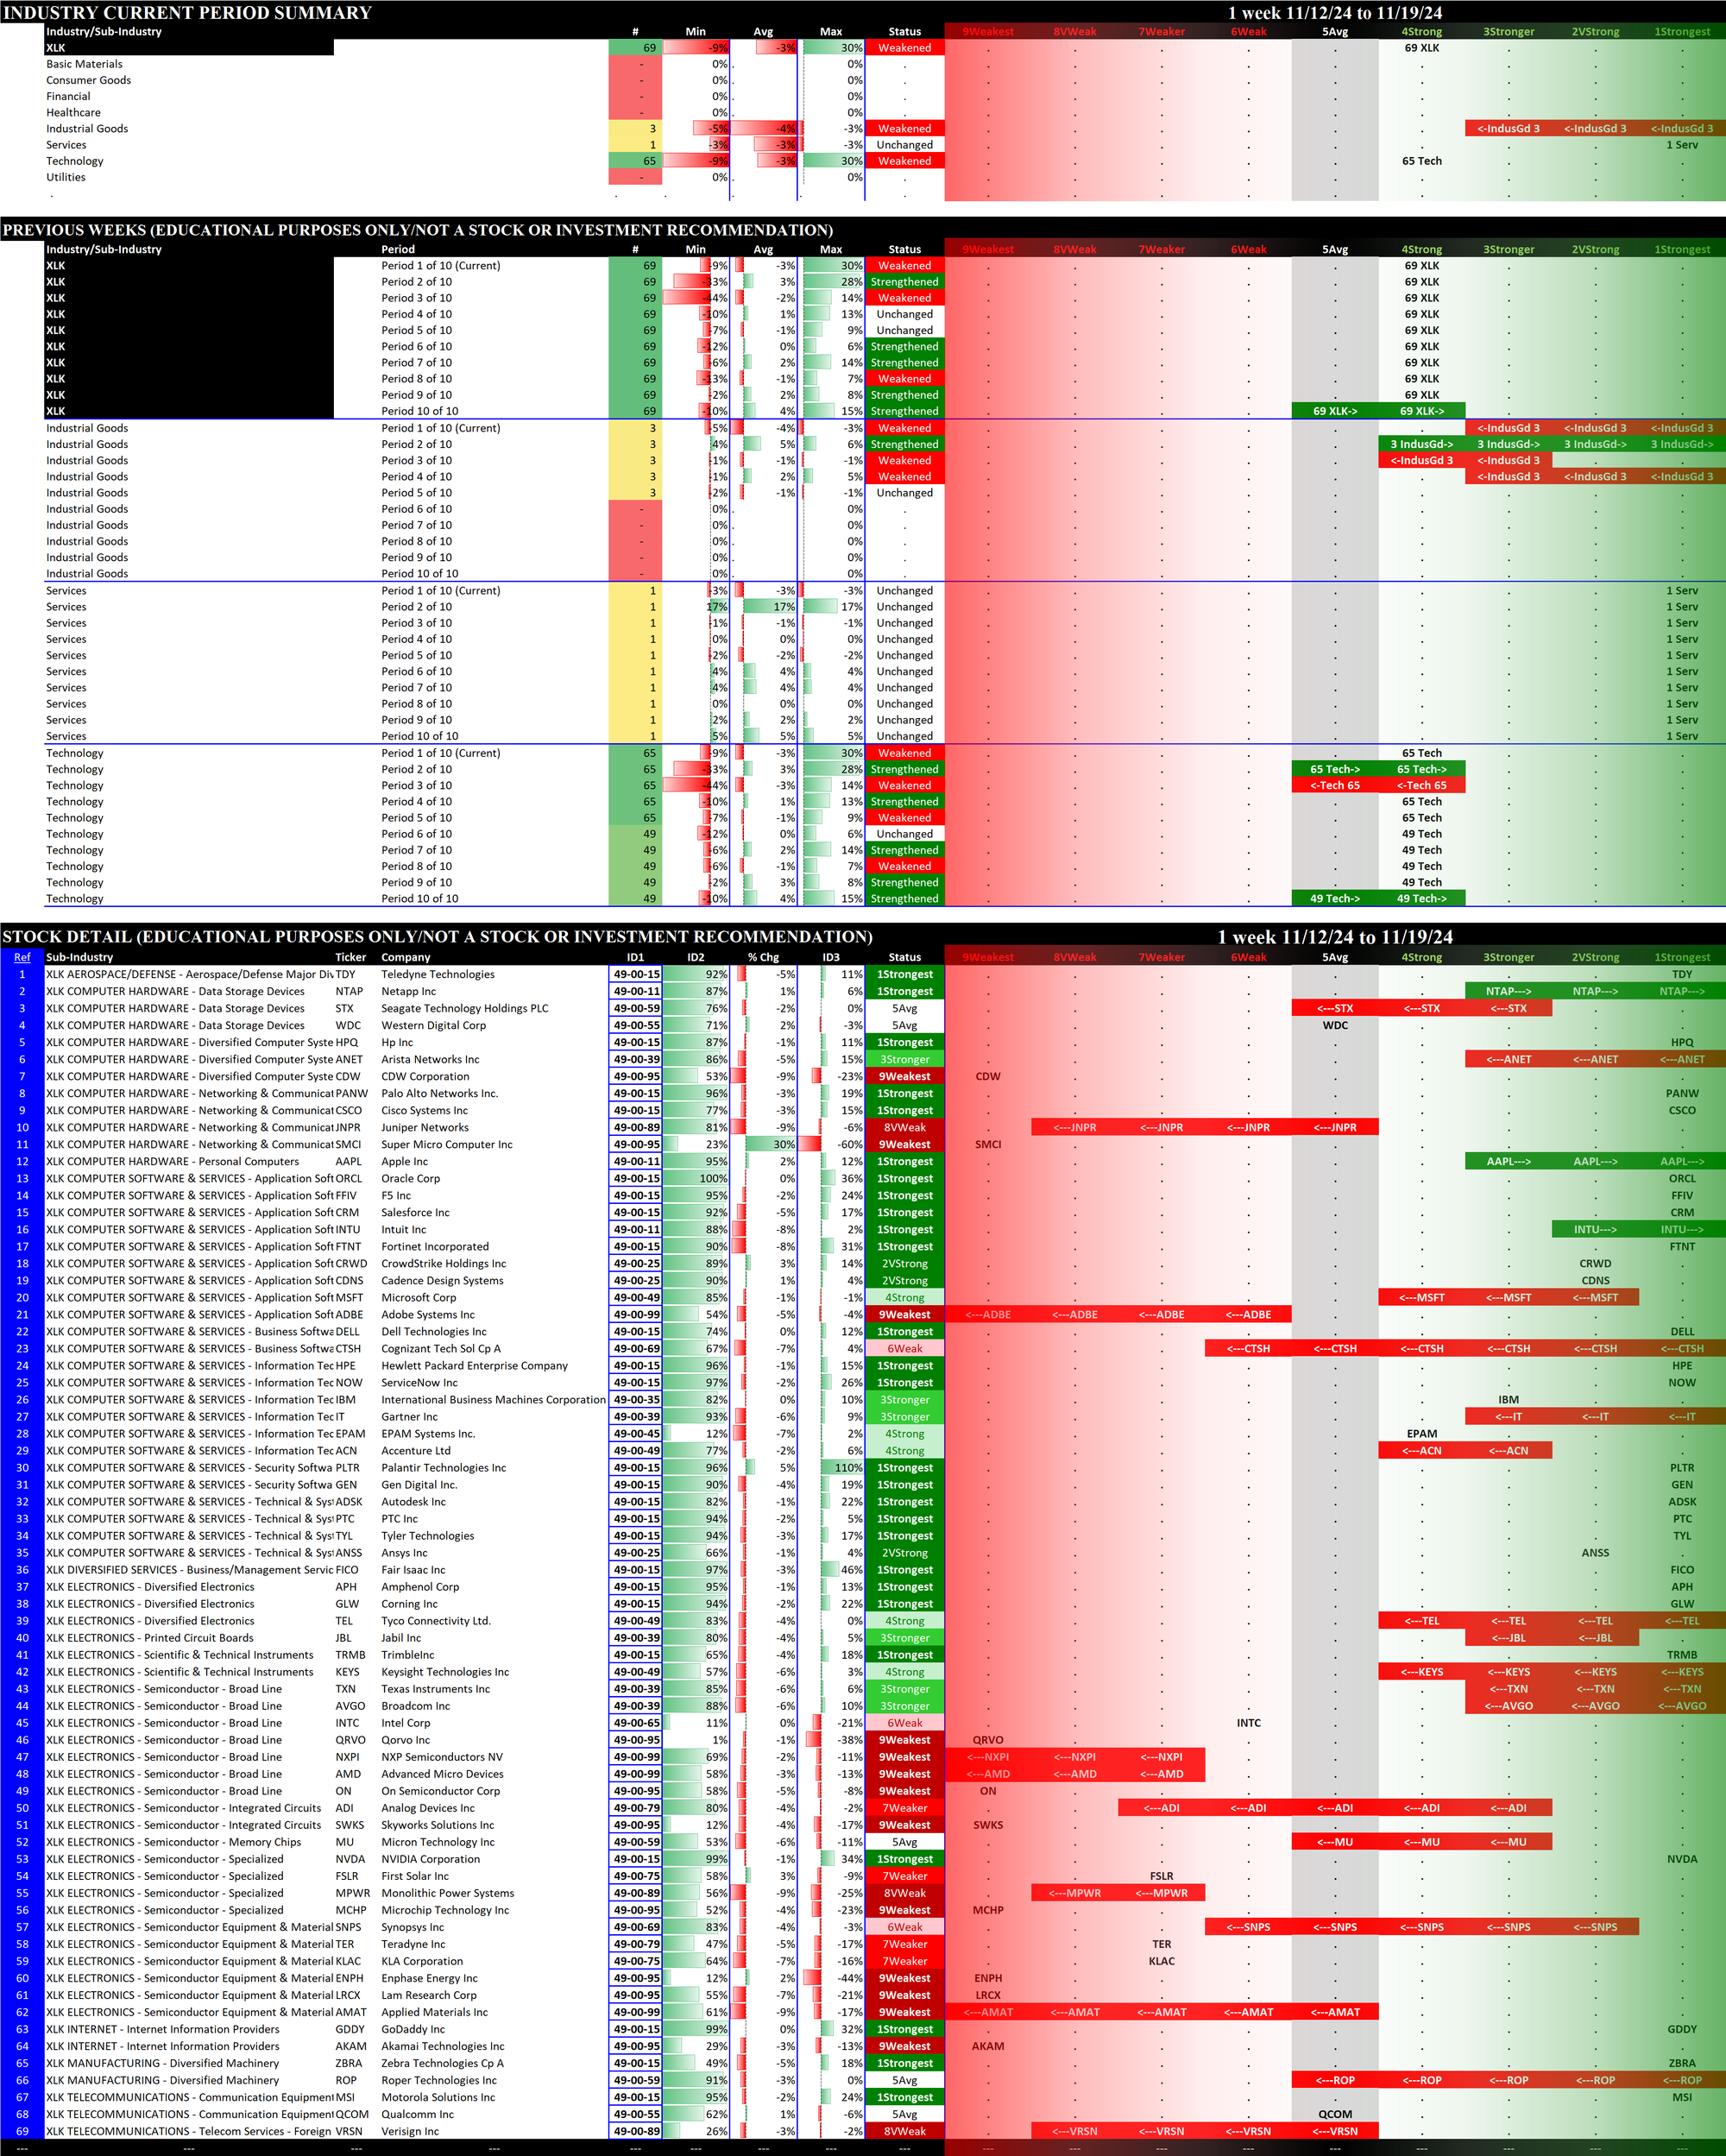
The XLK/Technology outlier to the upside was SMCI/Super Micro Computer +30% (a stock still rated 9Weakest which has been under relentless pressure since reaching its all-time high earlier this year and which has been facing the possibility of de-listing). The XLI/Industrials outlier to the downside was LDOS/Leidos Holdings Inc., -21% and now rated 3Stronger, down from 1Strongest last week.
Context: Comparison to Previous Weeks
The following graphics show recent week-to-week changes ending on Tuesdays:
- 11/05/24: Mixed/Strengthened
- 11/12/24: Mixed/Unchanged
- 11/19/24 Mixed/Weakened
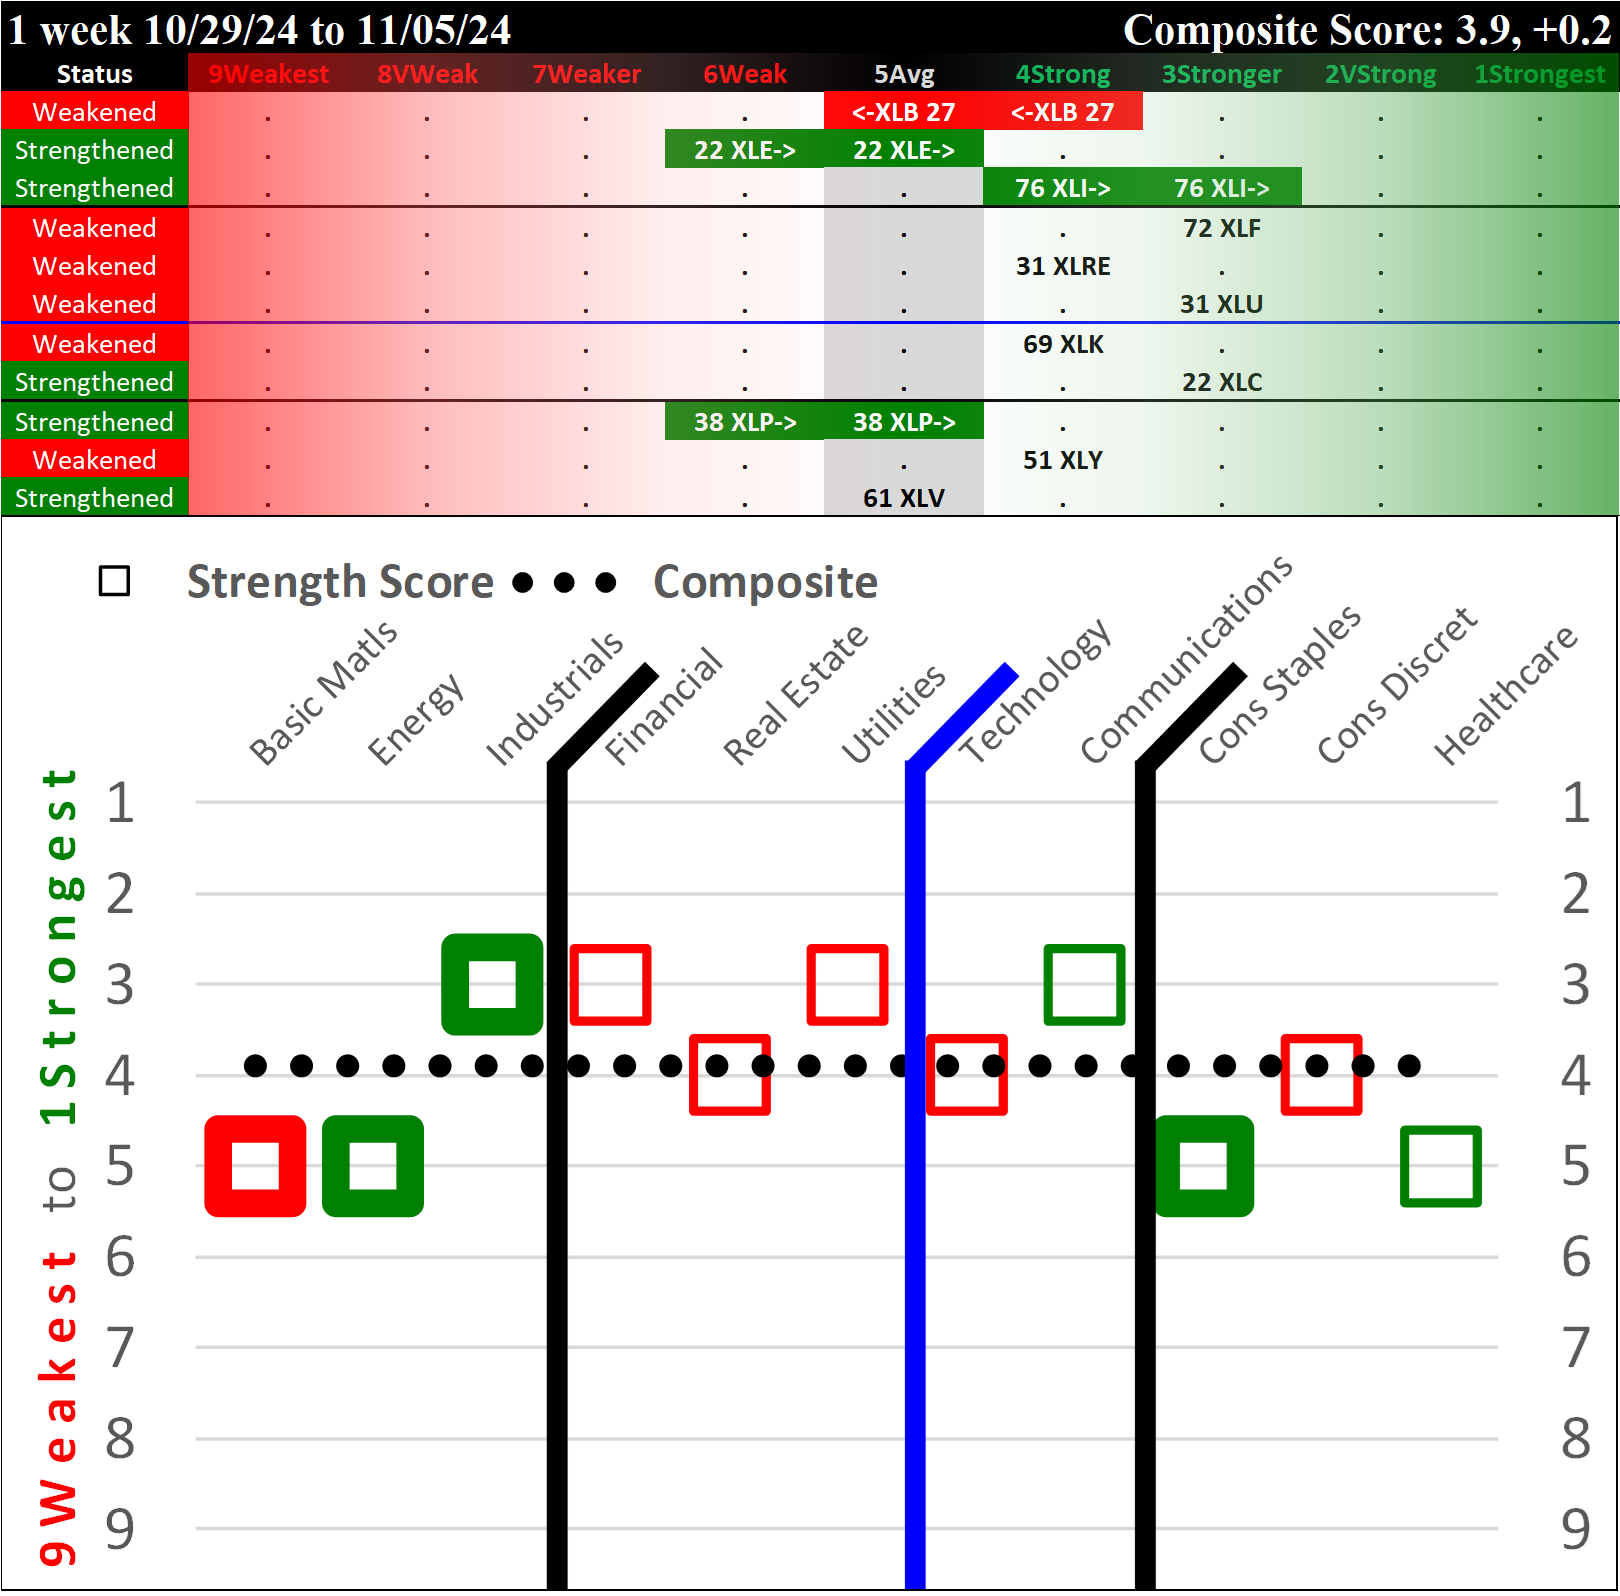
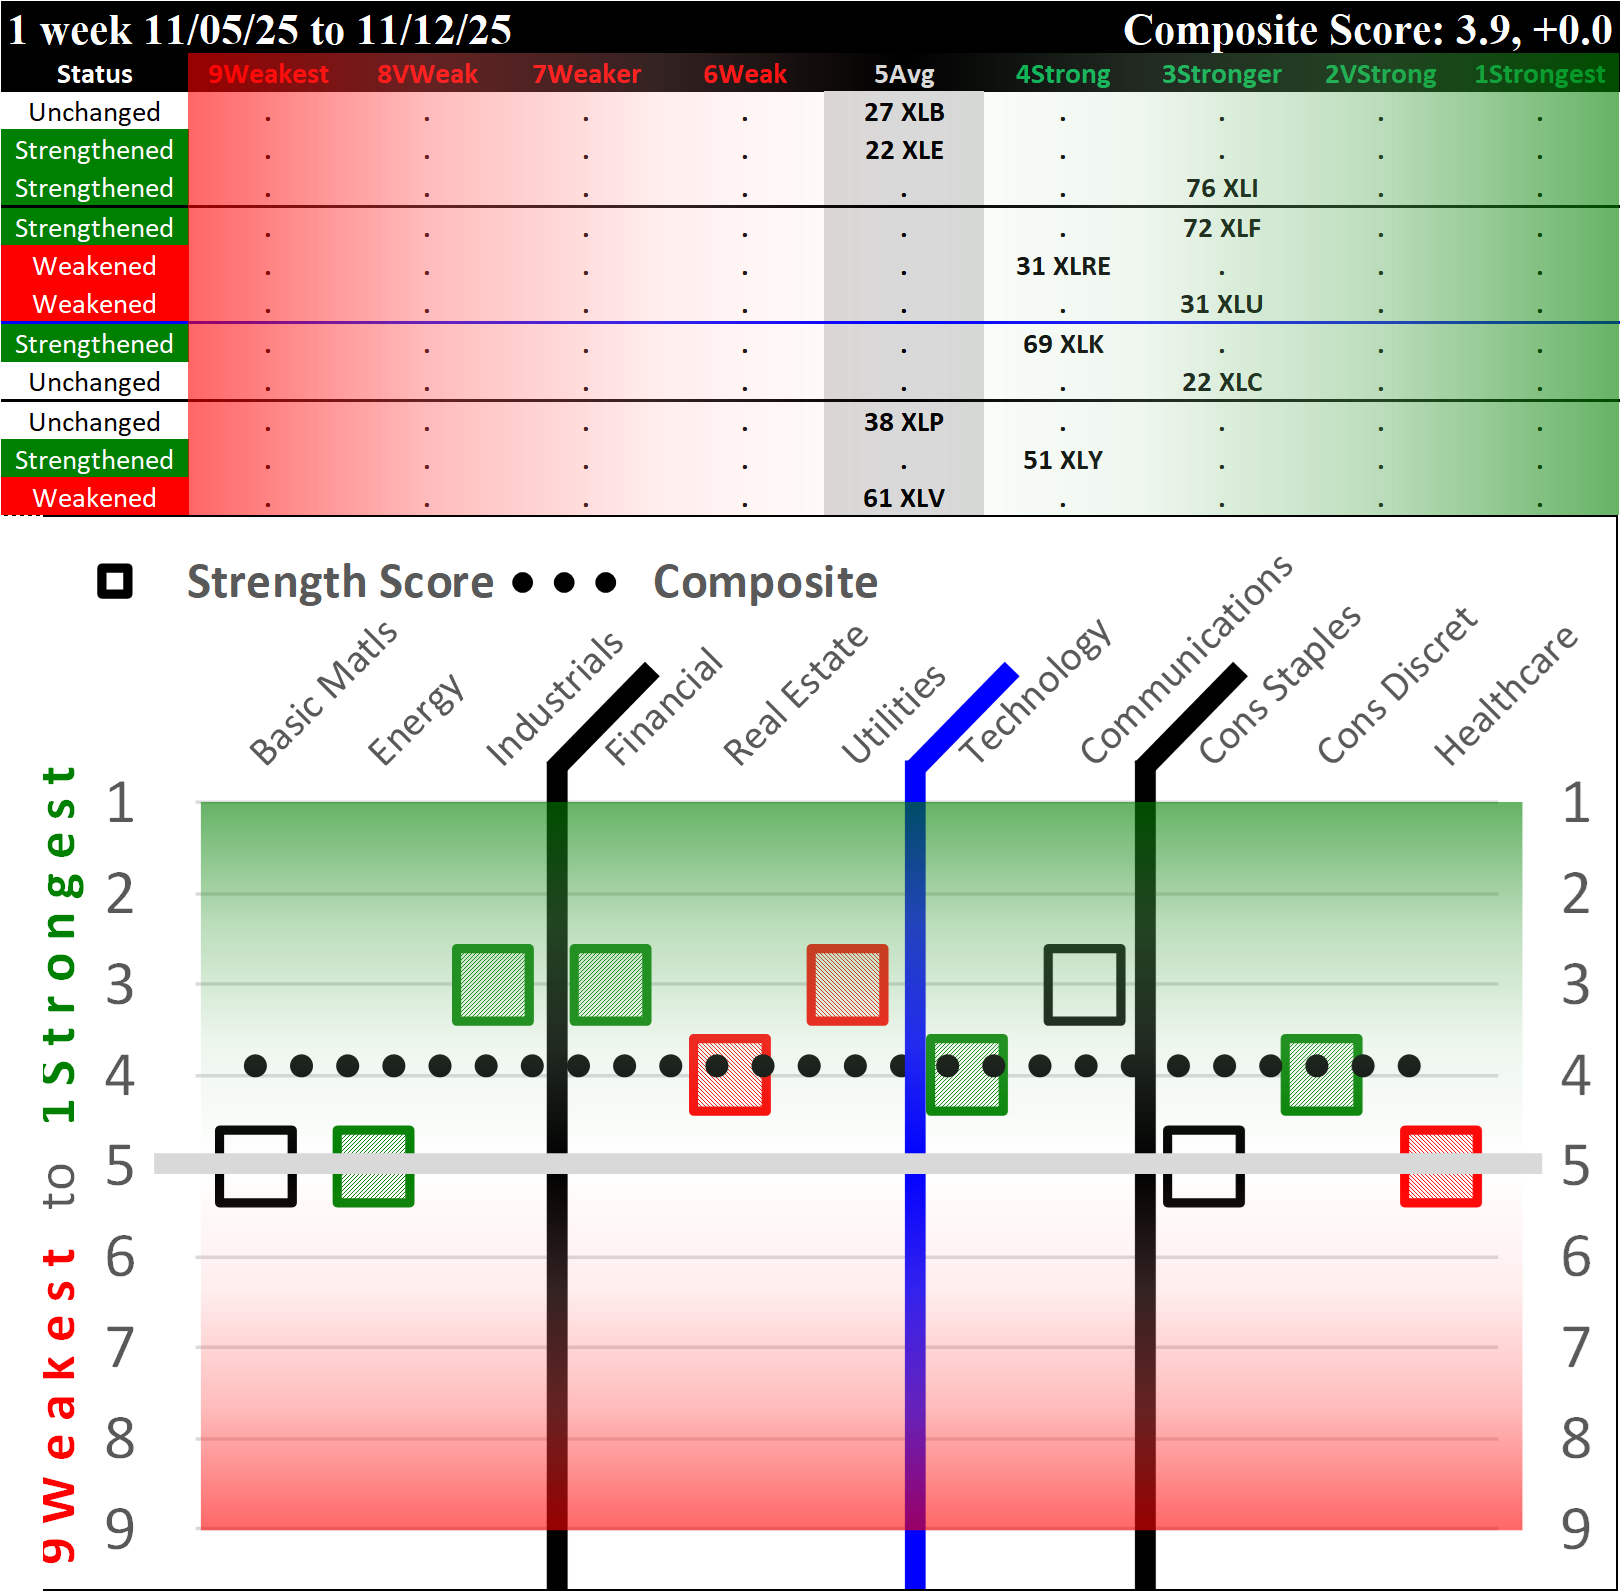
Mixed/weakened week for the just-completed week ending Tuesday, 2024-11-19.
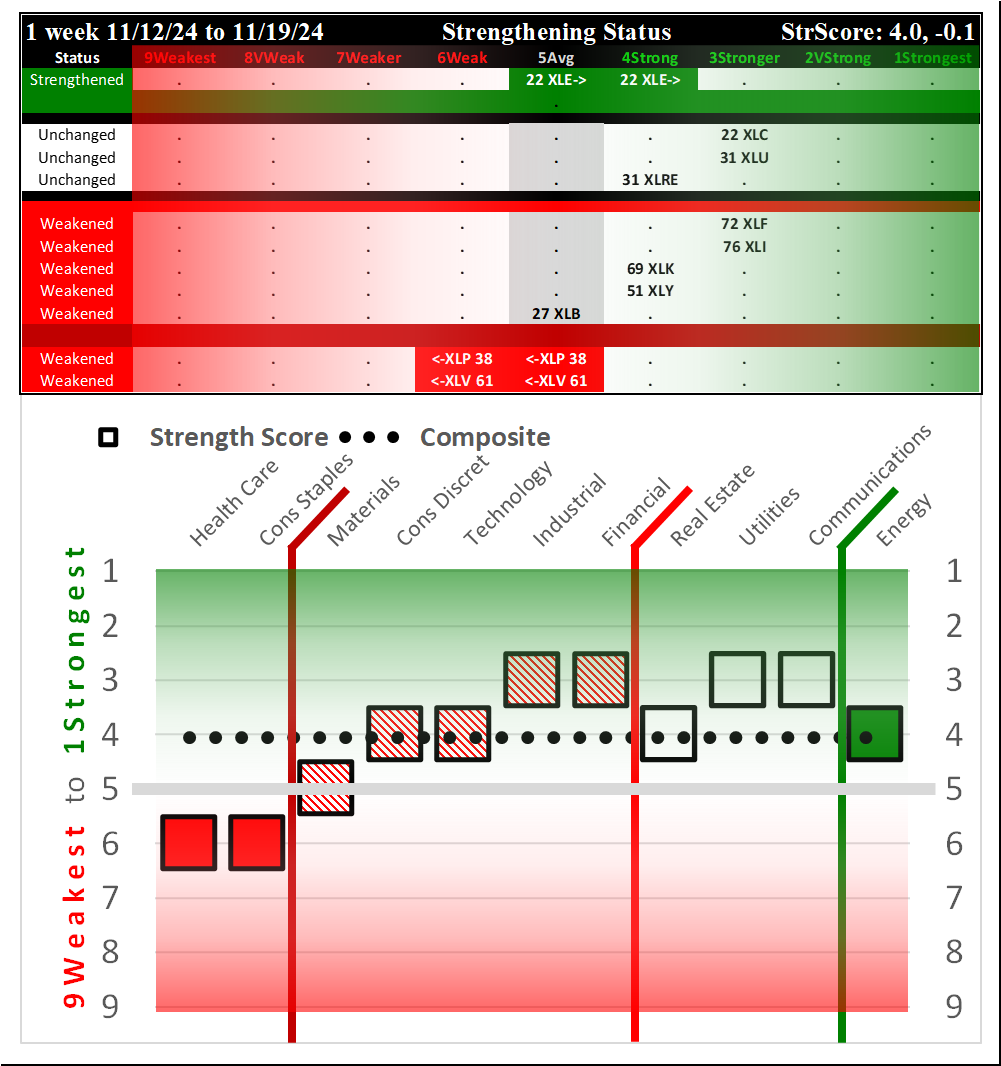
Current Status: 4.0 Composite Score, -0.1 this week
This week's rating is 4Strong. Per the comparison to previous weeks above, this is a strengthening of +0.1 from 2024-11-05 and a weakening of -0.1 from 2024-11-12.
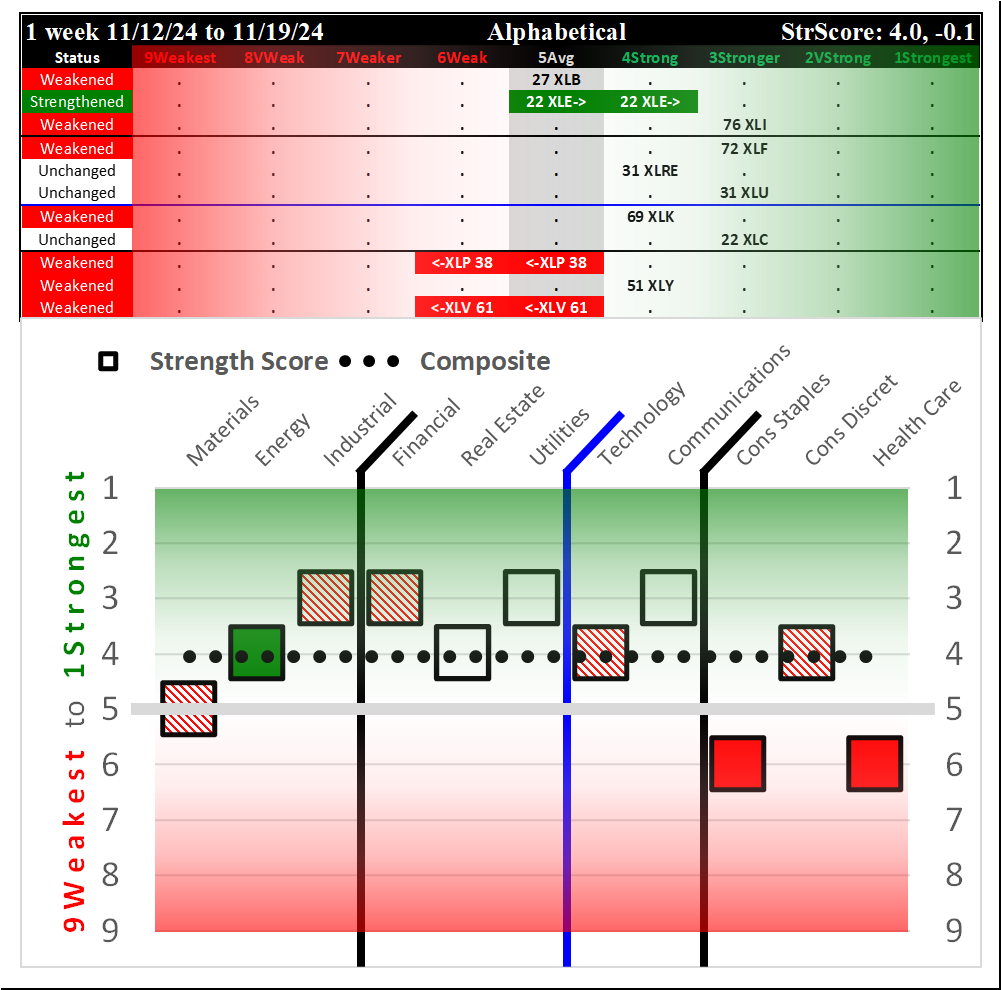
This shows that the top four ETFs are rated 3Stronger and are XLC/Communications, XLF/Financials, XLI/Industrials, and XLU/Utilities.
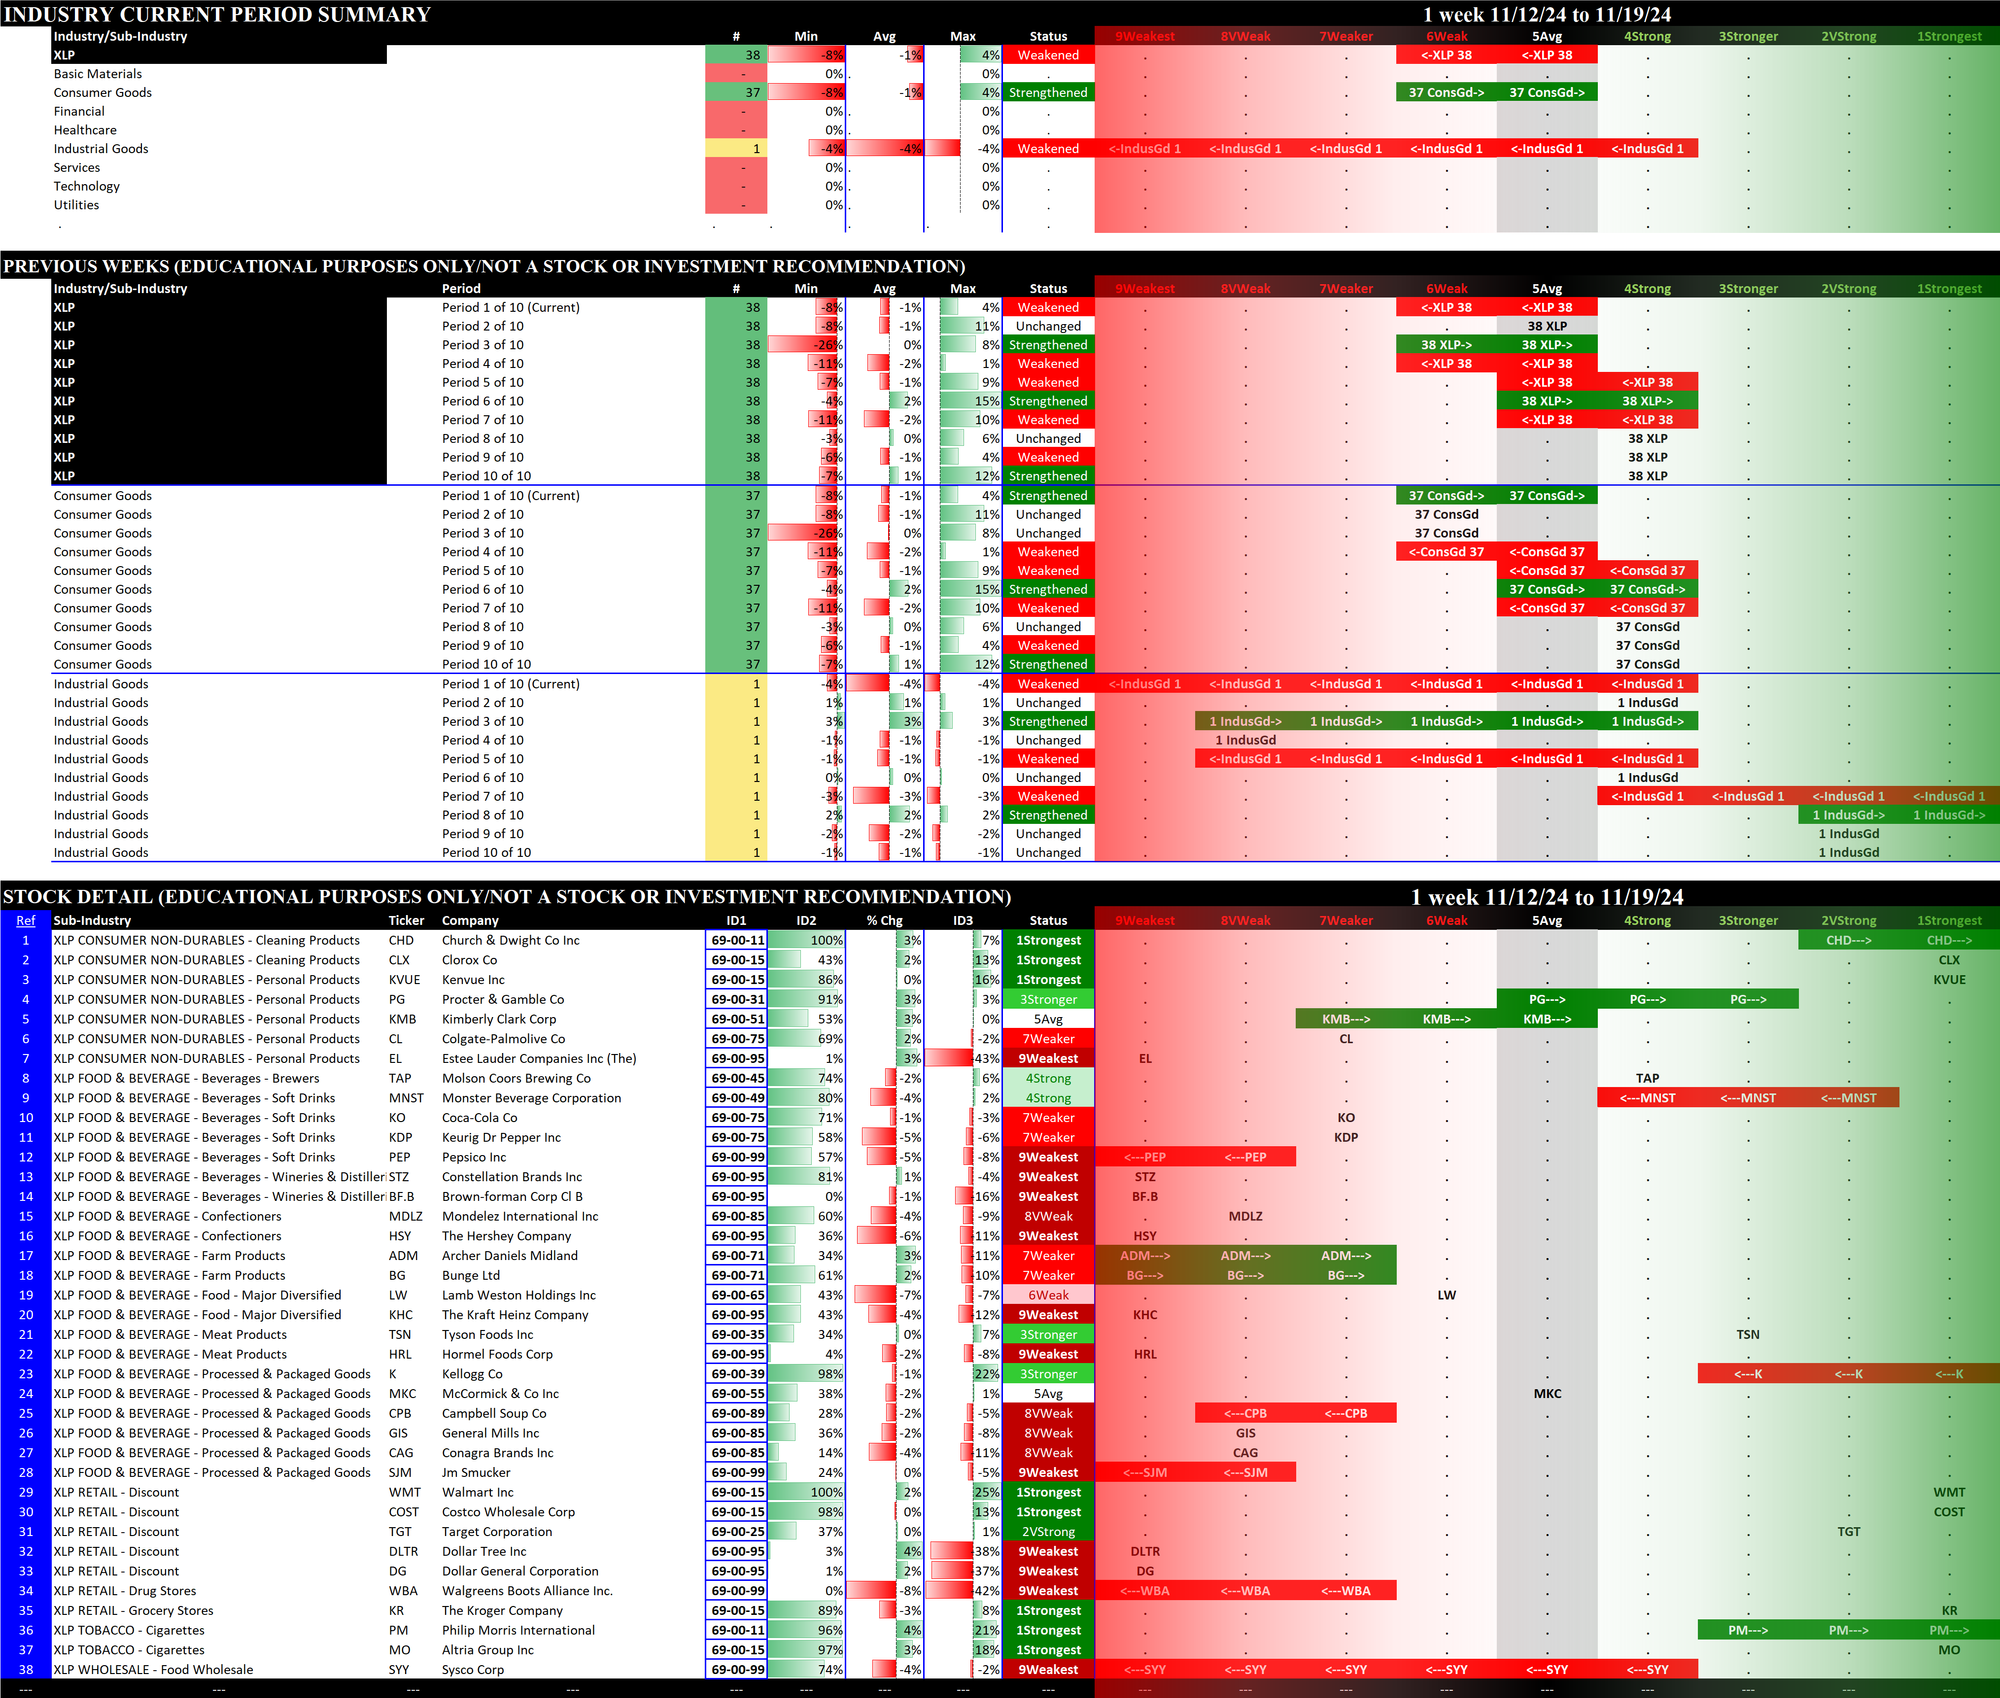
The weakest ETFs at 6Weak are XLP/Consumer Staples and XLV/Health Care.
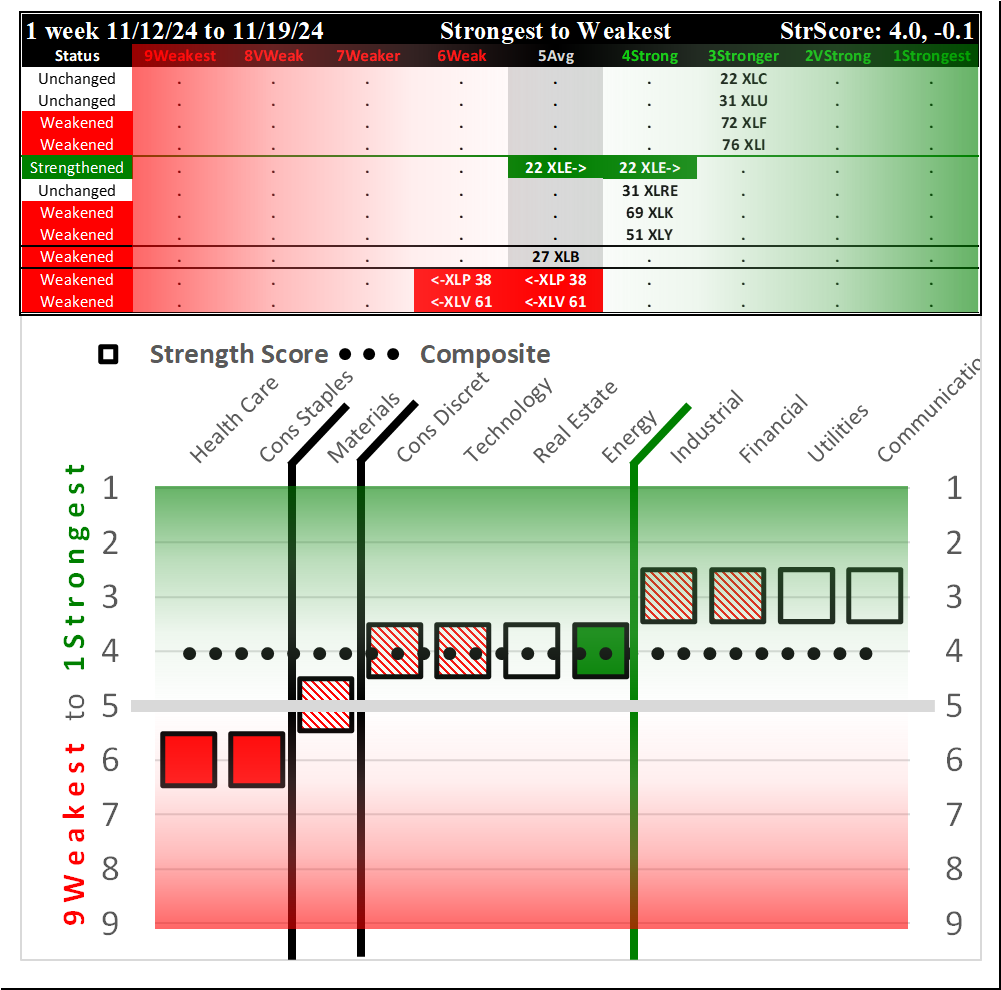
This shows the ETFs in decreasing order of Strength Rating and strengthening for the week. Sectors with the same rating are listed in order of as follows: first, sectors that strengthened rating during the week; second, sectors with ratings that did not change during the week but did strengthen; third, sectors with ratings that did not change during the week but did weaken; and fourth, sectors which weakened rating during the week. The color-coded lines delineate different ratings - 4Strong or stronger are separated by green lines, 6Weak or weaker are separated by red lines, and 5Average is separated by black lines.
The ETFs are listed below based on their strength rating.
1Strongest
None
2VeryStrong
None
3Stronger
- XLC/Communications (Unchanged)
- XLU/Utilities (Unchanged)
- XLF/Financial (Weakened)
- XLI/Industrials (Weakened)
4.0 - Composite Score
4Strong
- XLE/Energy (Strengthened Rating)
- XLRE/Real Estate (Unchanged)
- XLK/Technology (Weakened)
- XLY/Consumer Discretionary (Weakened)
5Average
- XLB/Materials (Weakened)
6Weak
- XLP/Consumer Staples (Weakened Rating)
- XLV/Healthcare (Weakened Rating)
7Weaker
None
8VeryWeak
None
9Weakest
None
Today's Market Context
Key Headlines
"S&P 500 bounces as stocks’ bull-market cycle seen potentially speeding up in 2025"
"Nvidia’s earnings could determine the stock market’s near-term direction: BofA."
"Bitcoin near record high but in good news for investors it’s now less volatile"
(Marketwatch)
"Target shares plunge 15% after discounter cuts forecast, posts biggest earnings miss in two years"
"Weekly mortgage demand inched up, despite higher interest rates"
(CNBC)
Key Current Readings
SP500: 5,916.98
Nasdaq: 18,987.47
Nasdaq 100: 20,684.59
Russell 2000: 2,324.83
10Y Treasury: 4.434%
2YT: 4.31%
Oil (WTI Crude): $69.83
Bitcoin: $93,638
Dollar Index: 106.56
Gold: $2,630.7
VIX: 16.19
(CNBC)
Sector ETF Analysis Contents
The following Stock Market Organizer strengthening/weakening analysis looks at the 11 SPDR ETFs and their underlying component stocks for the week ending Tuesday 2024-11-19, as follows:
- ETFs Summary
1.1 Current Overview
1.2 Historical Summaries - ETFs Detail
2.1 XLB Basic Materials
2.2 XLC Communications
2.3 XLE Energy
2.4 XLF Financials
2.5 XLI Industrials
2.6 XLK Technology
2.7 XLP Consumer Staples
2.8 XLRE Real Estate
2.9 XLU Utilities
2.10 XLV Healthcare
2.11 XLY Consumer Discretionary - Stock Detail (downloads)
1. ETFs Summary
1.1 Current Overview
The following graphs reflect the composition of each of the ETFs based on their underlying stock strength ratings which range from 1Strongest to 9Weakest. Since I only care about the strongest and weakest in each sector, stocks rated from 2VeryStrong through 8VeryWeak are categorized as "Ignore."
- Top row: XLB/Materials, XLE/Energy, and XLI/Industrials
- Second row: interest rate-sensitive ETFs XLF/Financials, XLRE/Real Estate, and XLU/Utilities
- Third row: XLK/Technology and XLC/Communications
- Bottom row: XLP/Consumer Staples, XLY/Consumer Discretionary, and XLV/Health Care
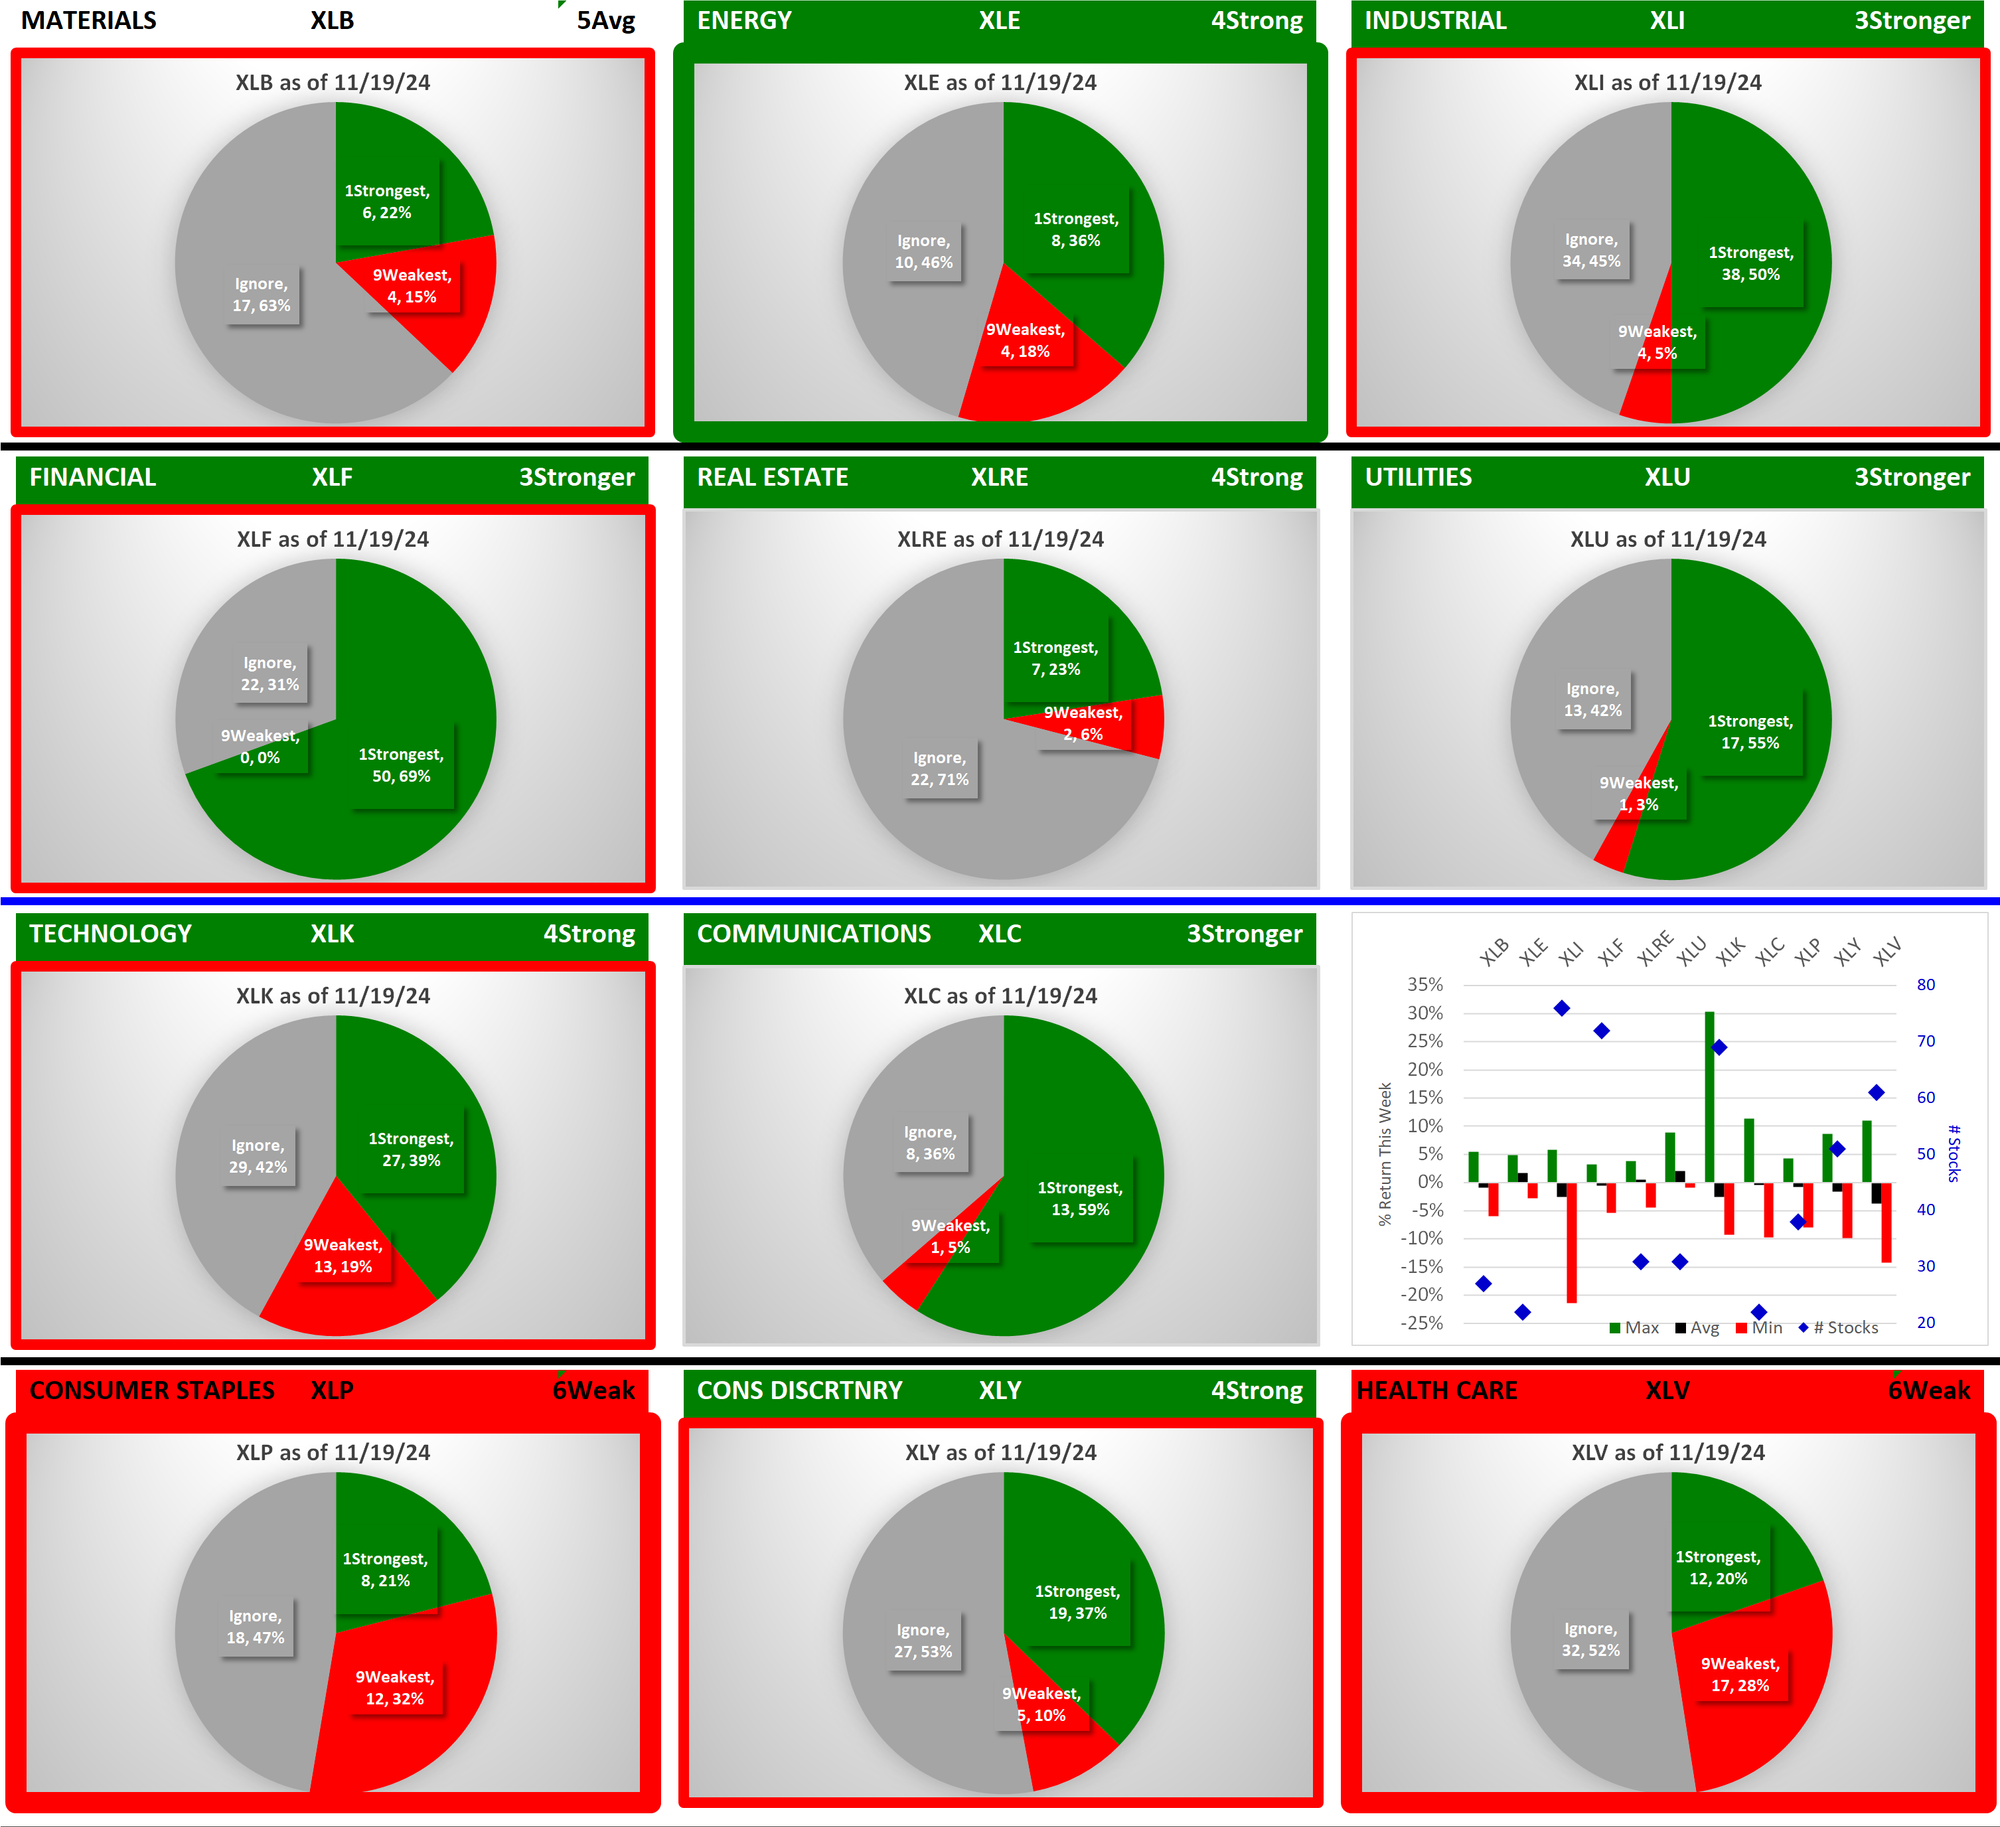
The headers for each graphic are color-coded. ETFs rated 4Strong or better have green headings - currently, 8 of 11 ETFs qualify. The weakest ETFs XLP/Consumer Staples and XLV/Health Care have 6Weak ratings. ETFs that changed rating this week have thick green or red borders - XLE/Energy strengthened while both XLP/Consumer Staples and XLV/Health Care weakened ratings. ETFs that strengthened or weakened but did not change rating have thin green or red borders.
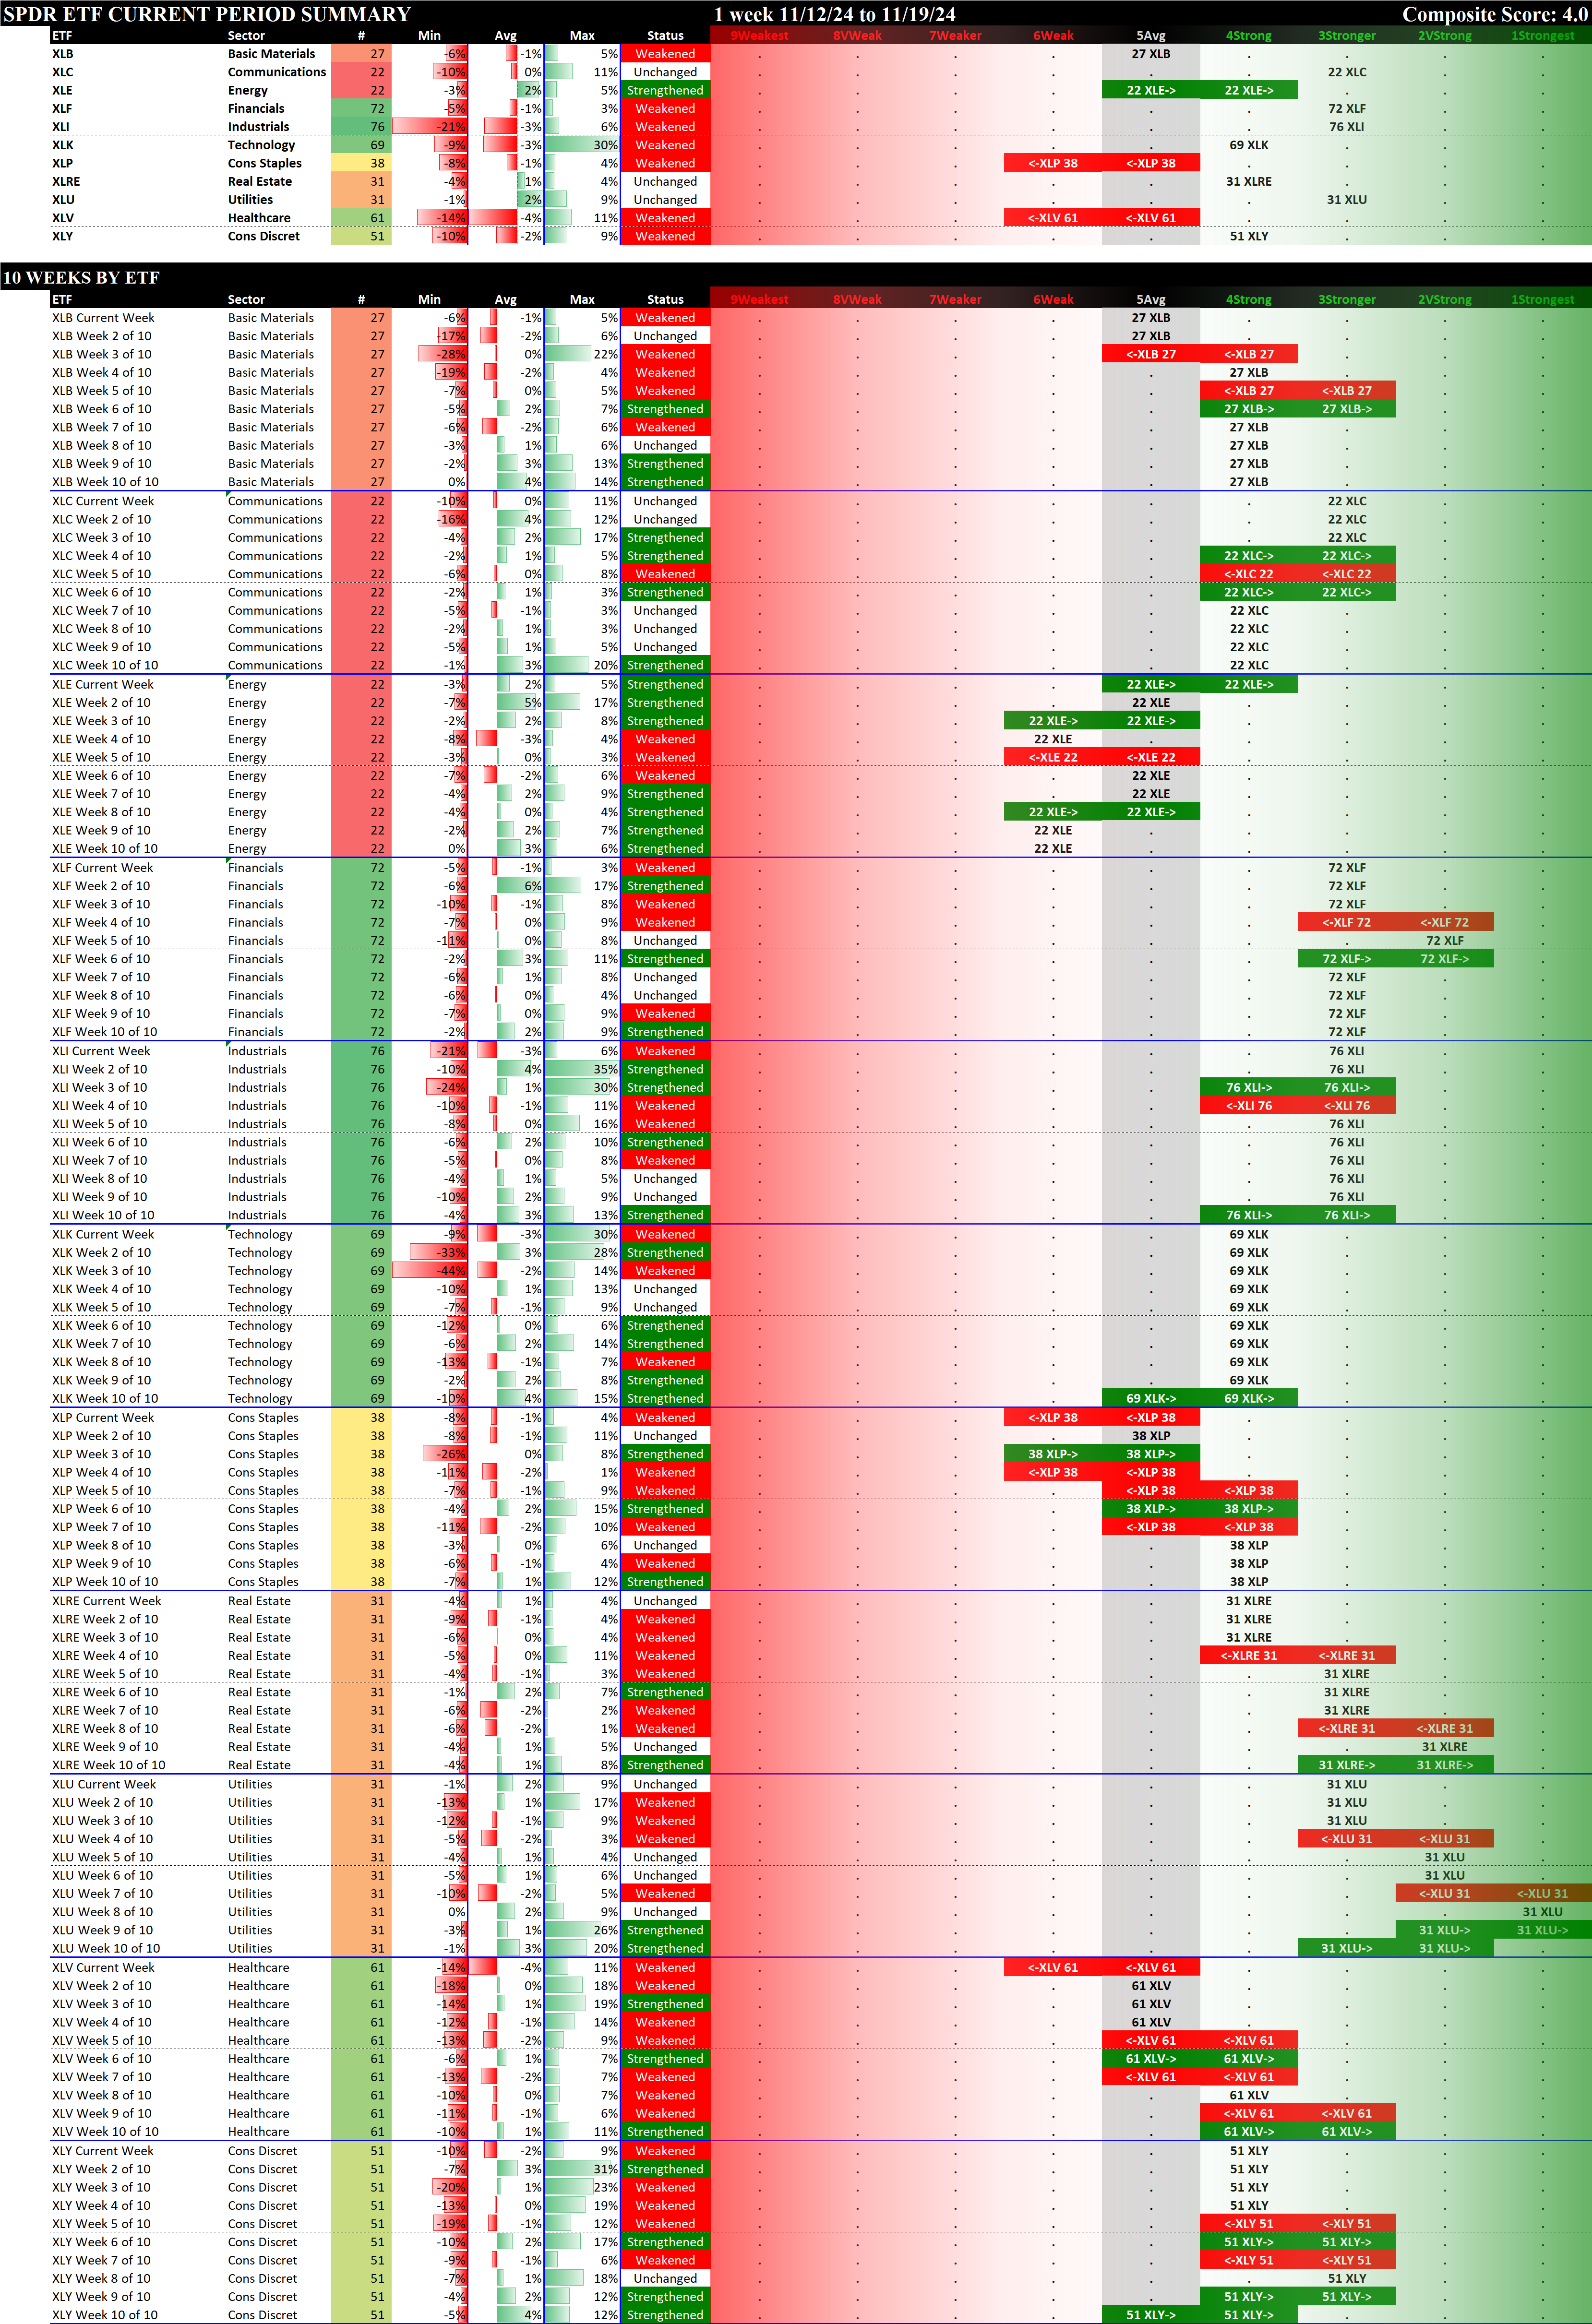
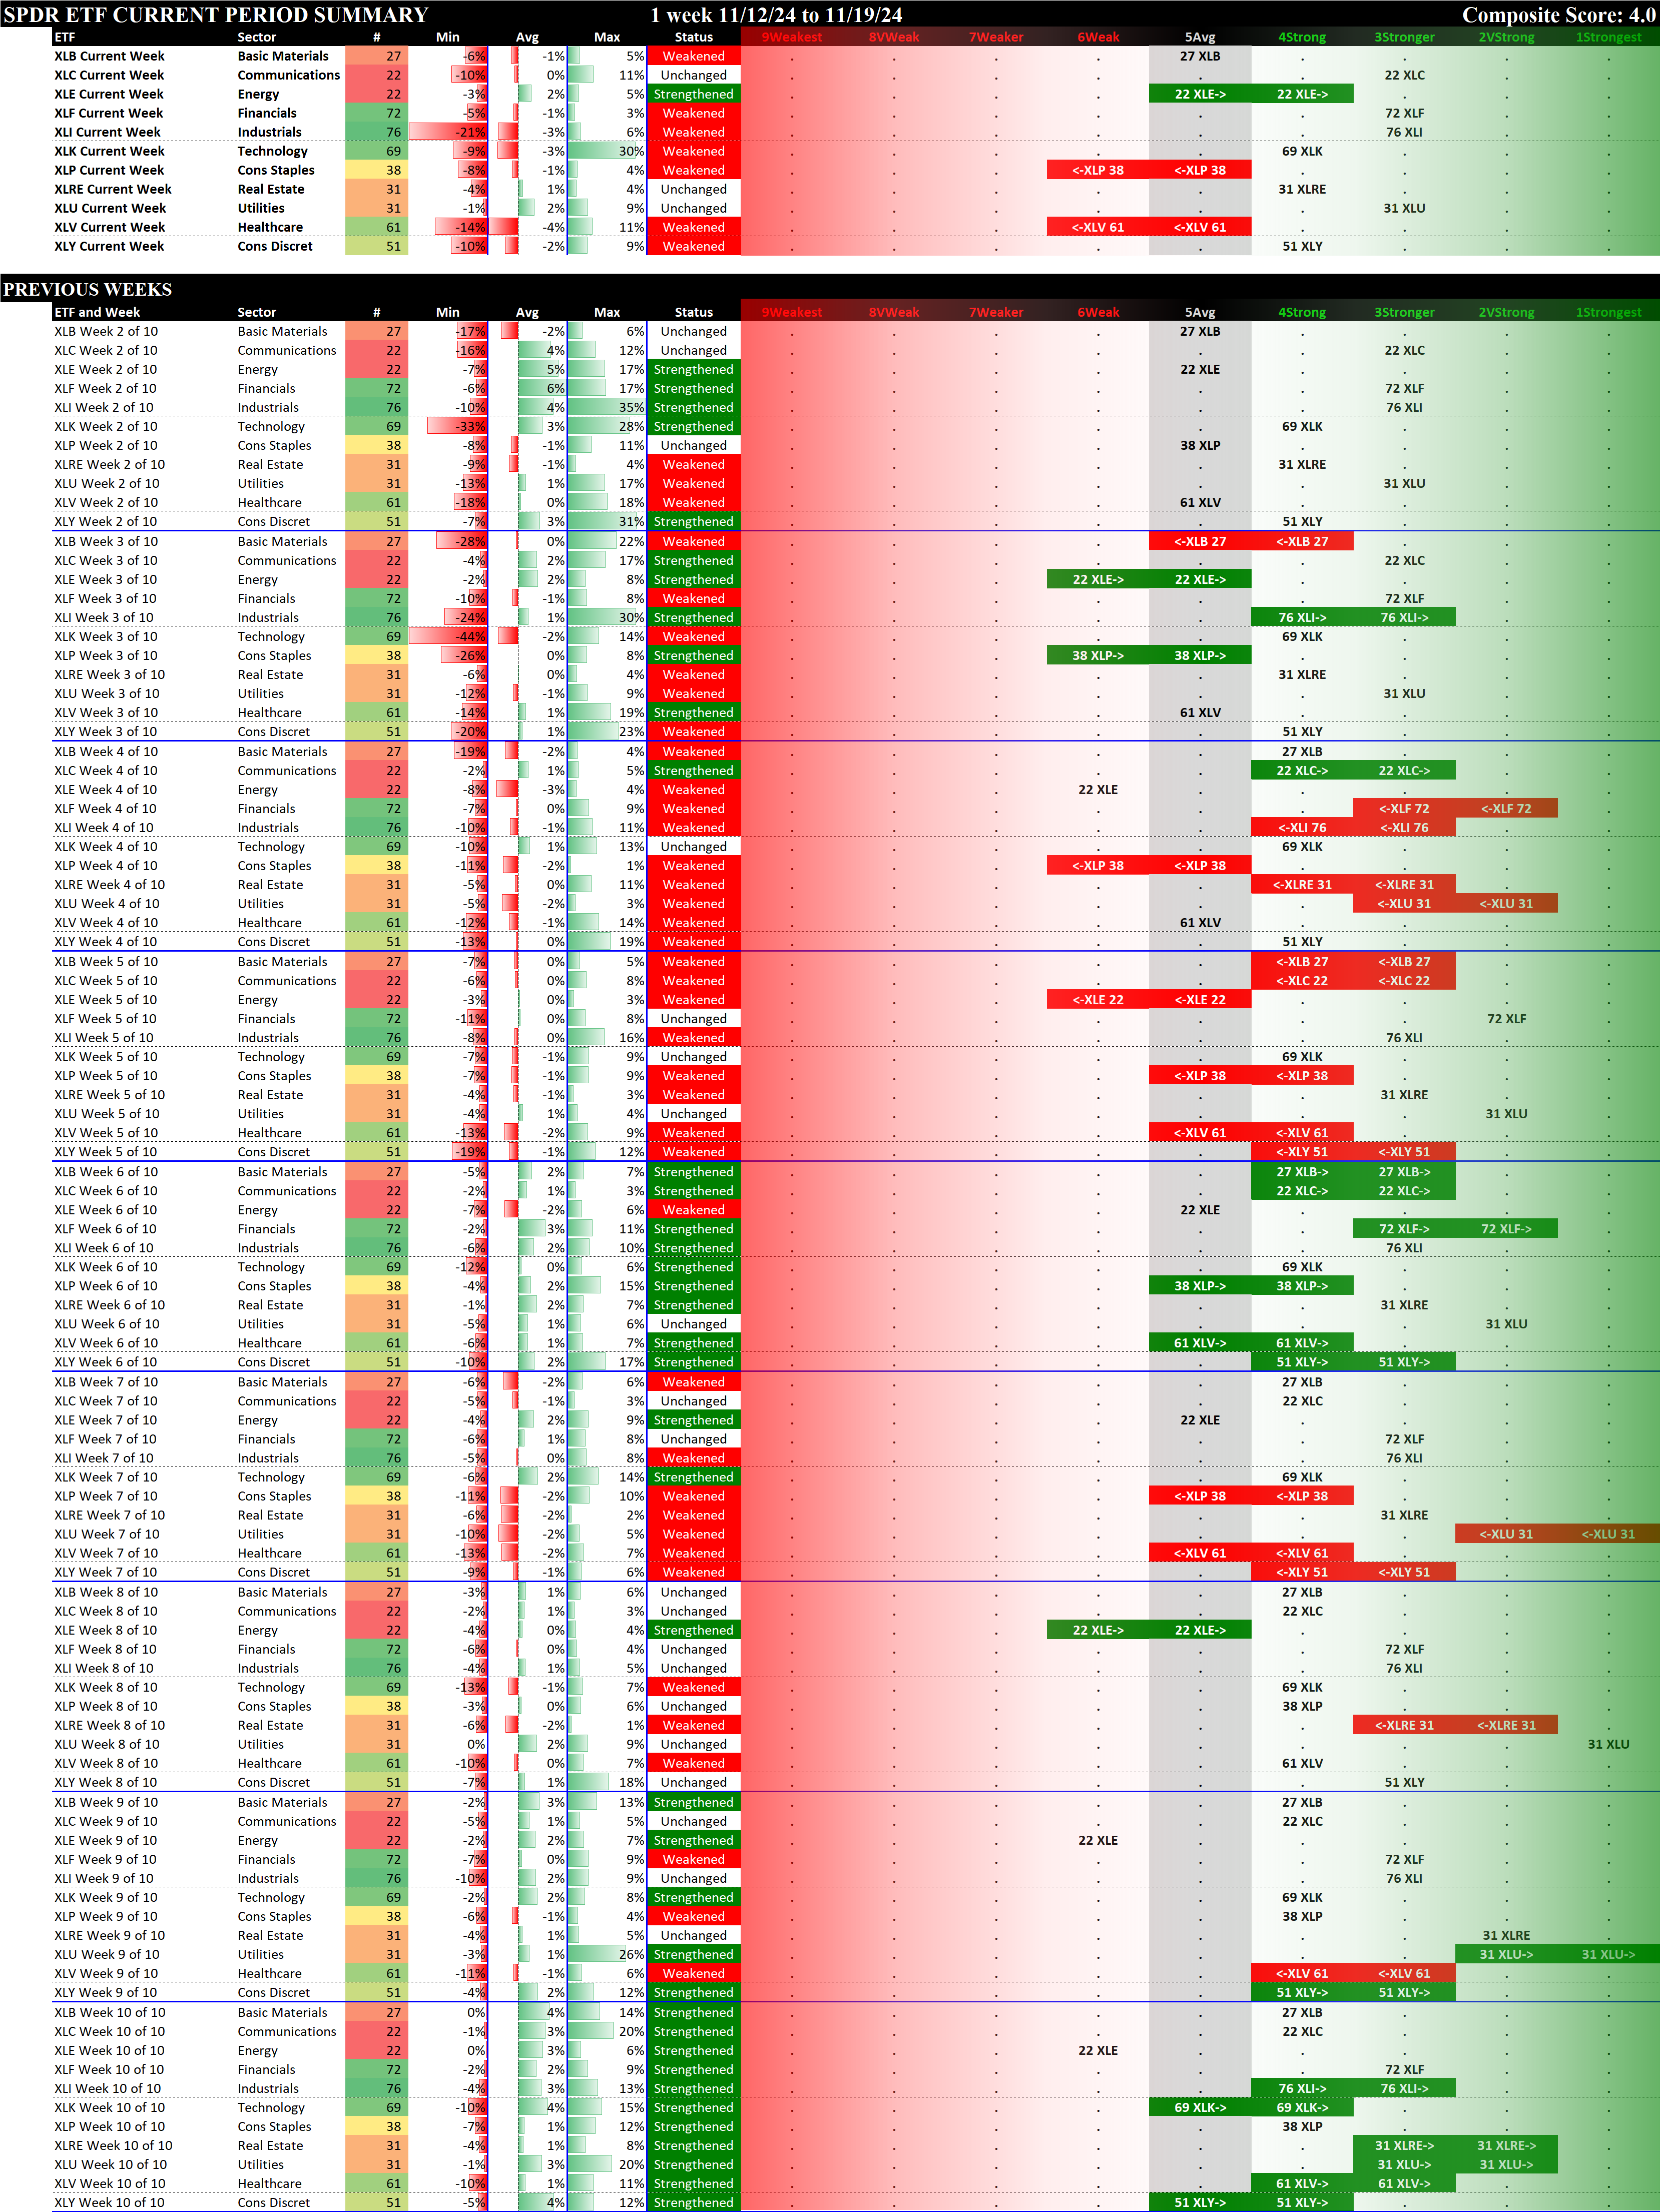
1.2 Historical Summaries
Below are 10-week historical strength rating summaries of the ETFs, sorted first by ETF and then by Week. The graphics make it easy to compare strengthening and weakening between ETFs over the most recent 10 weeks.
Sorted by ETF
This graphic shows the past 10 weeks strengthening and weakening segregated by ETF.
Sorted by Week
This graphic shows the past 10 weeks strengthening and weakening segregated by week.
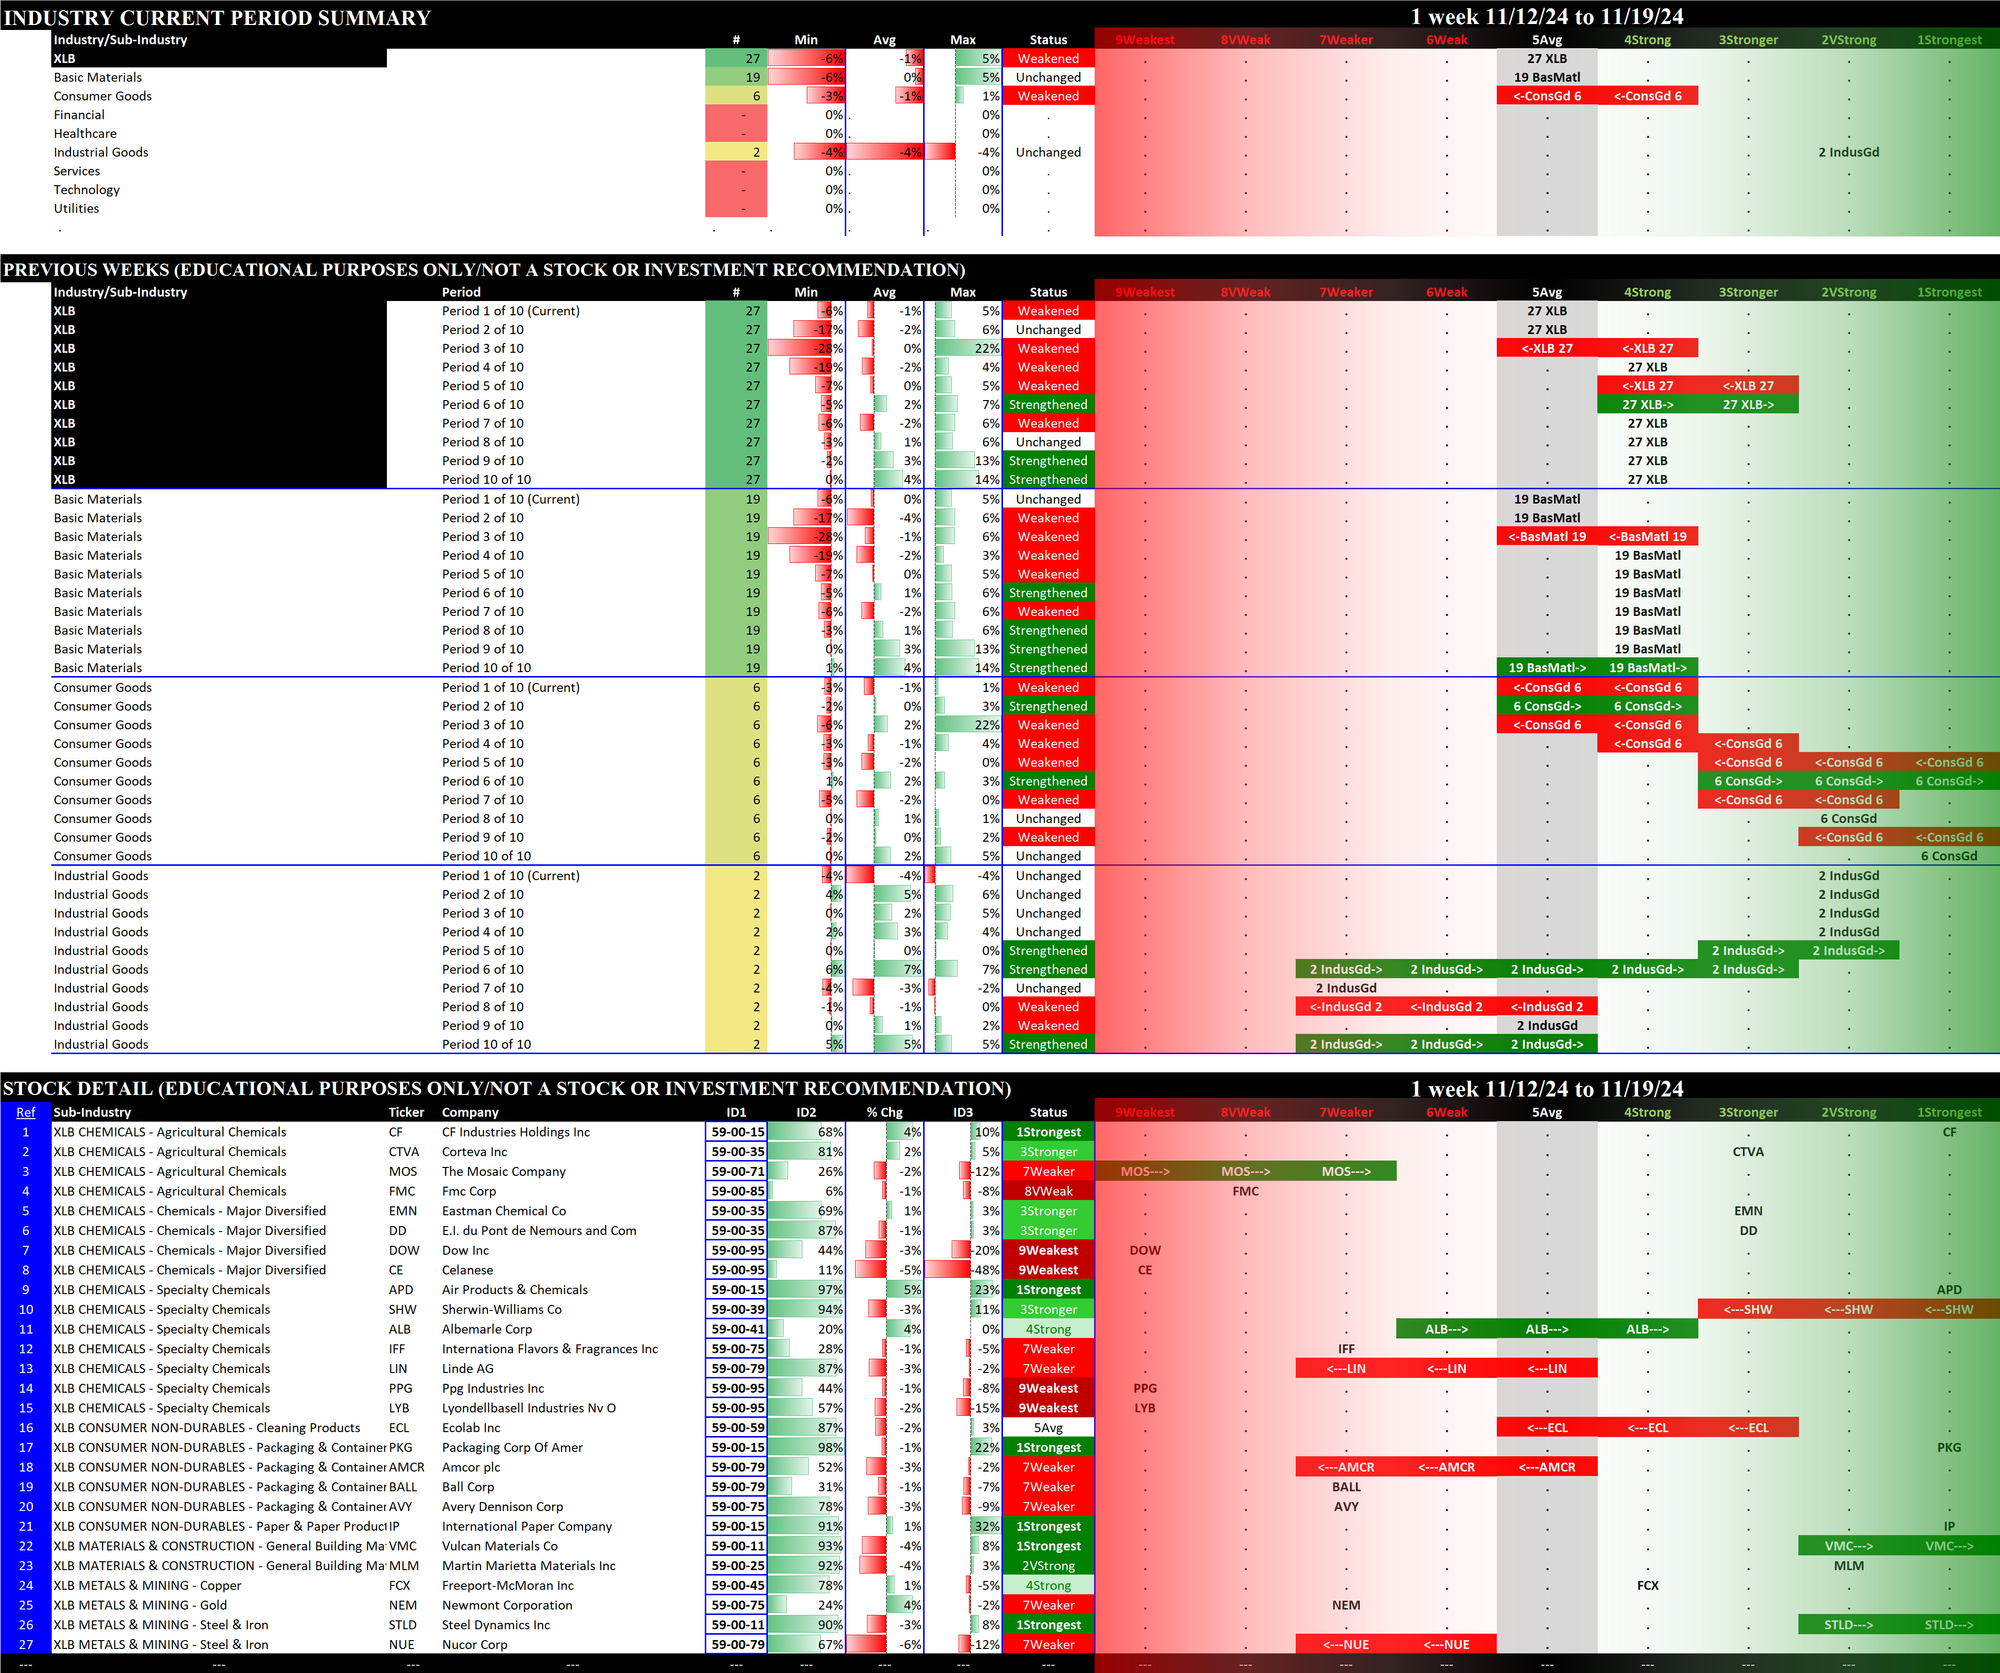
2. ETFs Detail
Details for each of the 11 ETFs are provided below. Comments:
- The top section shows the strength rating of the sectors comprising each ETF, based on the eight original Stock Market Organizer classifications and NOT the 11 ETF classifications. For example, the XLB Basic Materials ETF consists of 19 Basic Materials stocks, 6 Consumer Goods stocks, and 2 Industrial Goods stocks.
- The middle section shows the previous 10 weeks' strengthening and weakening of the relevant sectors. For example, since the XLB has Basic Materials, Consumer Goods, and Industrial Goods stocks, these three sectors are shown in the middle section of the XLB detail. The XLF (Financial) has Financial, Services, and Tech stocks.
- The bottom section shows strengthening/weakening for the underlying ETF components stocks, and includes the listing of their Stock Market Organizer industries and sub-industries. These stocks are listed in order based on Sub-industry then strongest to weakest comparative stock strength rating. The Basic Materials XLB ETF includes both Newmont Corporation/NEM in the Gold sub-industry within the Metals & Mining industry and Dow Inc./DOW in the Specialty Chemicals sub-industry within the Chemicals industry.
In these bottom sections, one can visually see the strength/strengthening and weakness/weakening of the component stocks in each ETF.
2.1 XLB Materials (27 stocks, small), UNCHANGED at 5Avg
Includes chemicals; metals and mining; paper and forest products; containers and packaging; and construction materials.
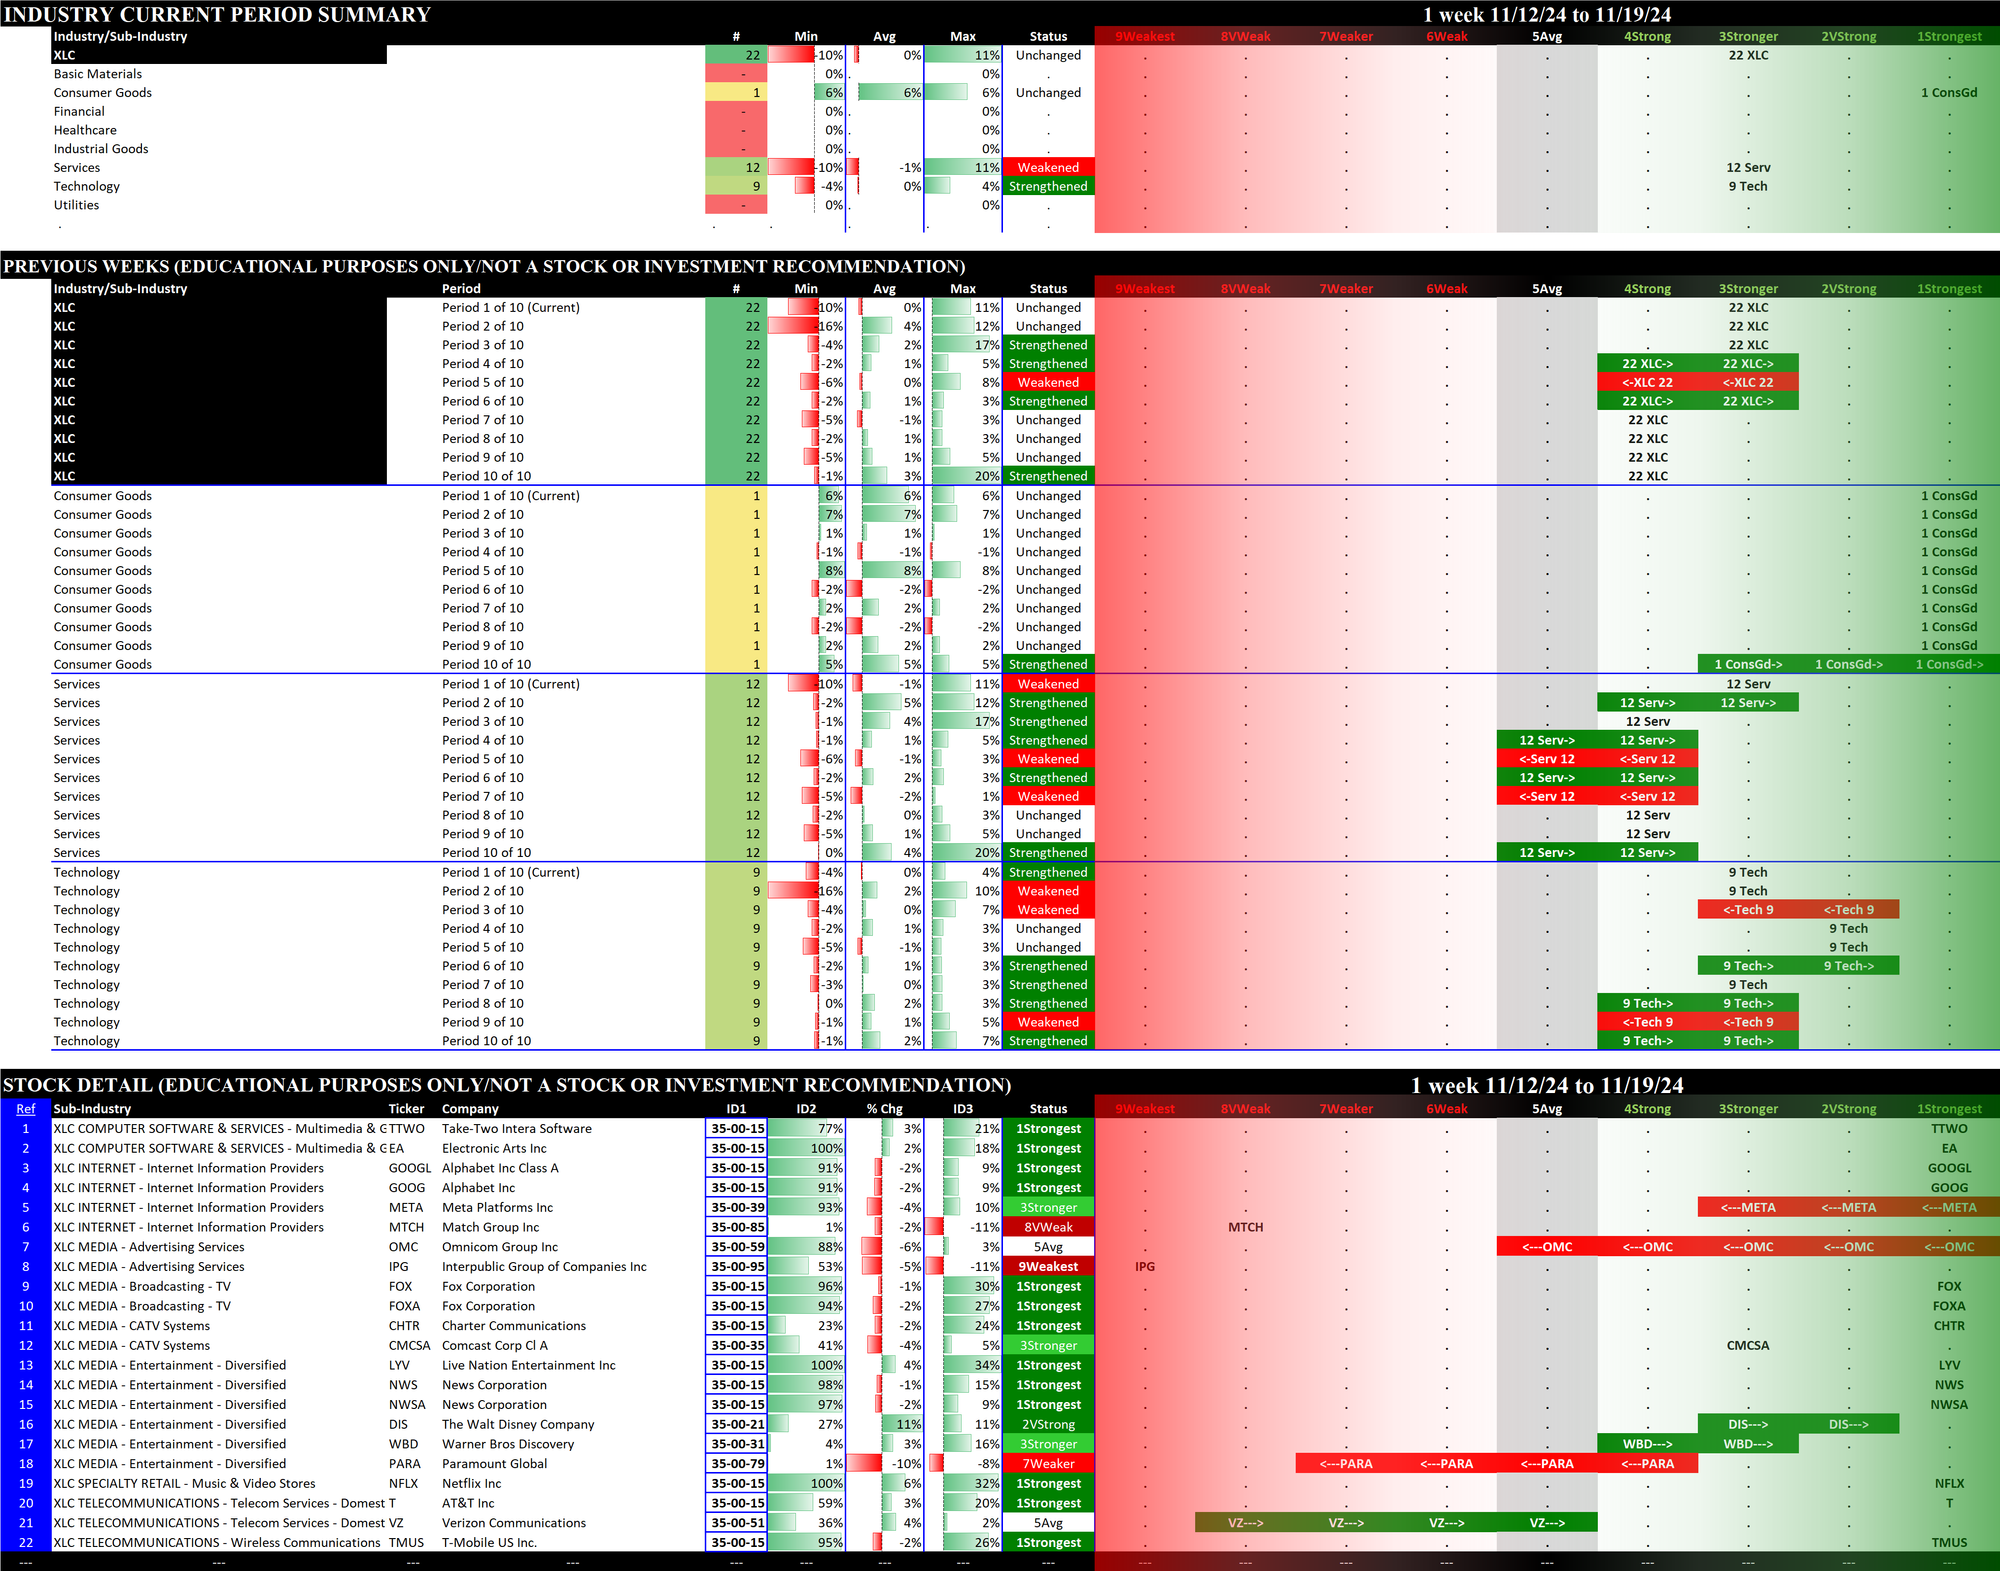
2.2 XLC Communication Services (22 stocks, small), UNCHANGED at 3Stronger, tied for BEST
Includes diversified telecommunication services; wireless telecommunication services; media; entertainment; and interactive media & services.
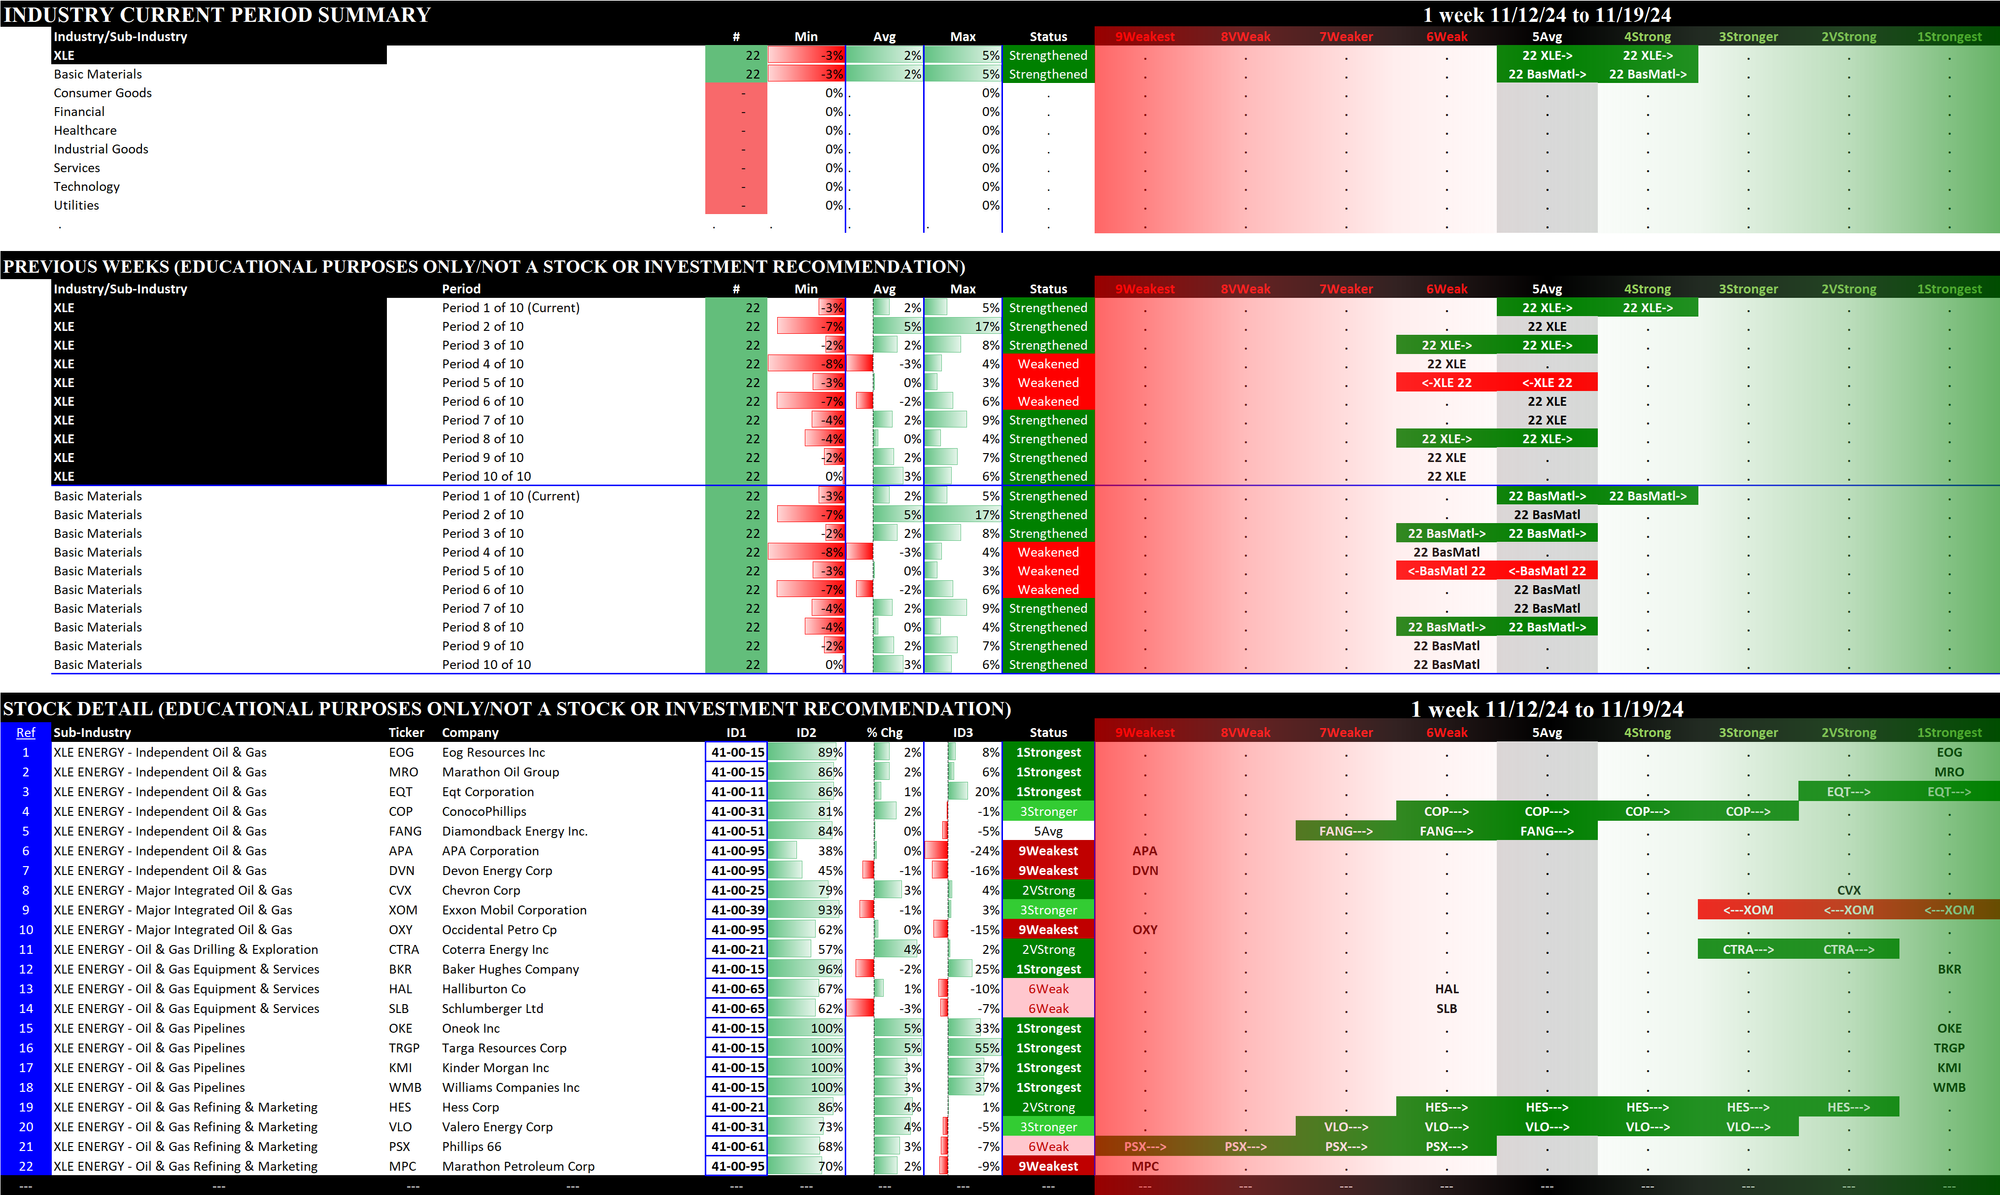
2.3 XLE Energy (22 stocks, small), STRENGTHENED to 4Strong
Includes oil, gas and consumable fuels; and energy equipment and services.
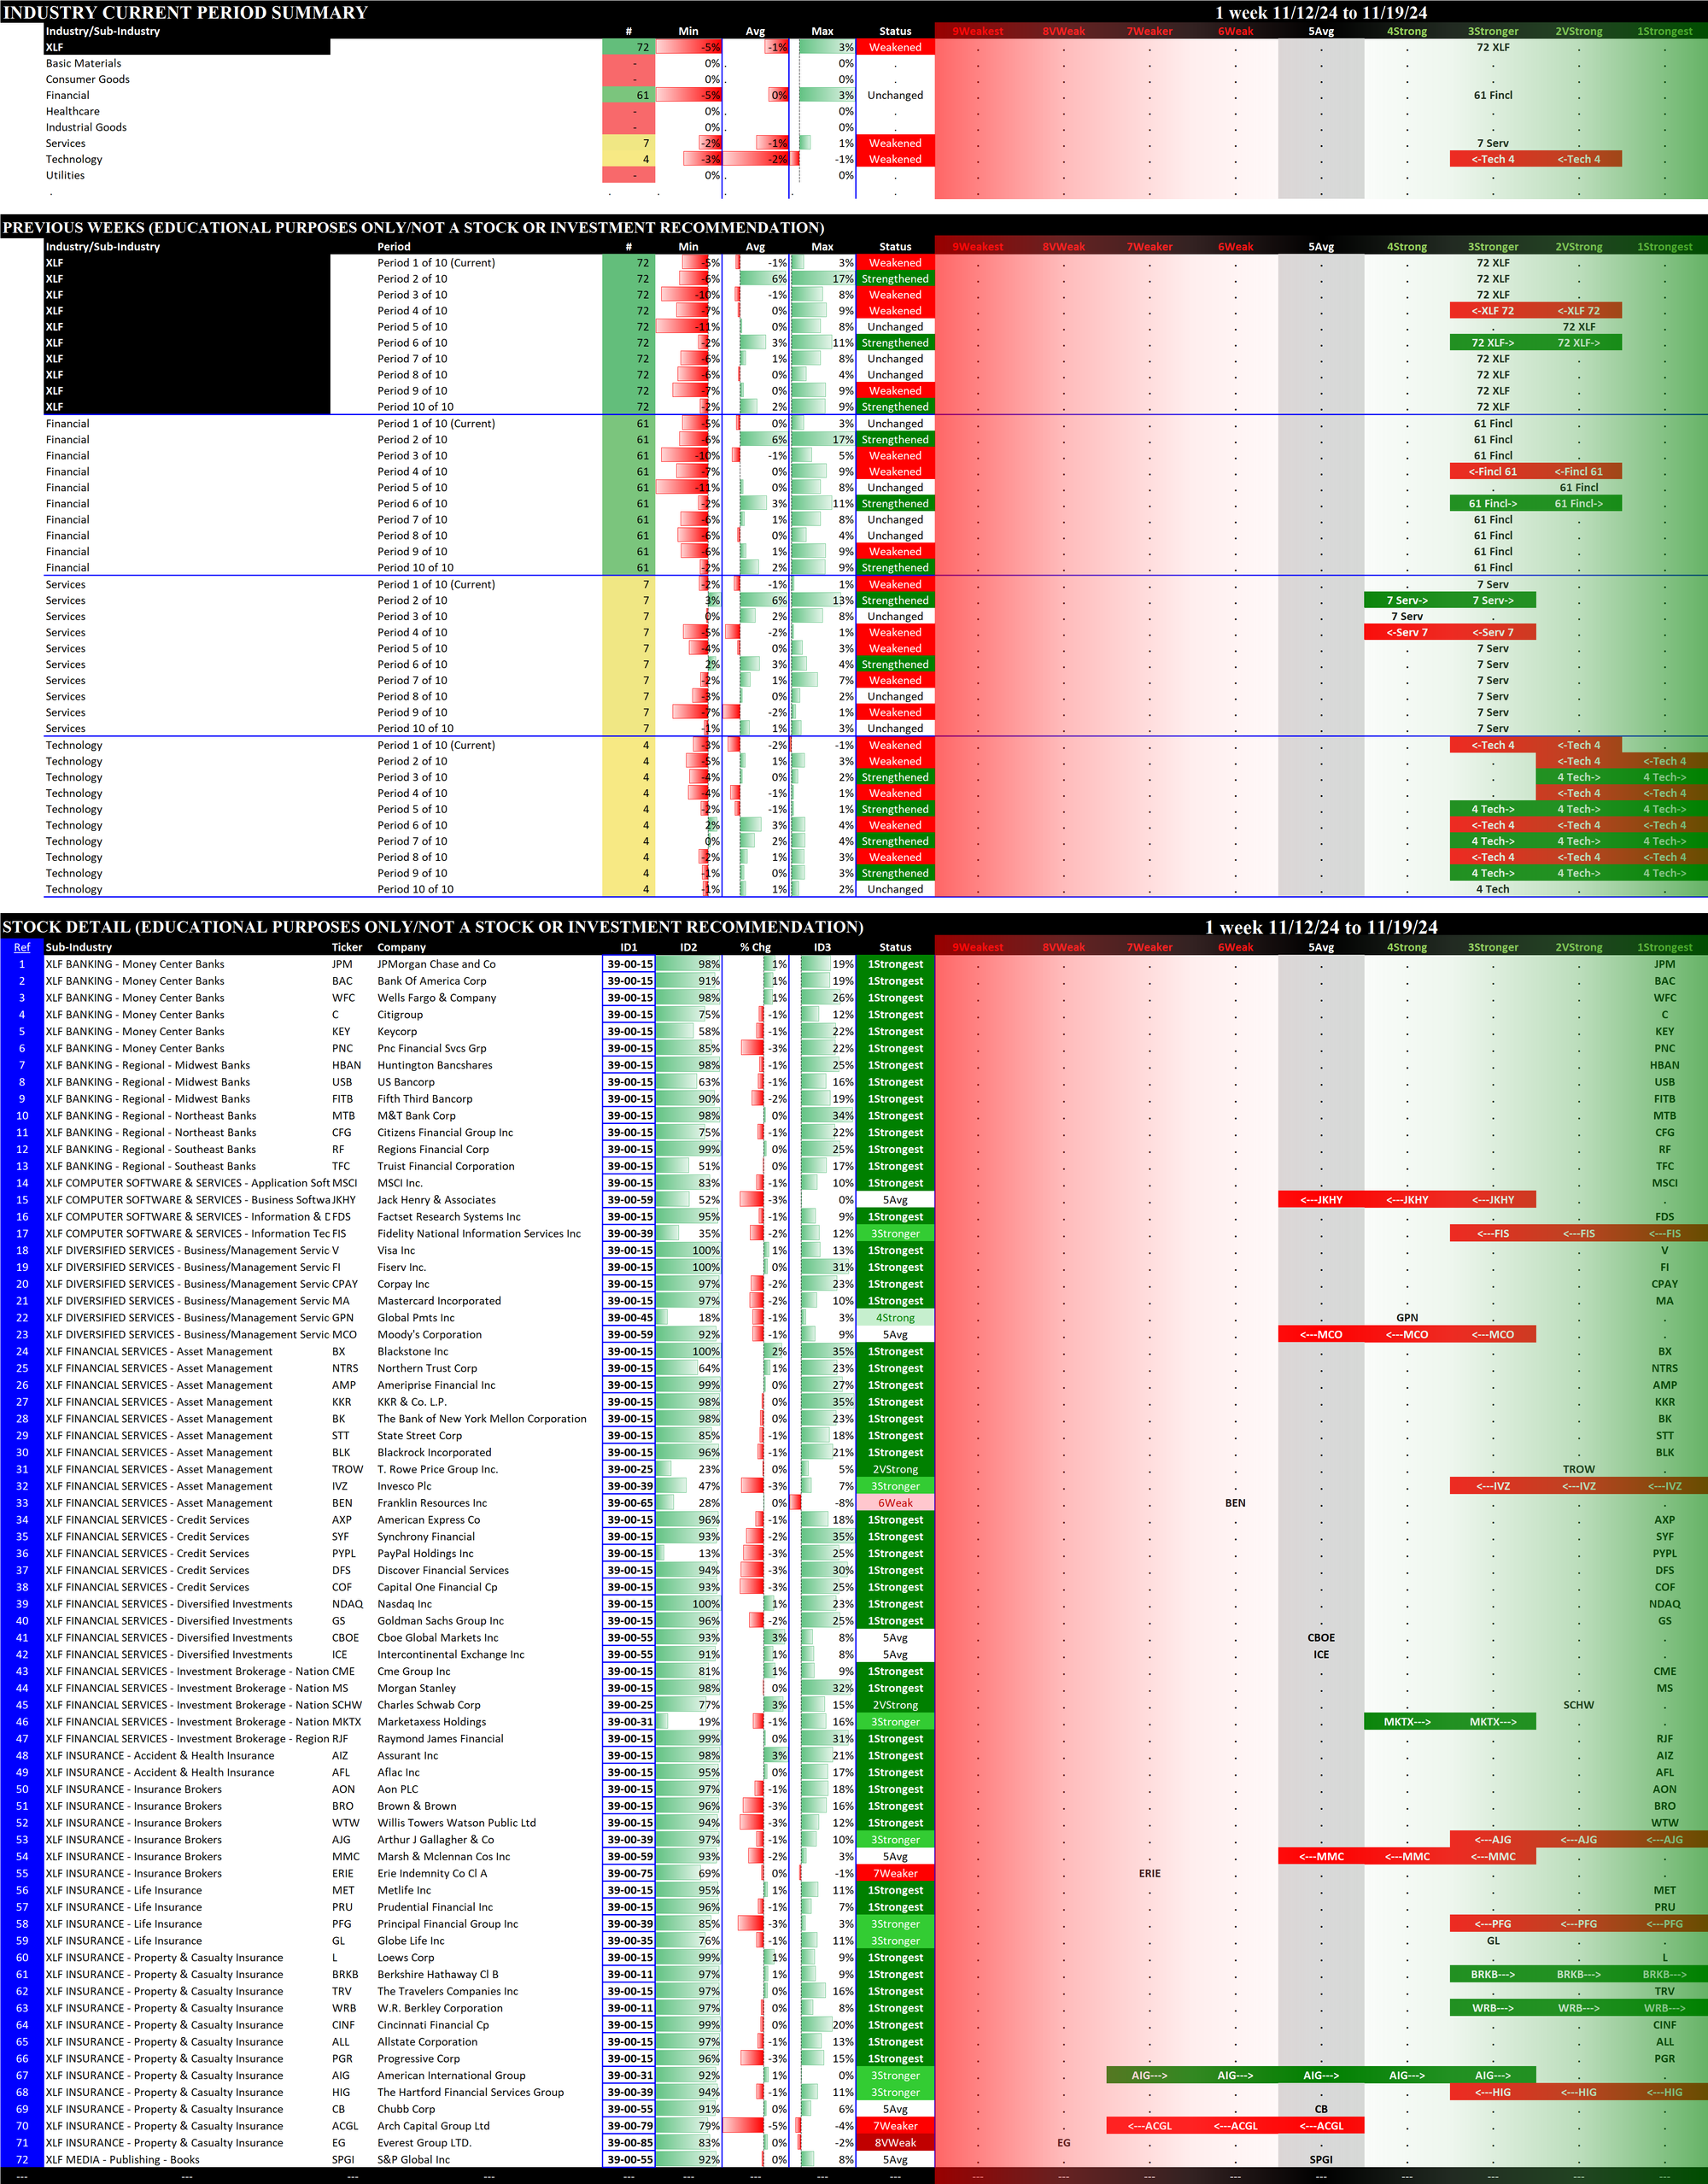
2.4 XLF Financial (72 stocks, large), UNCHANGED at 3Stronger, tied for BEST
Includes financial services; insurance; banks; capital markets; mortgage real estate investment trusts; and consumer finance.
2.5 XLI Industrial (76 stocks, large), UNCHANGED at 3Stronger, tied for BEST
Includes aerospace and defense; industrial conglomerates; marine transportation.
2.6 XLK Technology (69 stocks, large), UNCHANGED at 4Strong
2.7 XLP Consumer Staples (38 stocks, mid-sized), WEAKENED to 6Weak, tied for WORST
2.8 XLRE Real Estate (31 stocks, small/mid-sized), UNCHANGED at 4Strong
2.9 XLU Utilities (31 stocks, small/mid-sized), UNCHANGED at 3Stronger, tied for BEST
Includes electric utilities; water utilities; multi-utilities; independent power and renewable electricity producers; and gas utilities.
2.10 XLV Health Care (61 stocks, large), WEAKENED to 6Weak, tied for WORST
Includes pharmaceuticals; health care equipment & supplies; health care providers & services; biotechnology; life sciences tools & services; and health care technology.
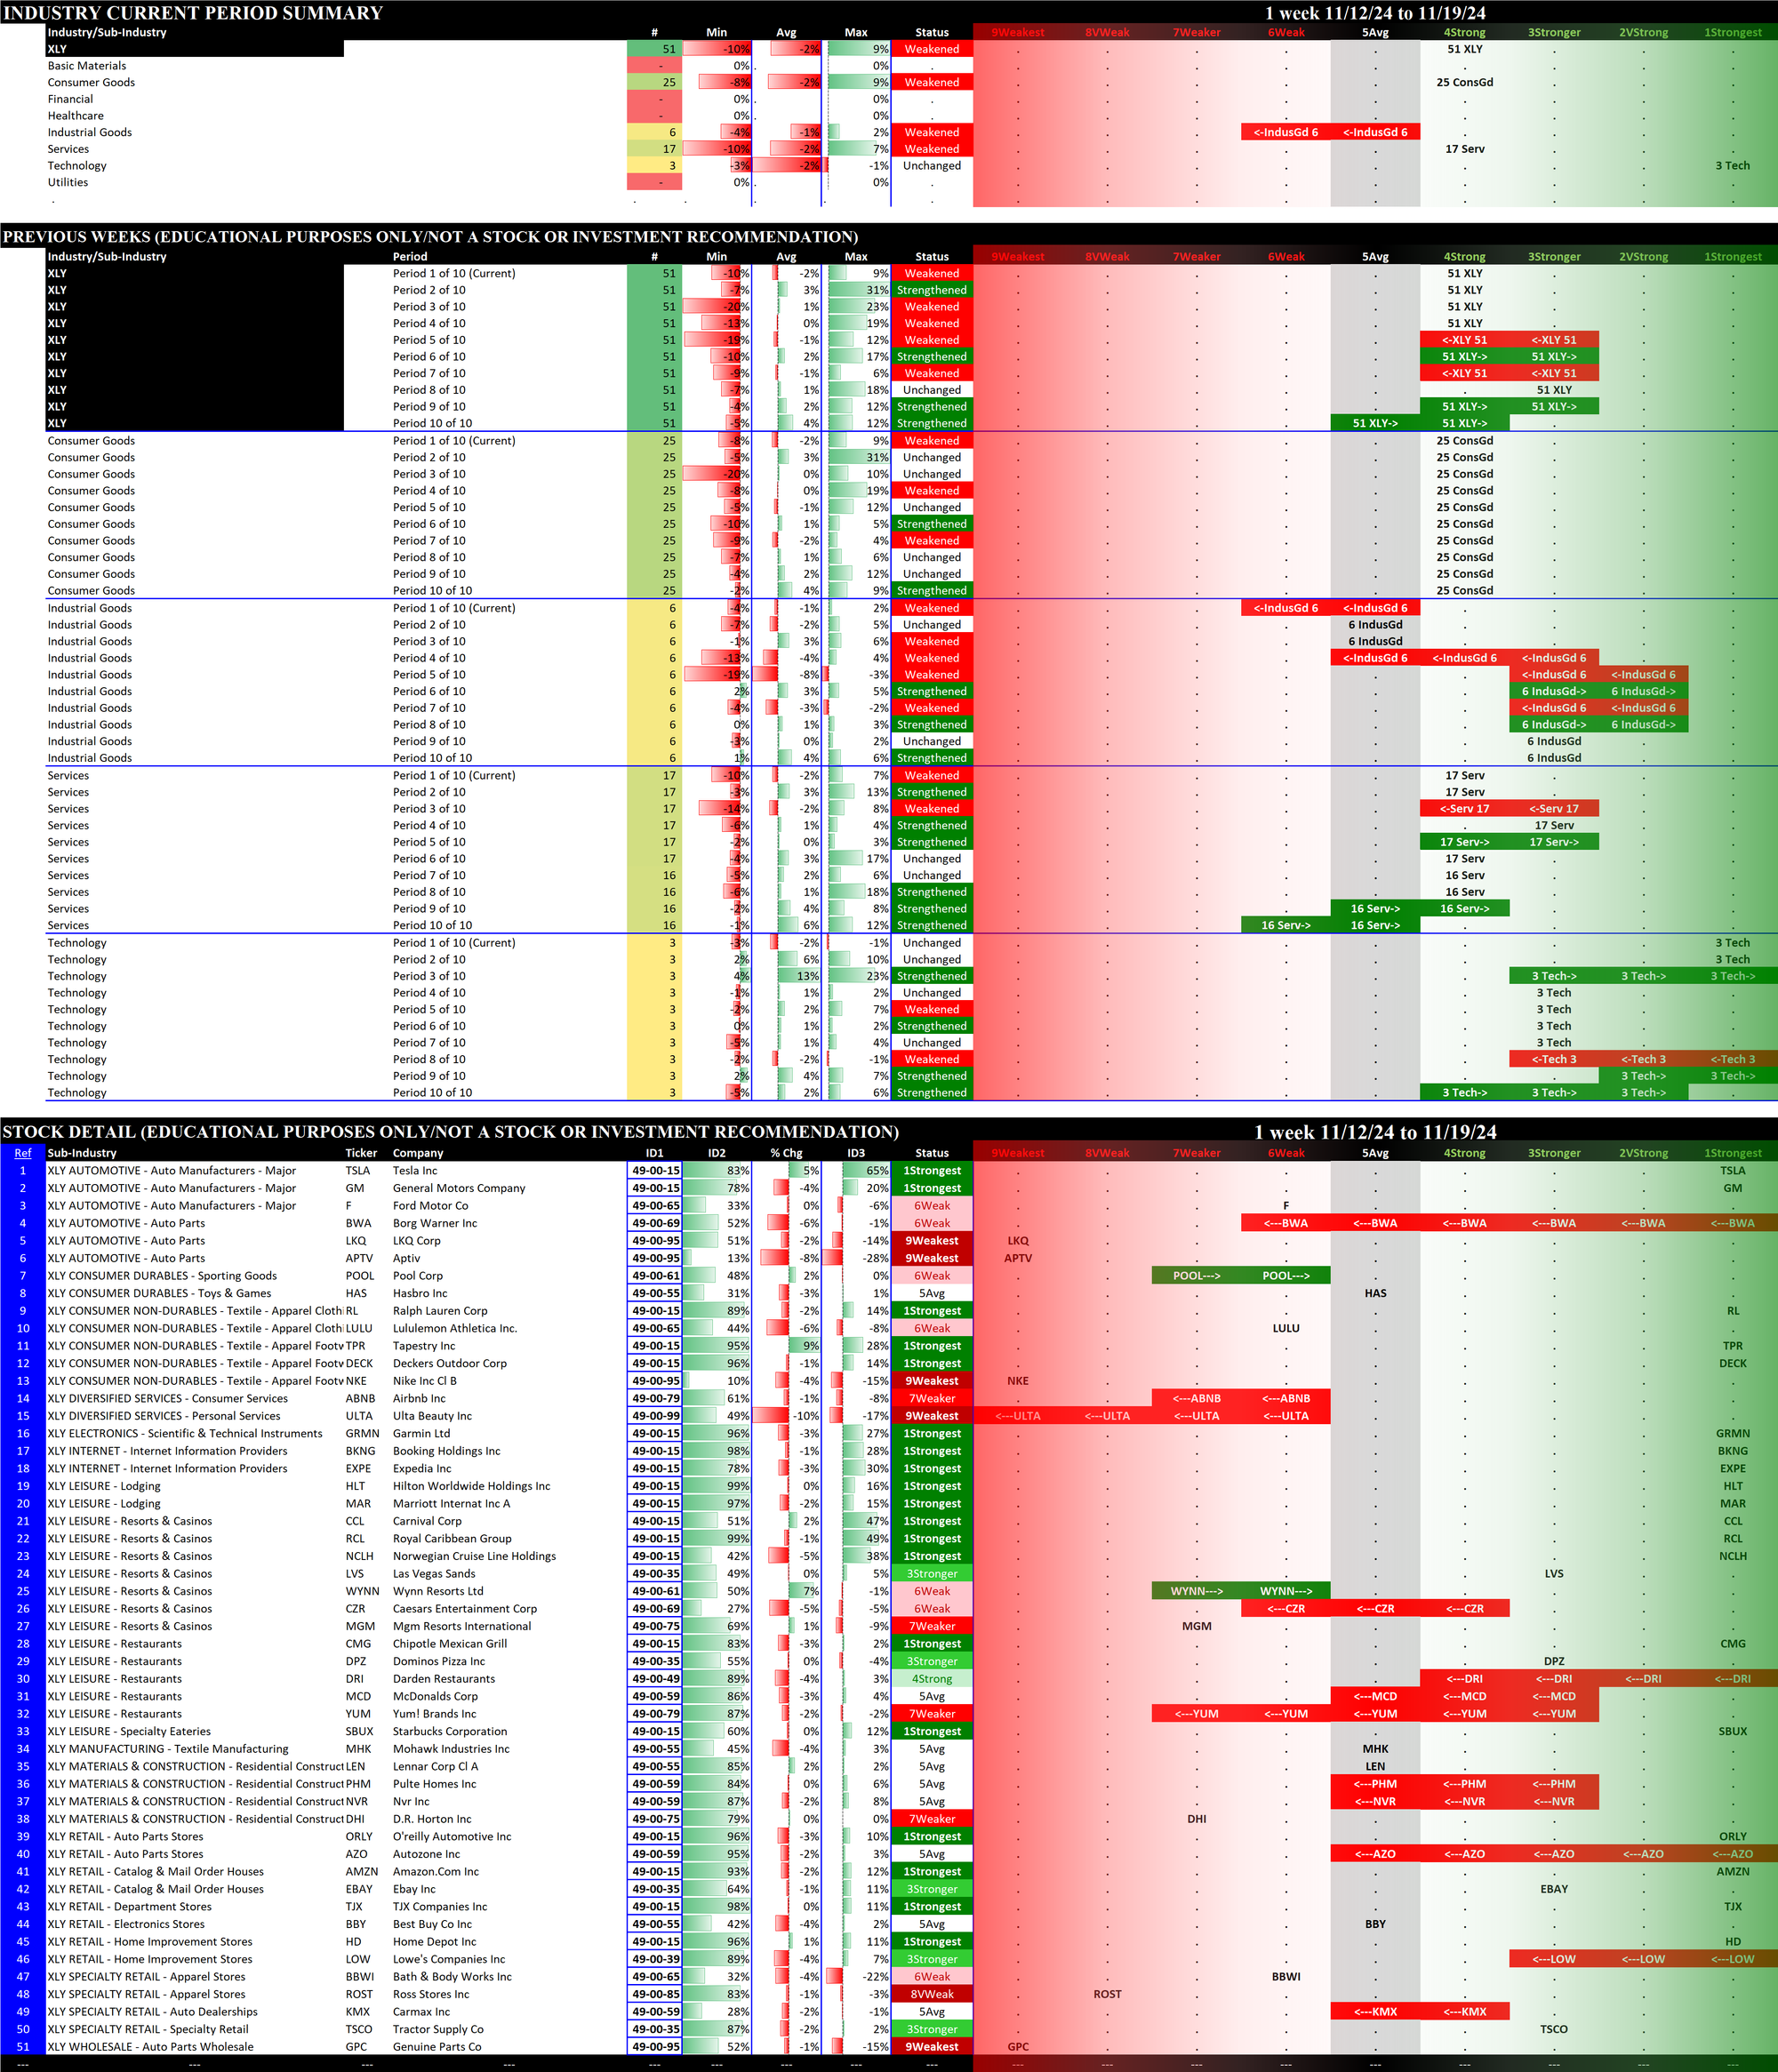
2.11 XLY Consumer Discretionary (51 stocks, mid-sized/large),UNCHANGED at 4Strong
3. Stock Detail
The downloadable PDF below lists all component stocks in order of first Strongest to Weakest ETF and second Strongest to Weakest Stock. The difference between this report and the 11 ETF stock listings above is this report consolidates all component stocks whereas the above listings are segregated by ETF.
Download the following Excel file if you are interested in sorting results yourself.