SMO Exclusive: The Market Strength Score and Sector Risk Gauge at the 2009 and 2020 Market Bottoms
The Purpose of this Post
This system is predicated on the concept that market and sector forces are more important than individual stock factors on the performance of individual stocks.
Individual stock factors are unquestionably important. Yet, empirically, most stocks do what the market does - common estimates are that 3 of 4 stocks rise in market rallies while up to 9 in 10 fall in market declines. (In turn, logically, the more homogeneous the underlying stock grouping - sectors, industries, sub-industries - the more the component stocks move in concert).
The key takeaway: optimal market performance depends on understanding market and sector forces first and then selecting individual stocks based on this understanding.
This post provides the current Market Strength Score status and illustrates the value of the Stock Market Organizer methodology's unique tools - the Market Strength Score and Sector Risk Gauge - in understanding the environment at critical market bottoms.
Current Market Status
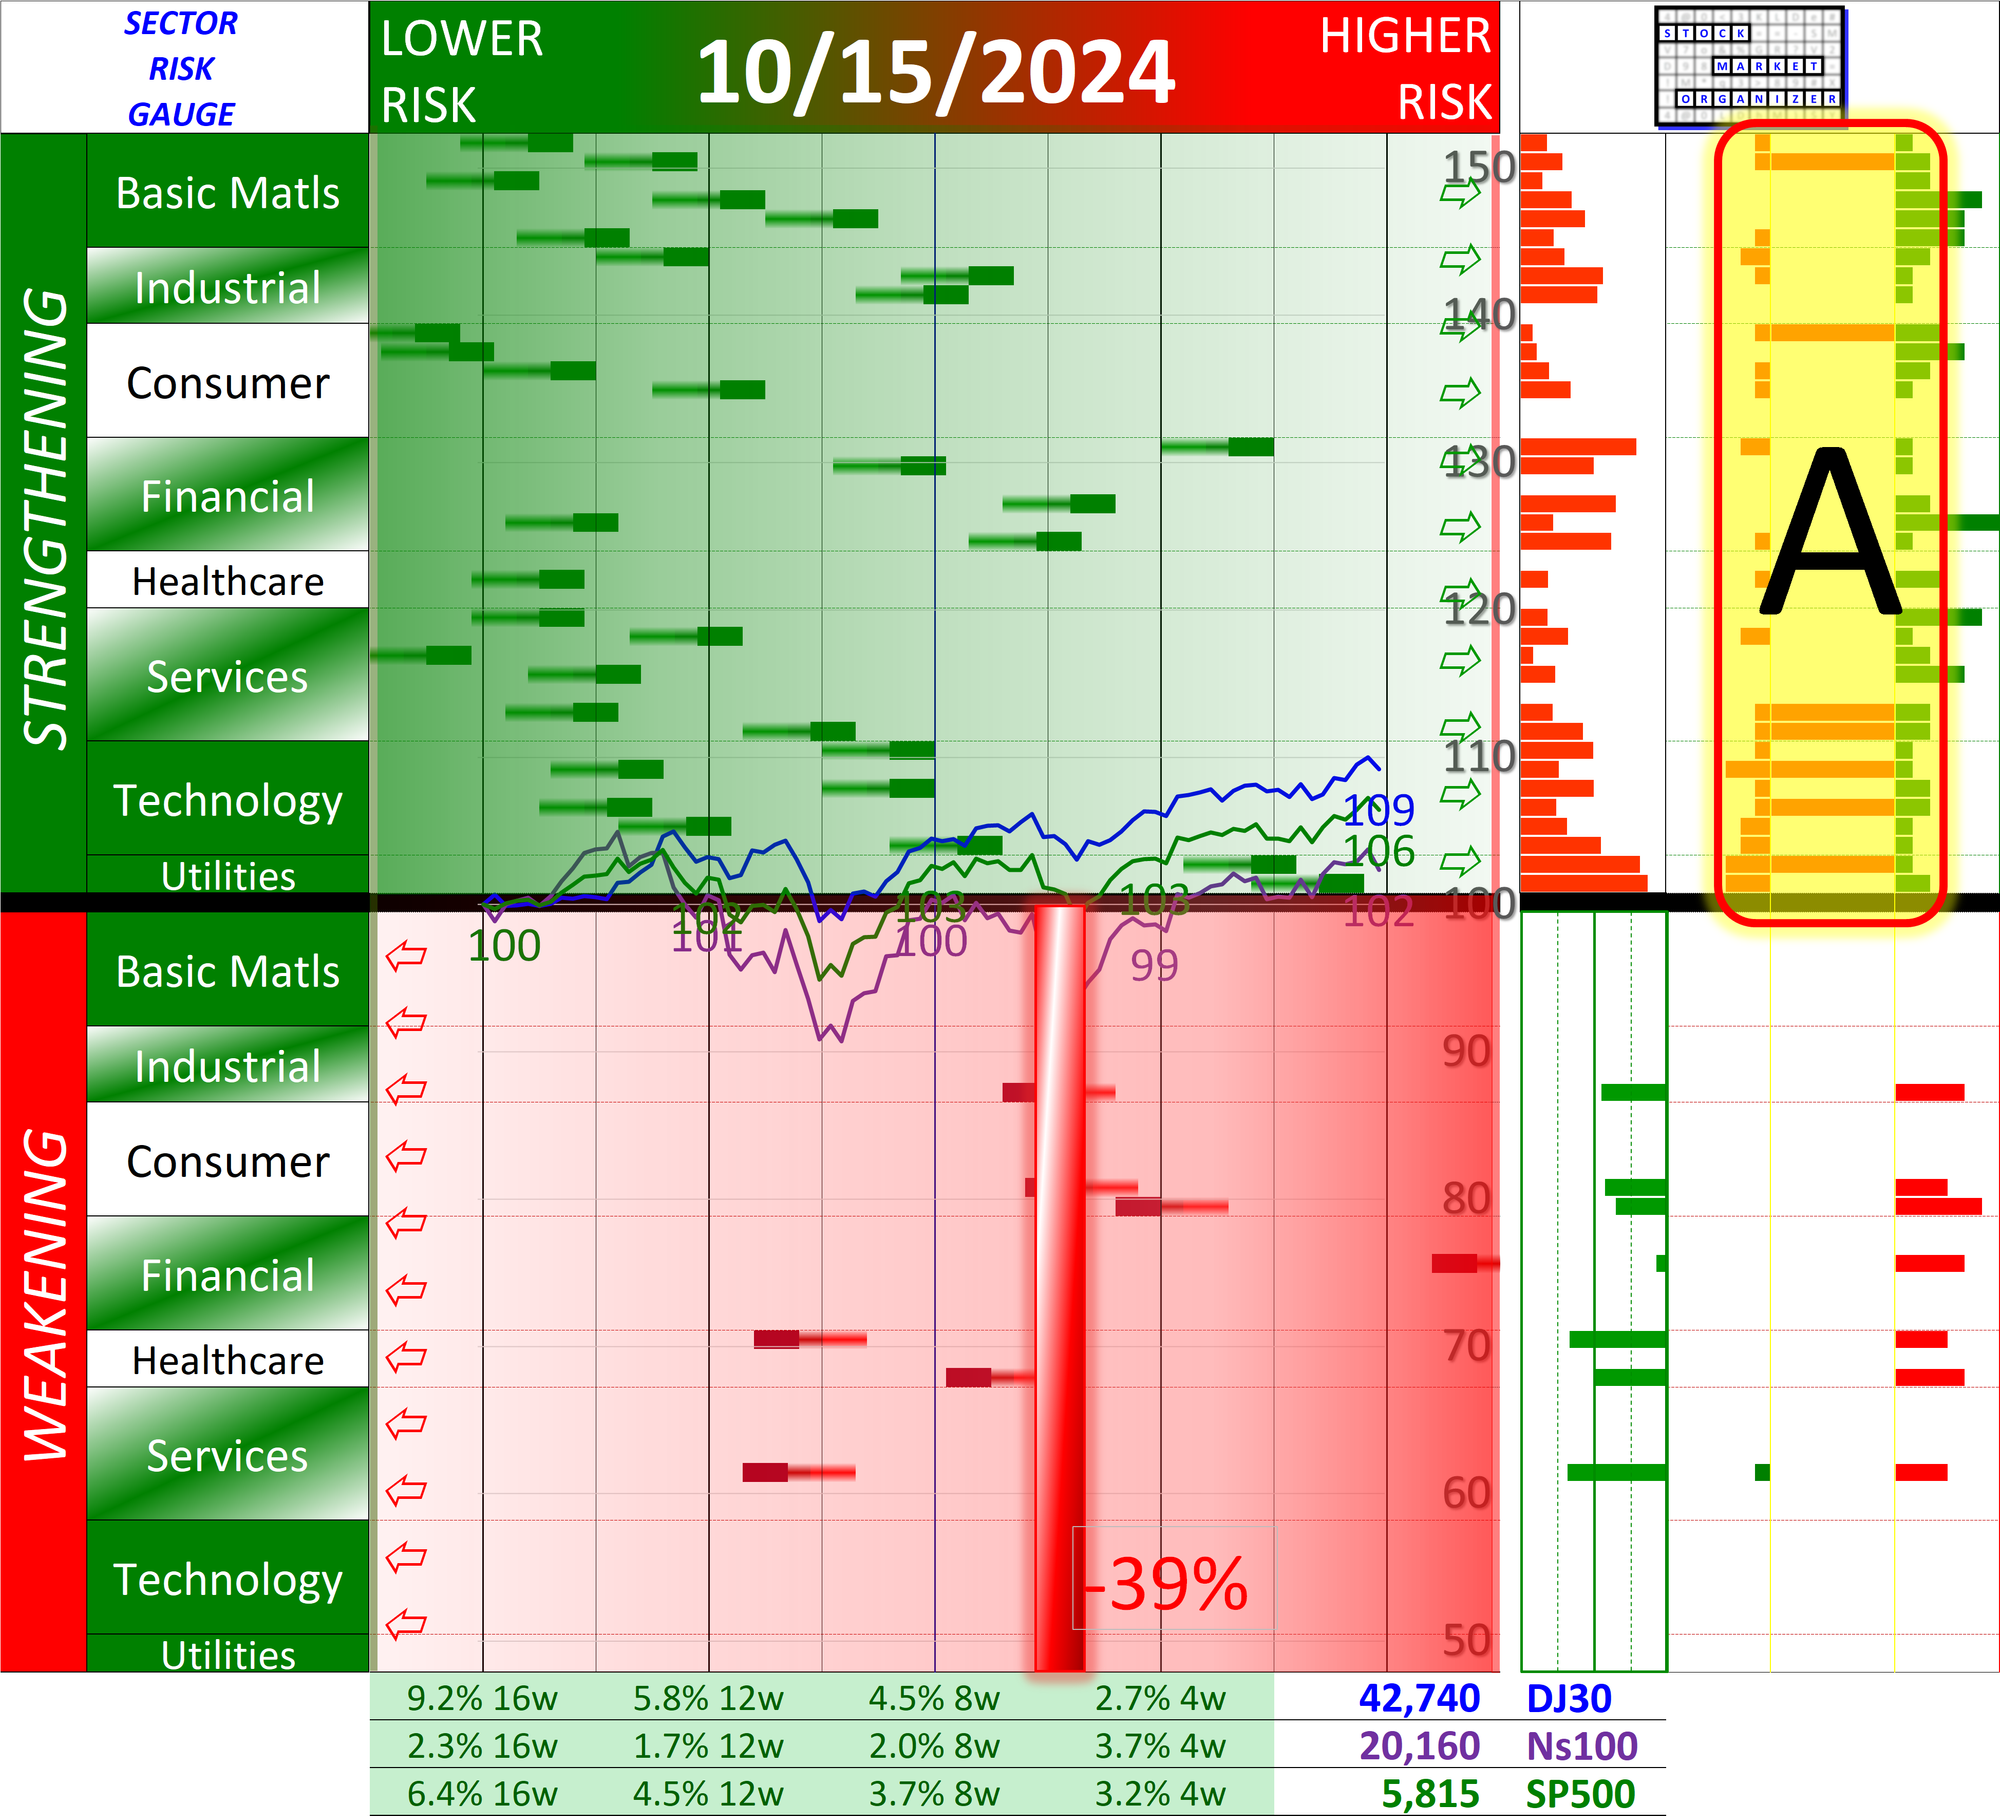
No New Longs because the current Stock Market Organizer Market Strength Score is NEGATIVE at -39% as of 2024-10–15 (scale is -100% to +100%).
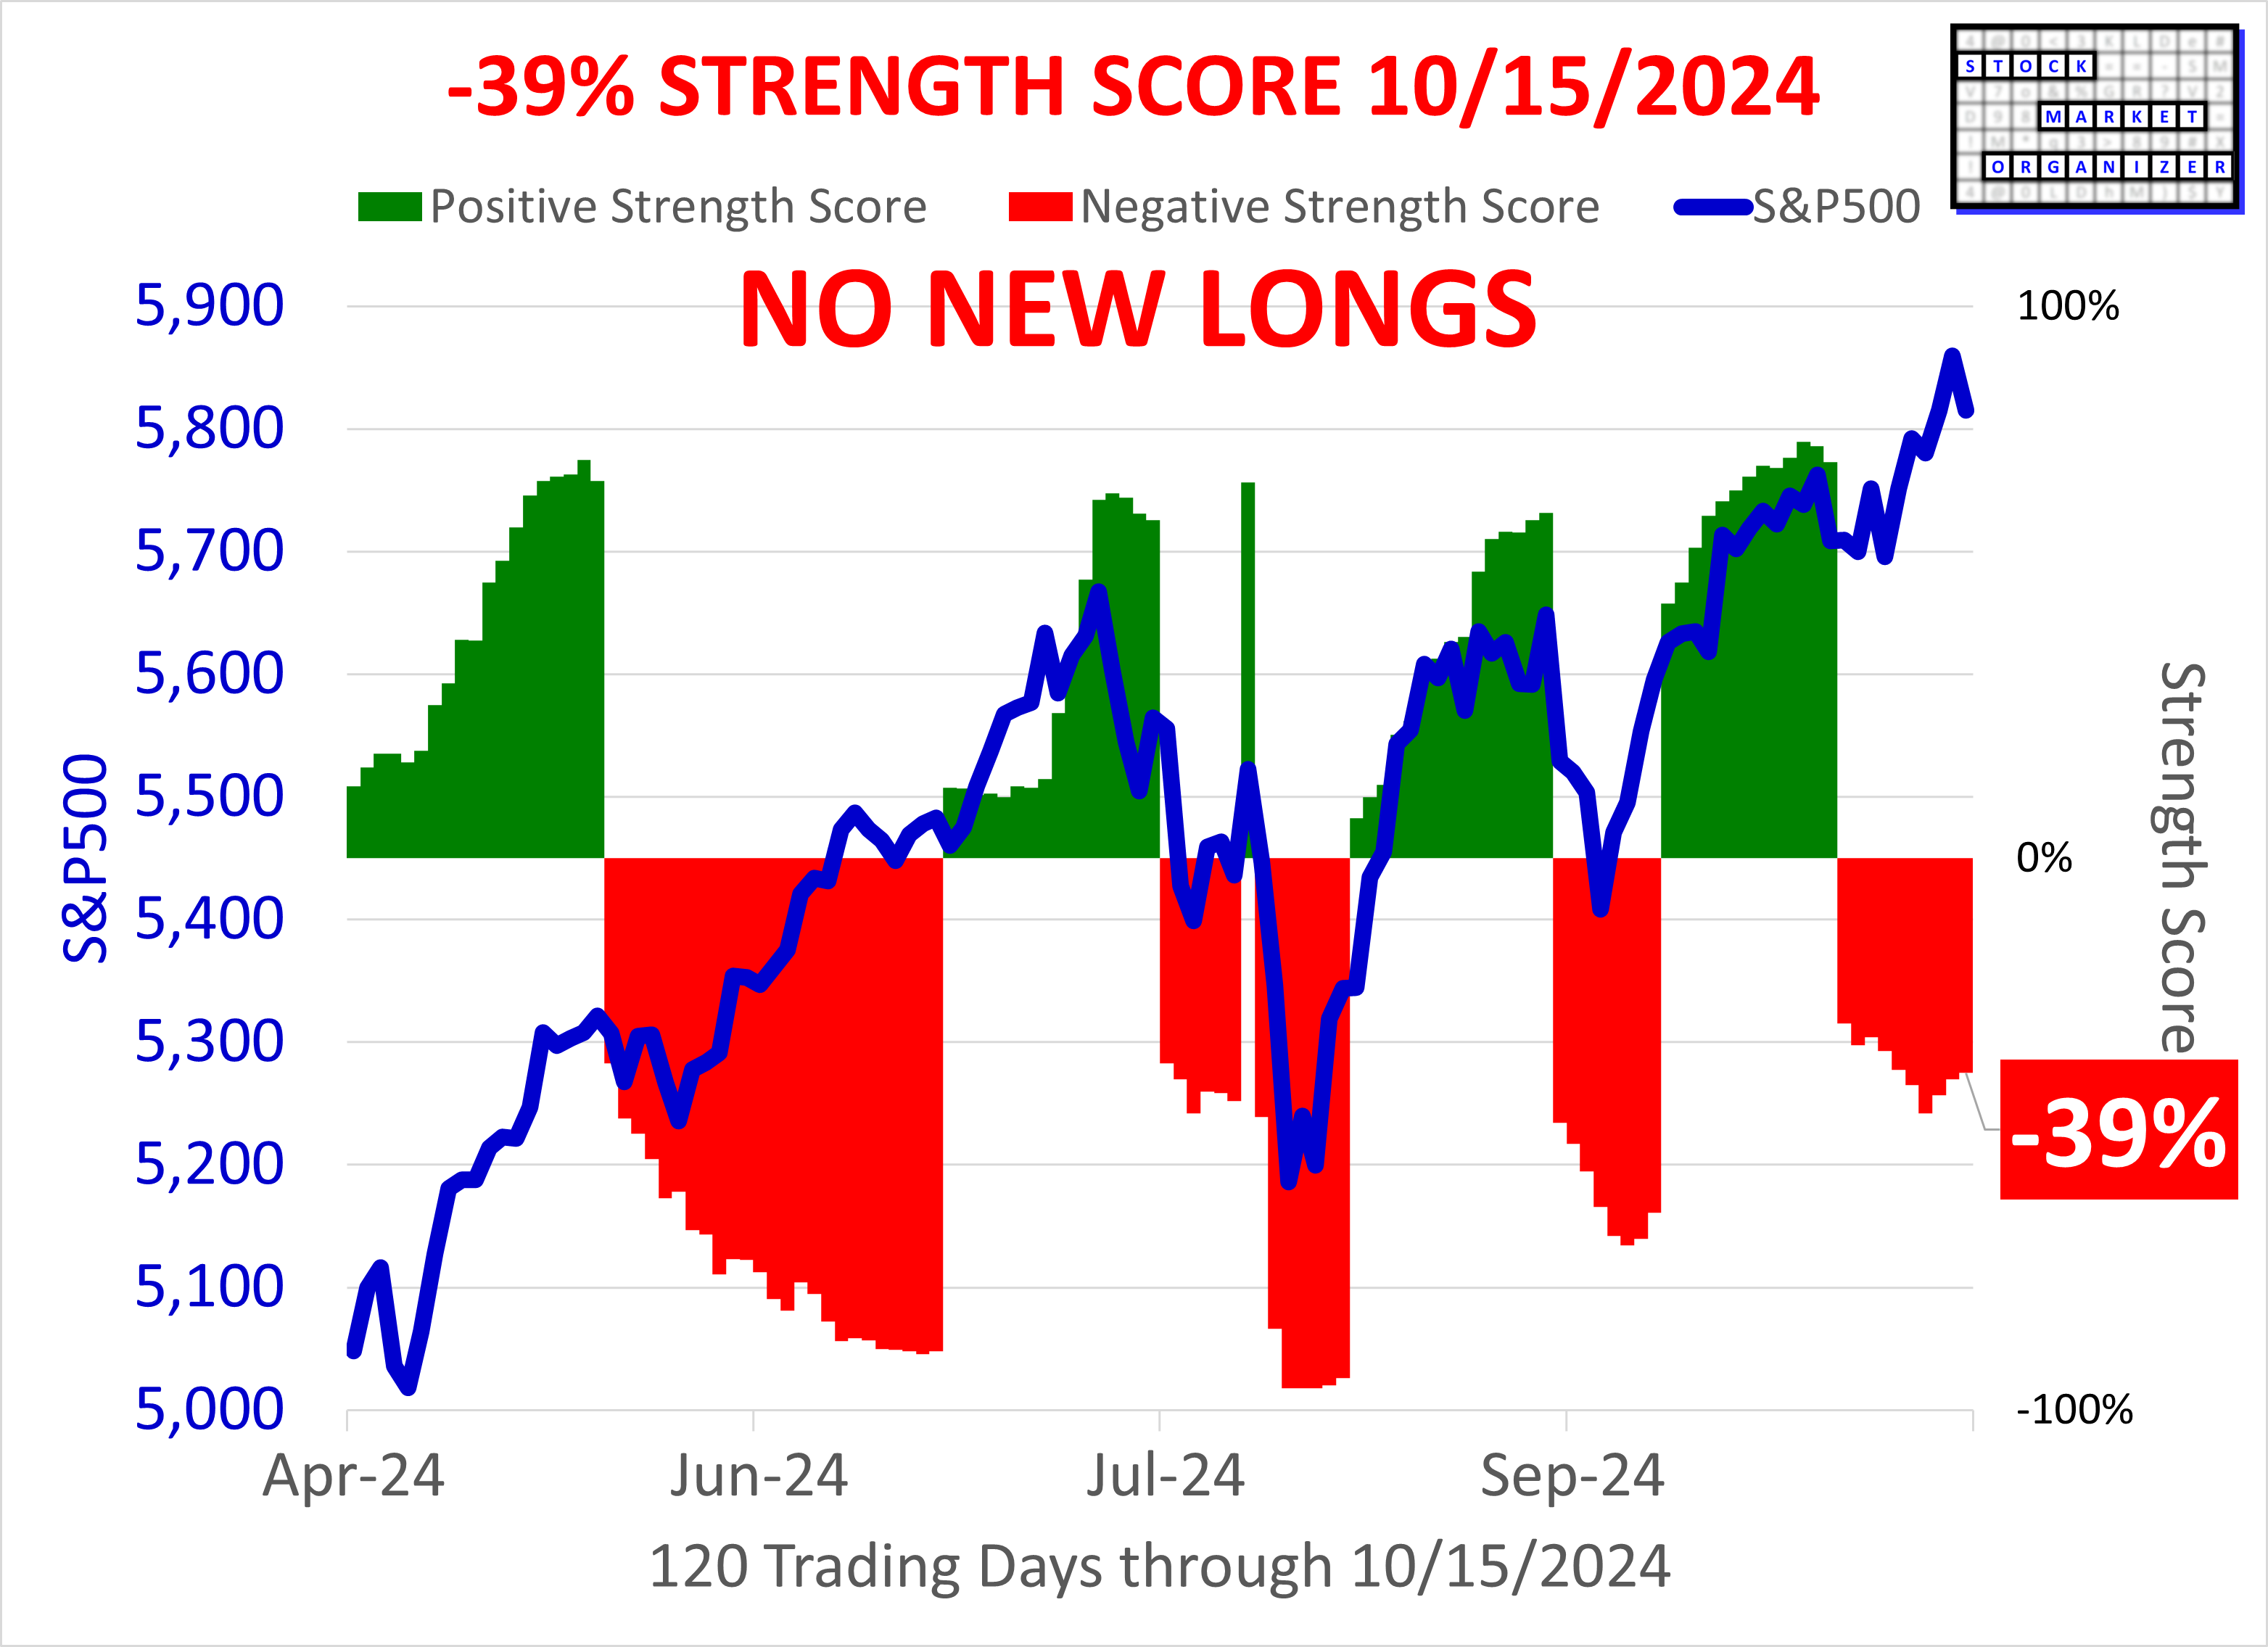
- The -39% reading is considered mid-range.
- Anything can happen in the market at any time for any reason but this "mid-range" reading implies there is slack in the rubber band (though less than before) and a developing decline would have room to run. Figures closer to -100% would imply less room to run.
- Logical question: how can the market be at/near all time highs yet this reading is negative? Because it reflects nascent weakening underneath the surface of the index readings. This nascent weakening hasn't developed into a full-blown decline, yet it has been objectively measured based on stock-by-stock measurements and historically such readings have warranted caution.
Why Do You Care?
This system provides helpful market- and sector- level insights that can help enhance overall portfolio performance through an objective understanding of the current environment.
See below for details of Market Strength Scores and Sector Risk Gauge readings at two key market bottoms.
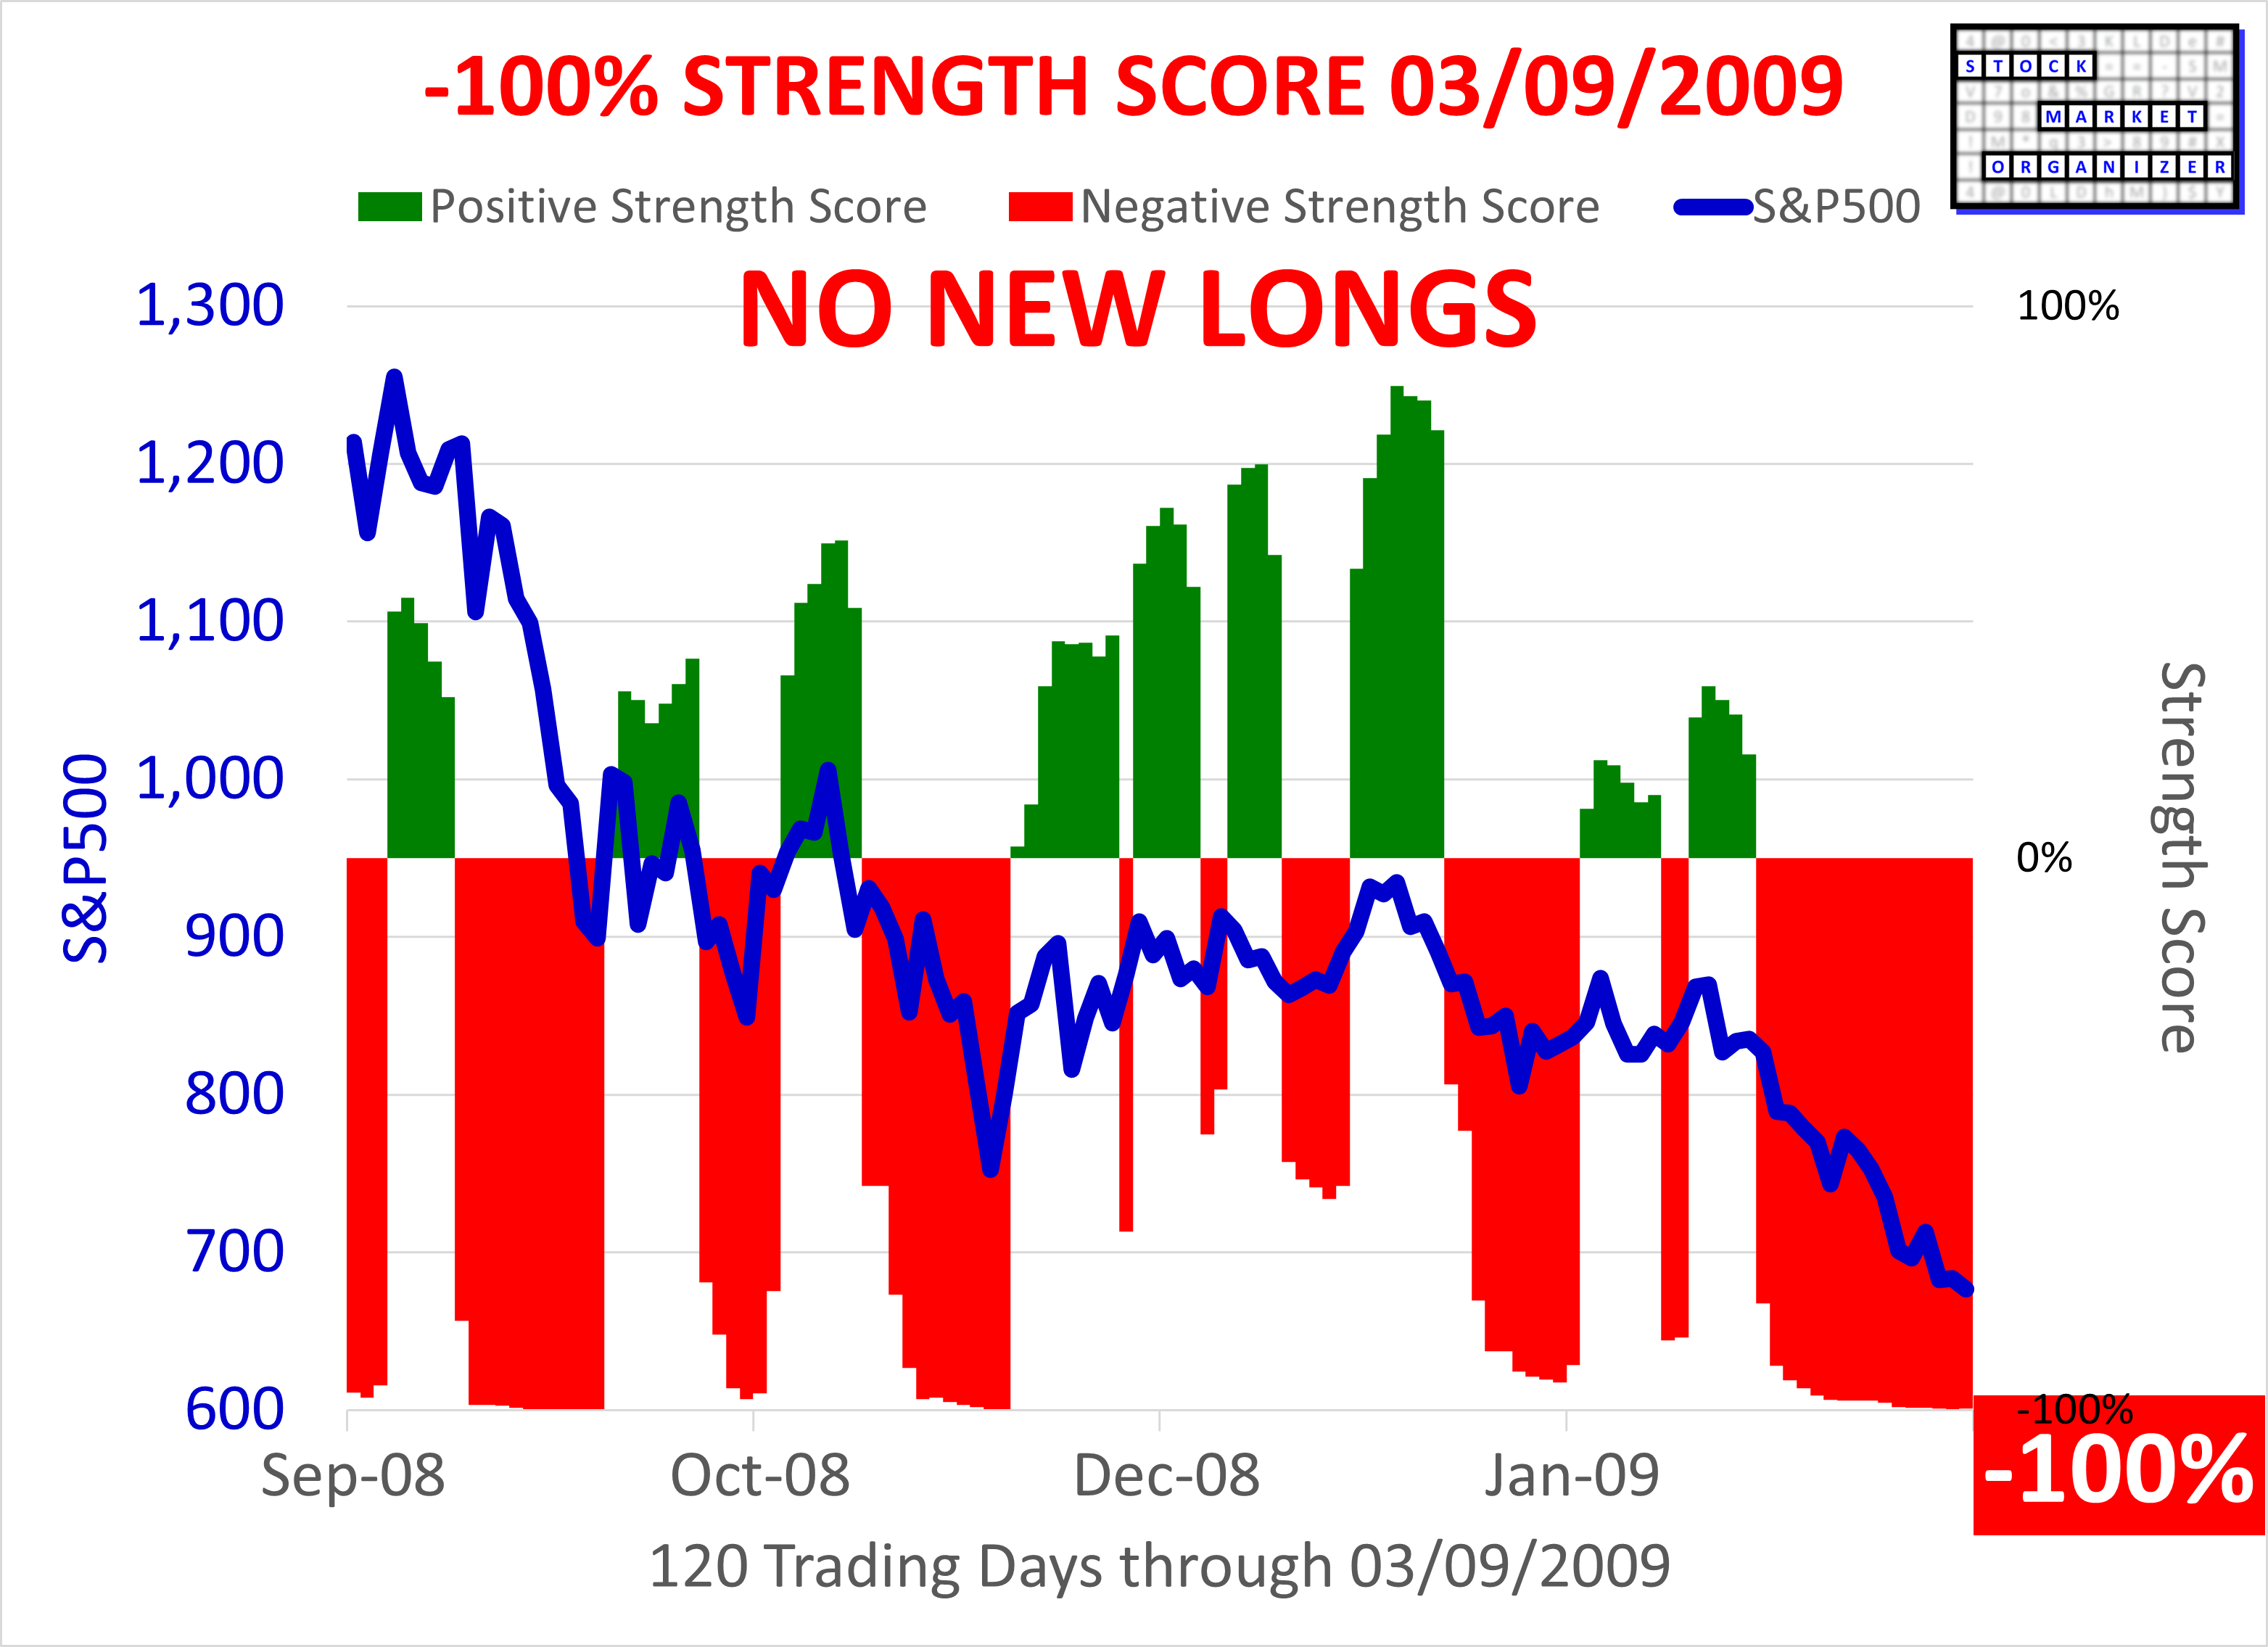
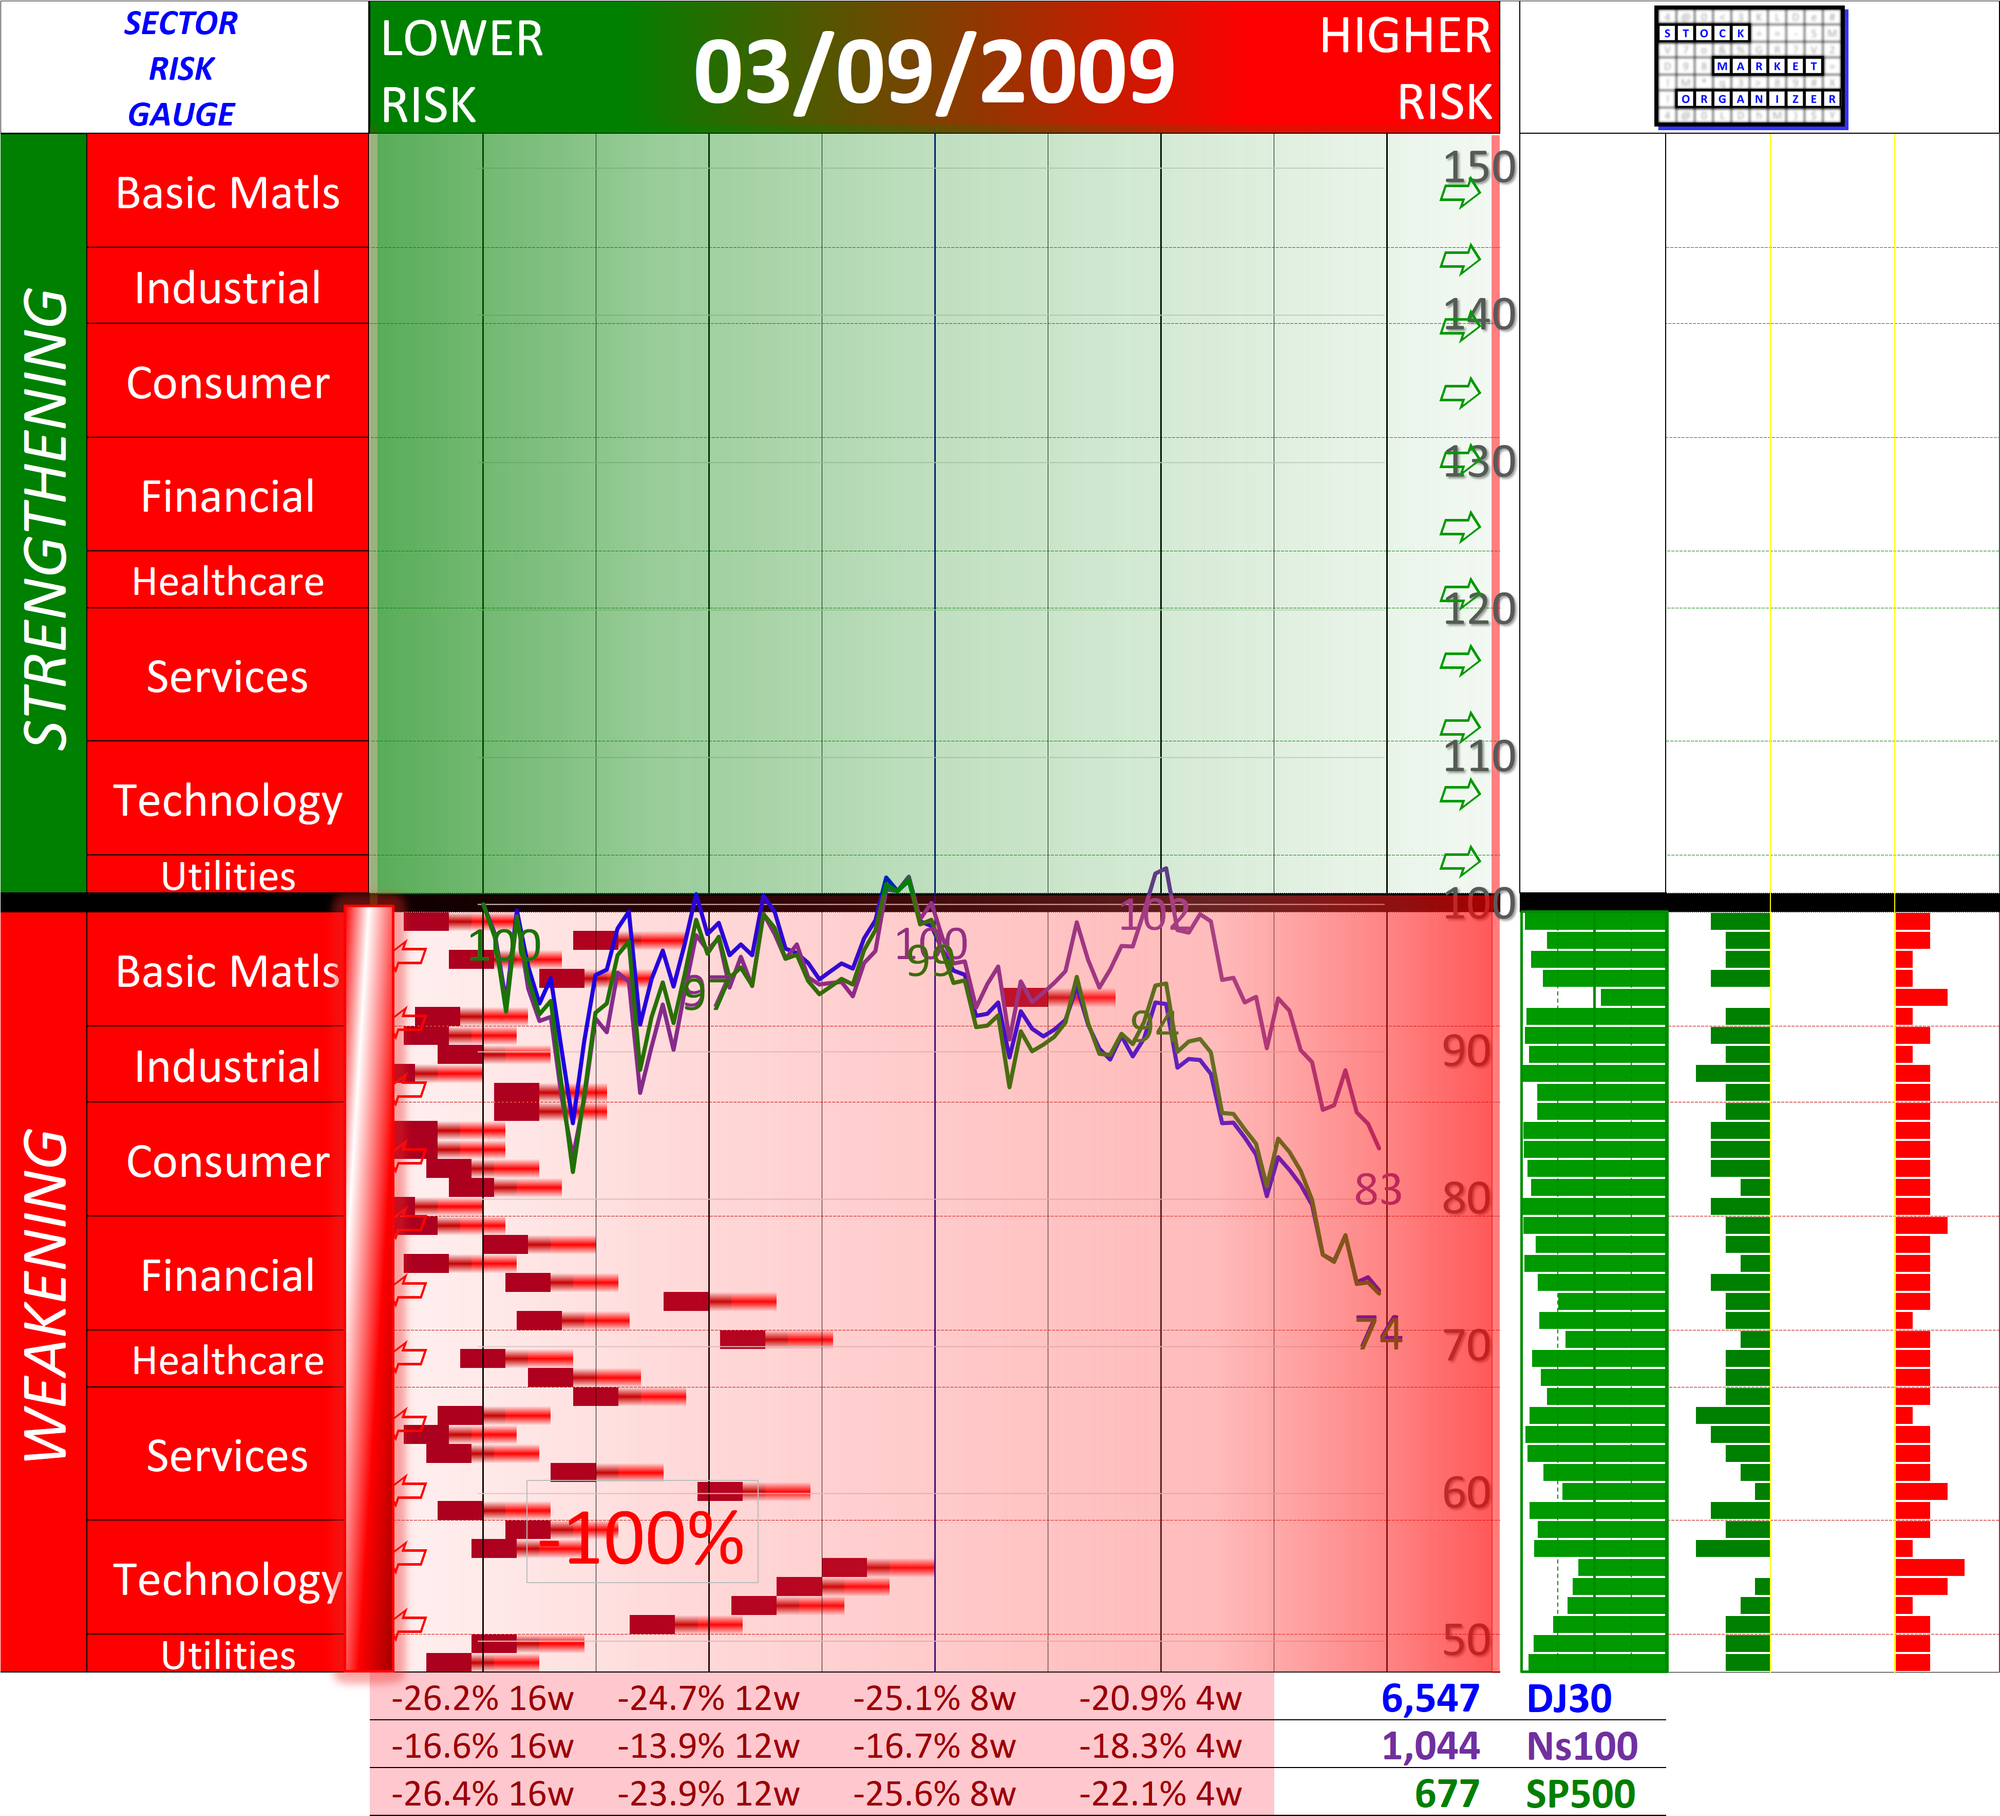
The Great Financial Crisis Bottom March 9, 2009 (-100% Market Strength Score) to March 10, 2009 (+2% Market Strength Score)
First, the bad day:
The corresponding Sector Risk Gauge, -100% Market Strength Score:
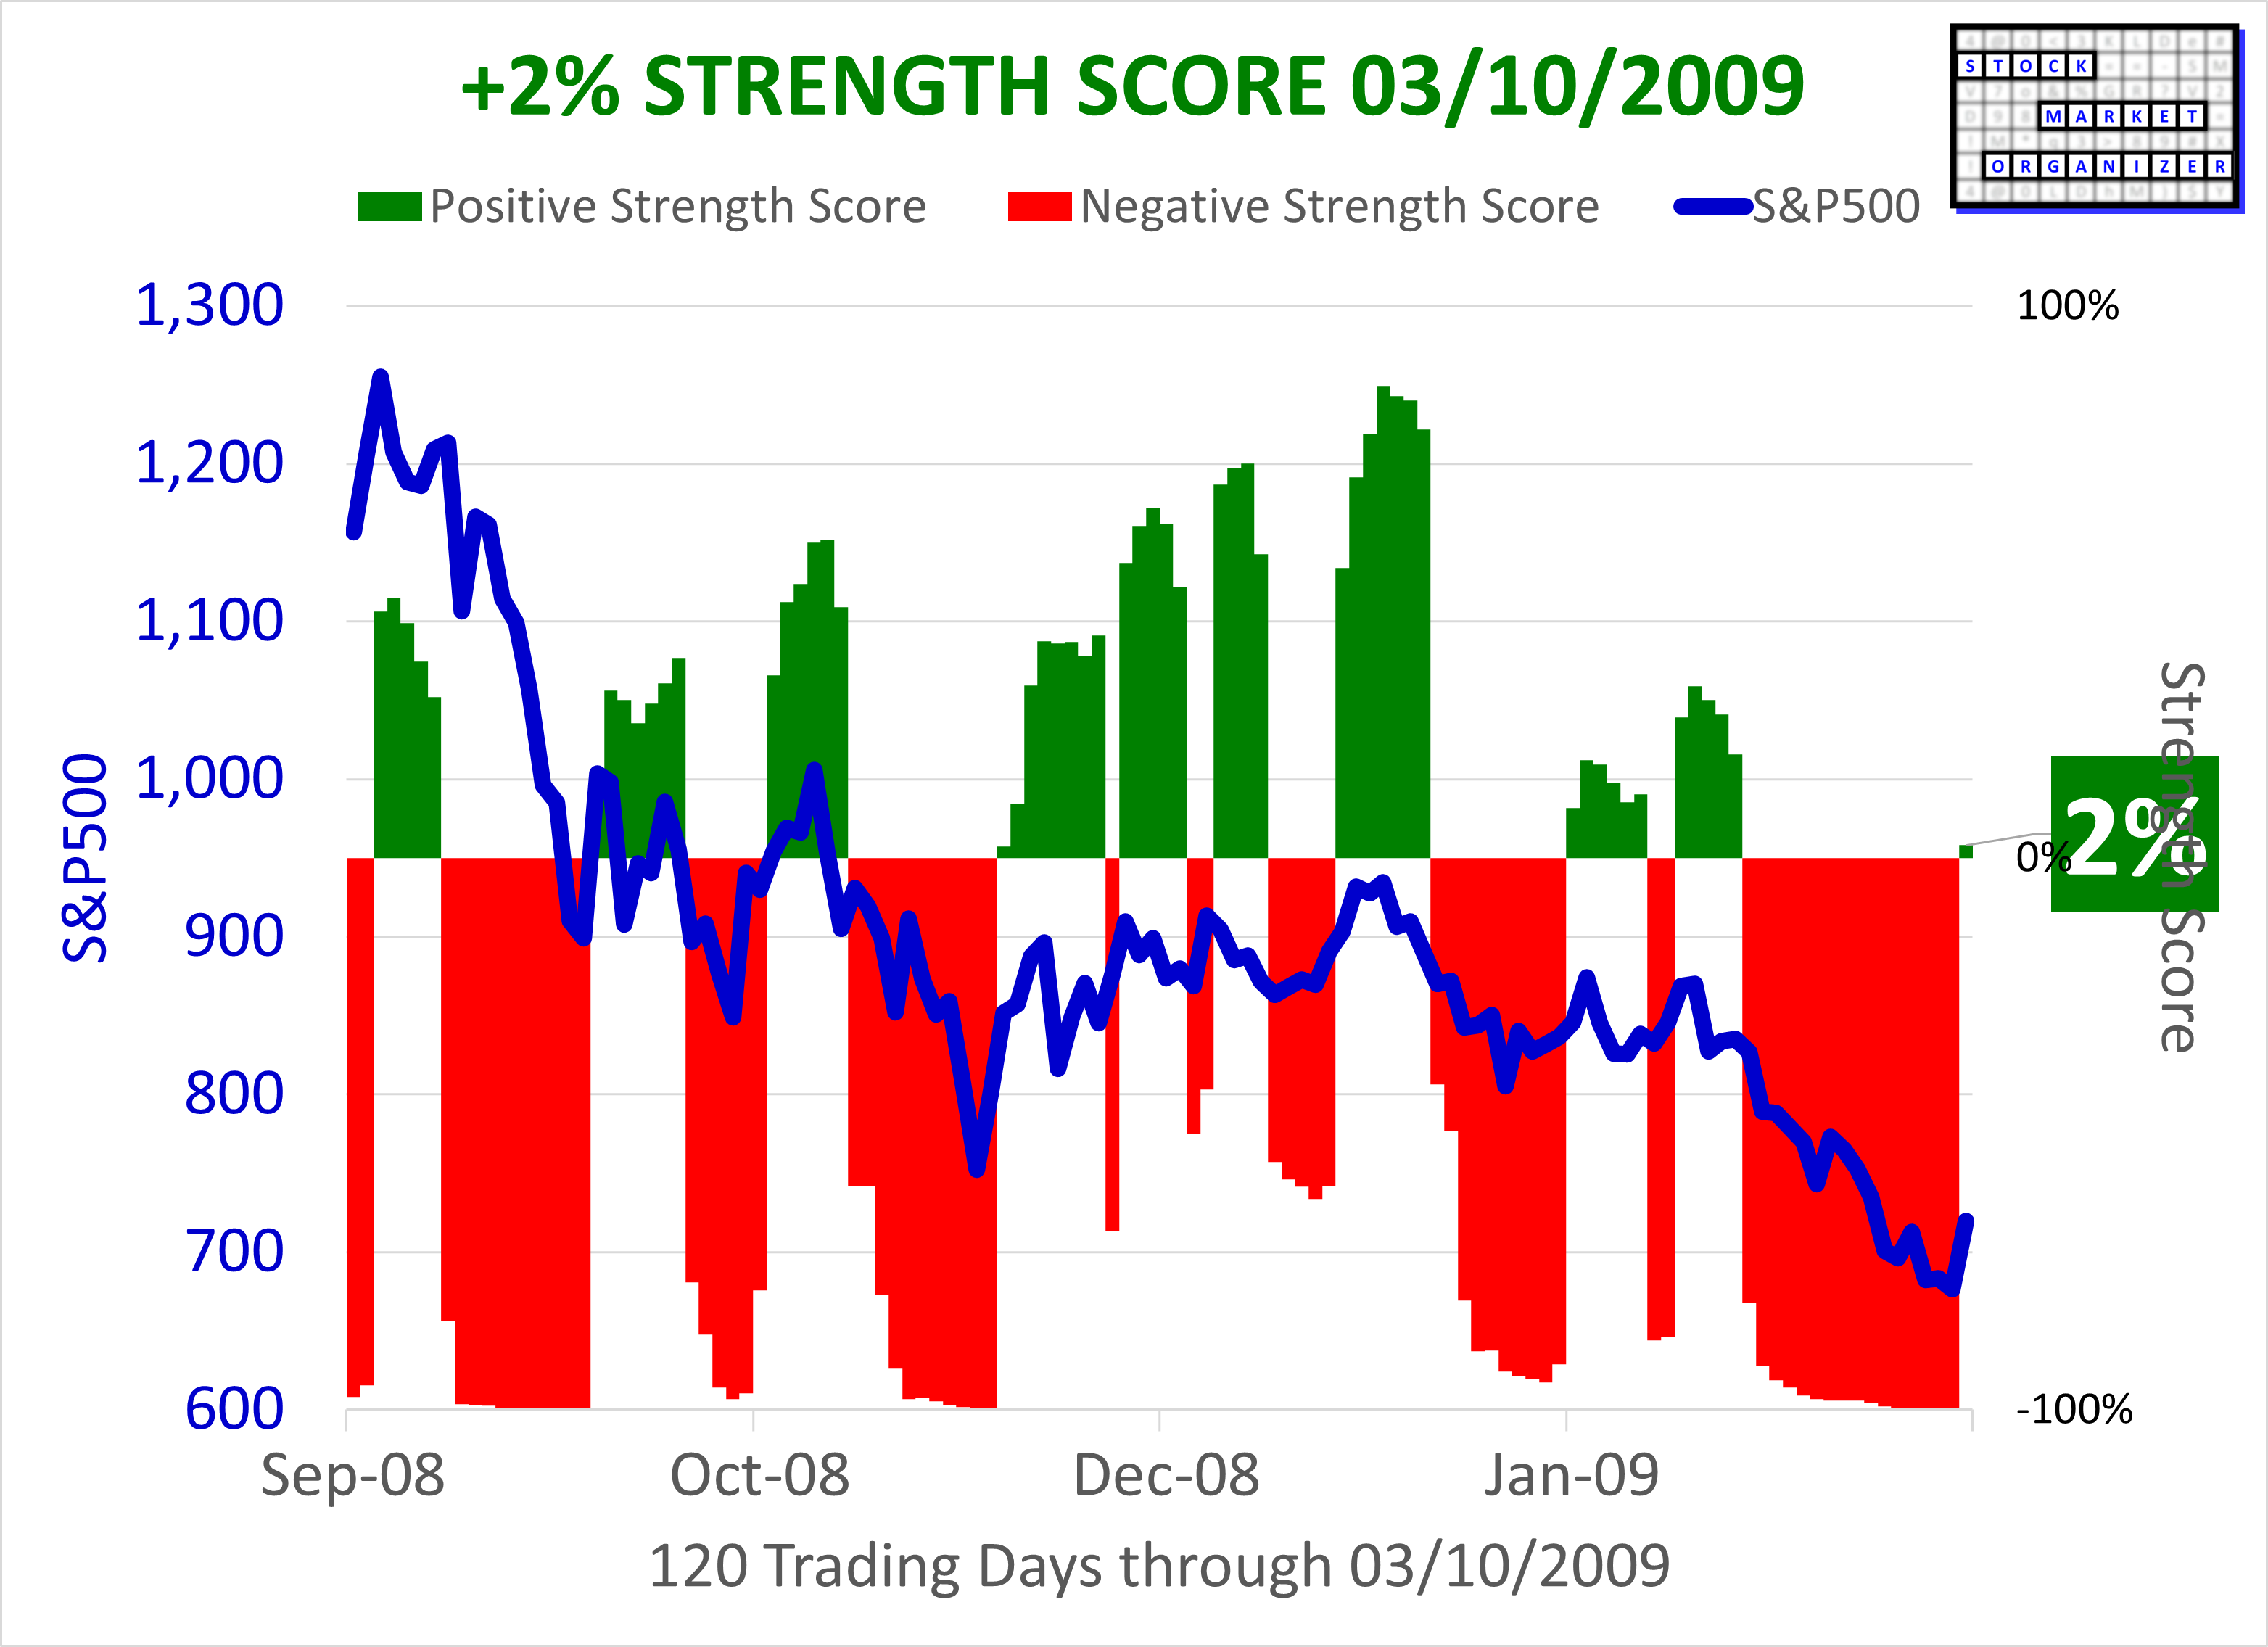
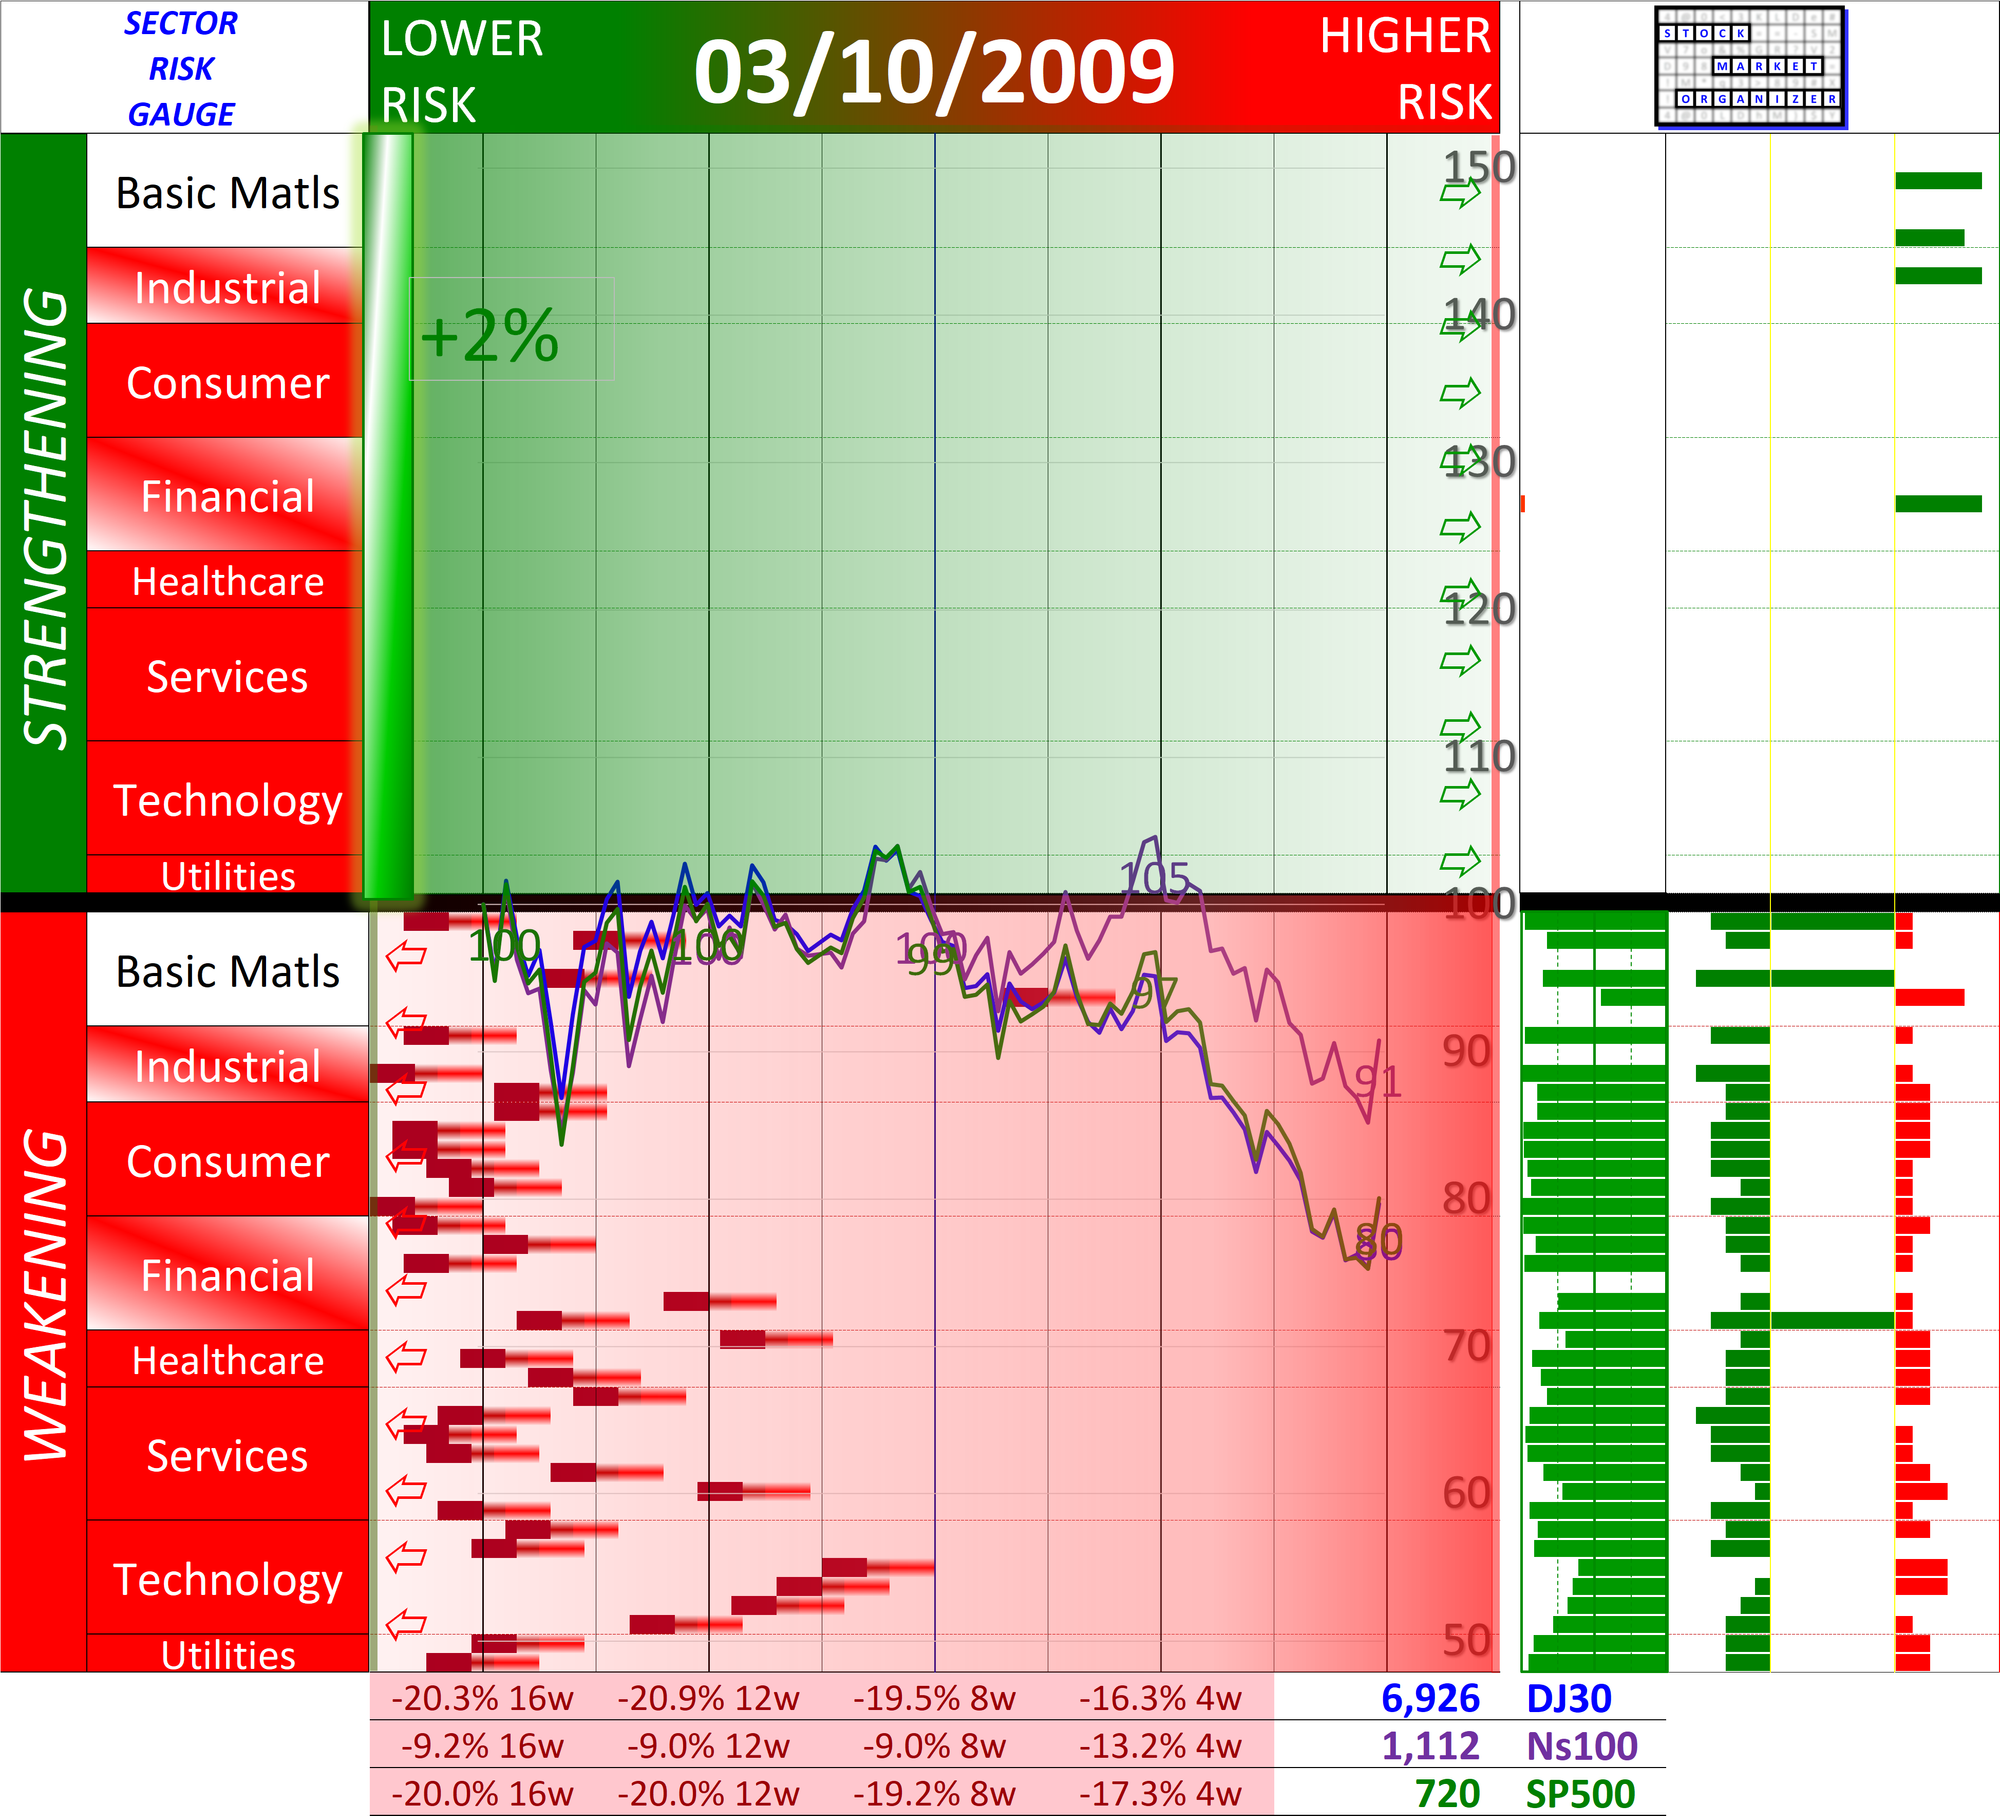
Next, the conversion to a positive environment with a +2% Market Strength Score March 10, 2009:
Corresponding Sector Risk Gauge March 10, 2009 +2% Market Strength Score:
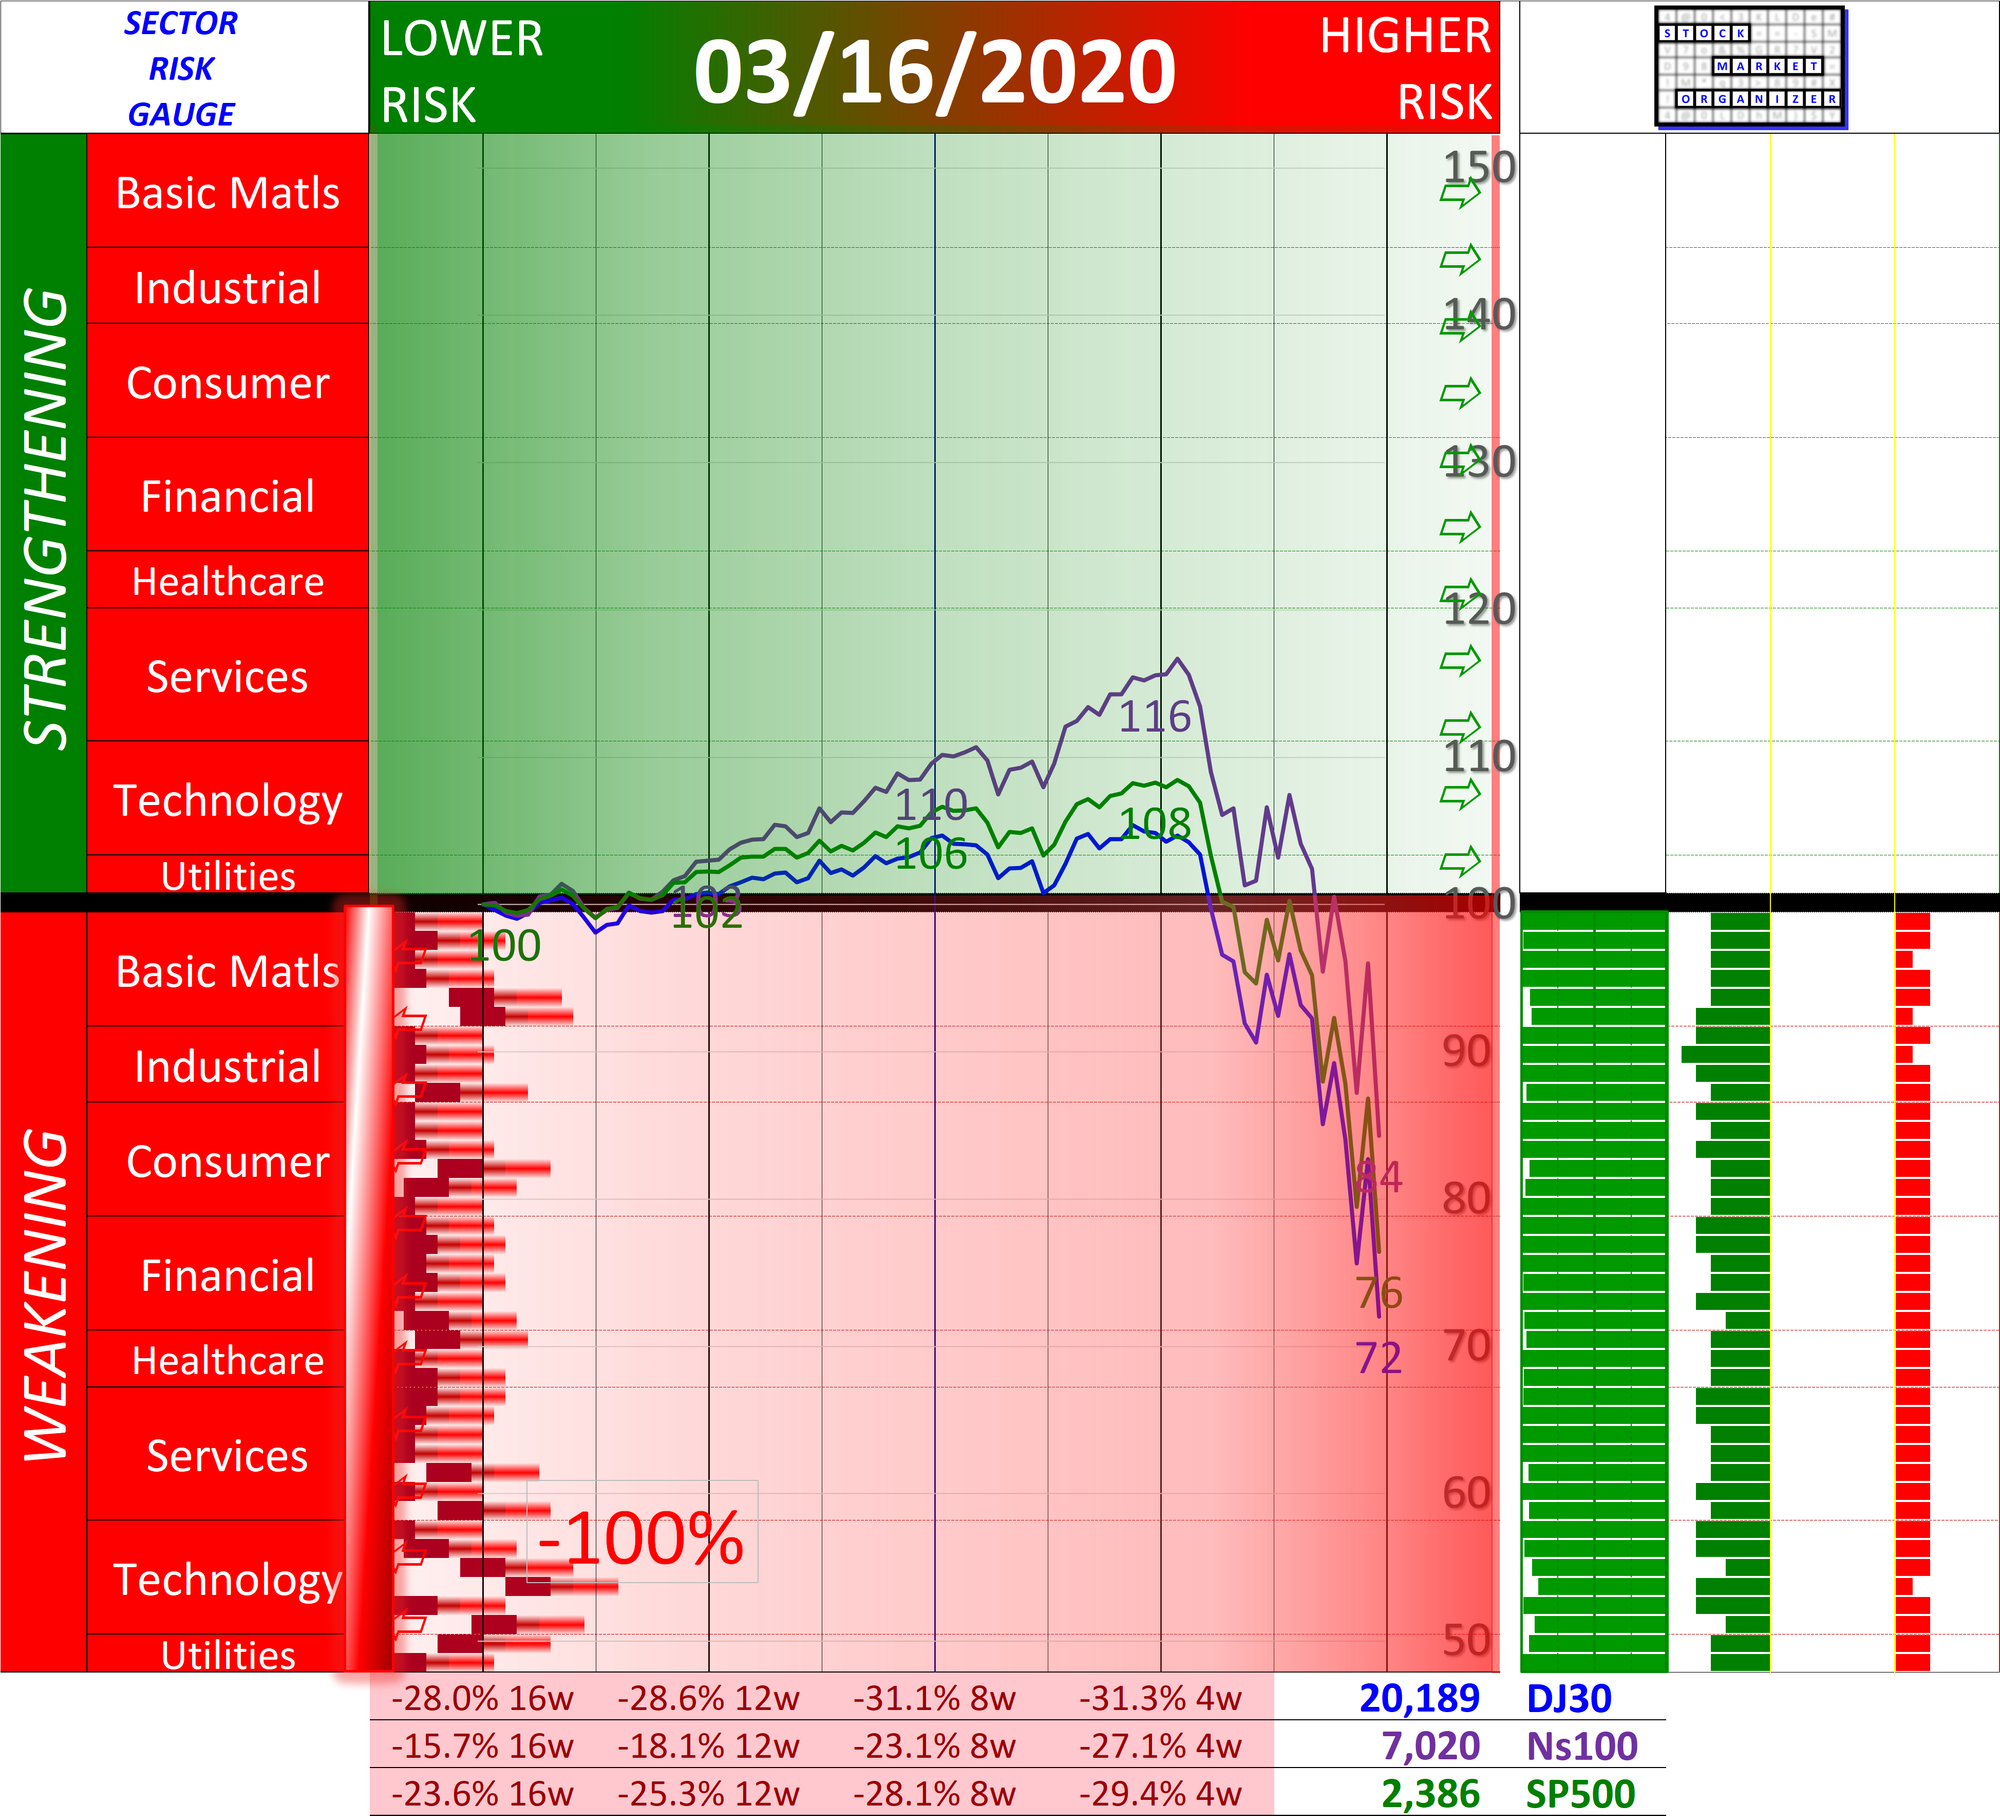
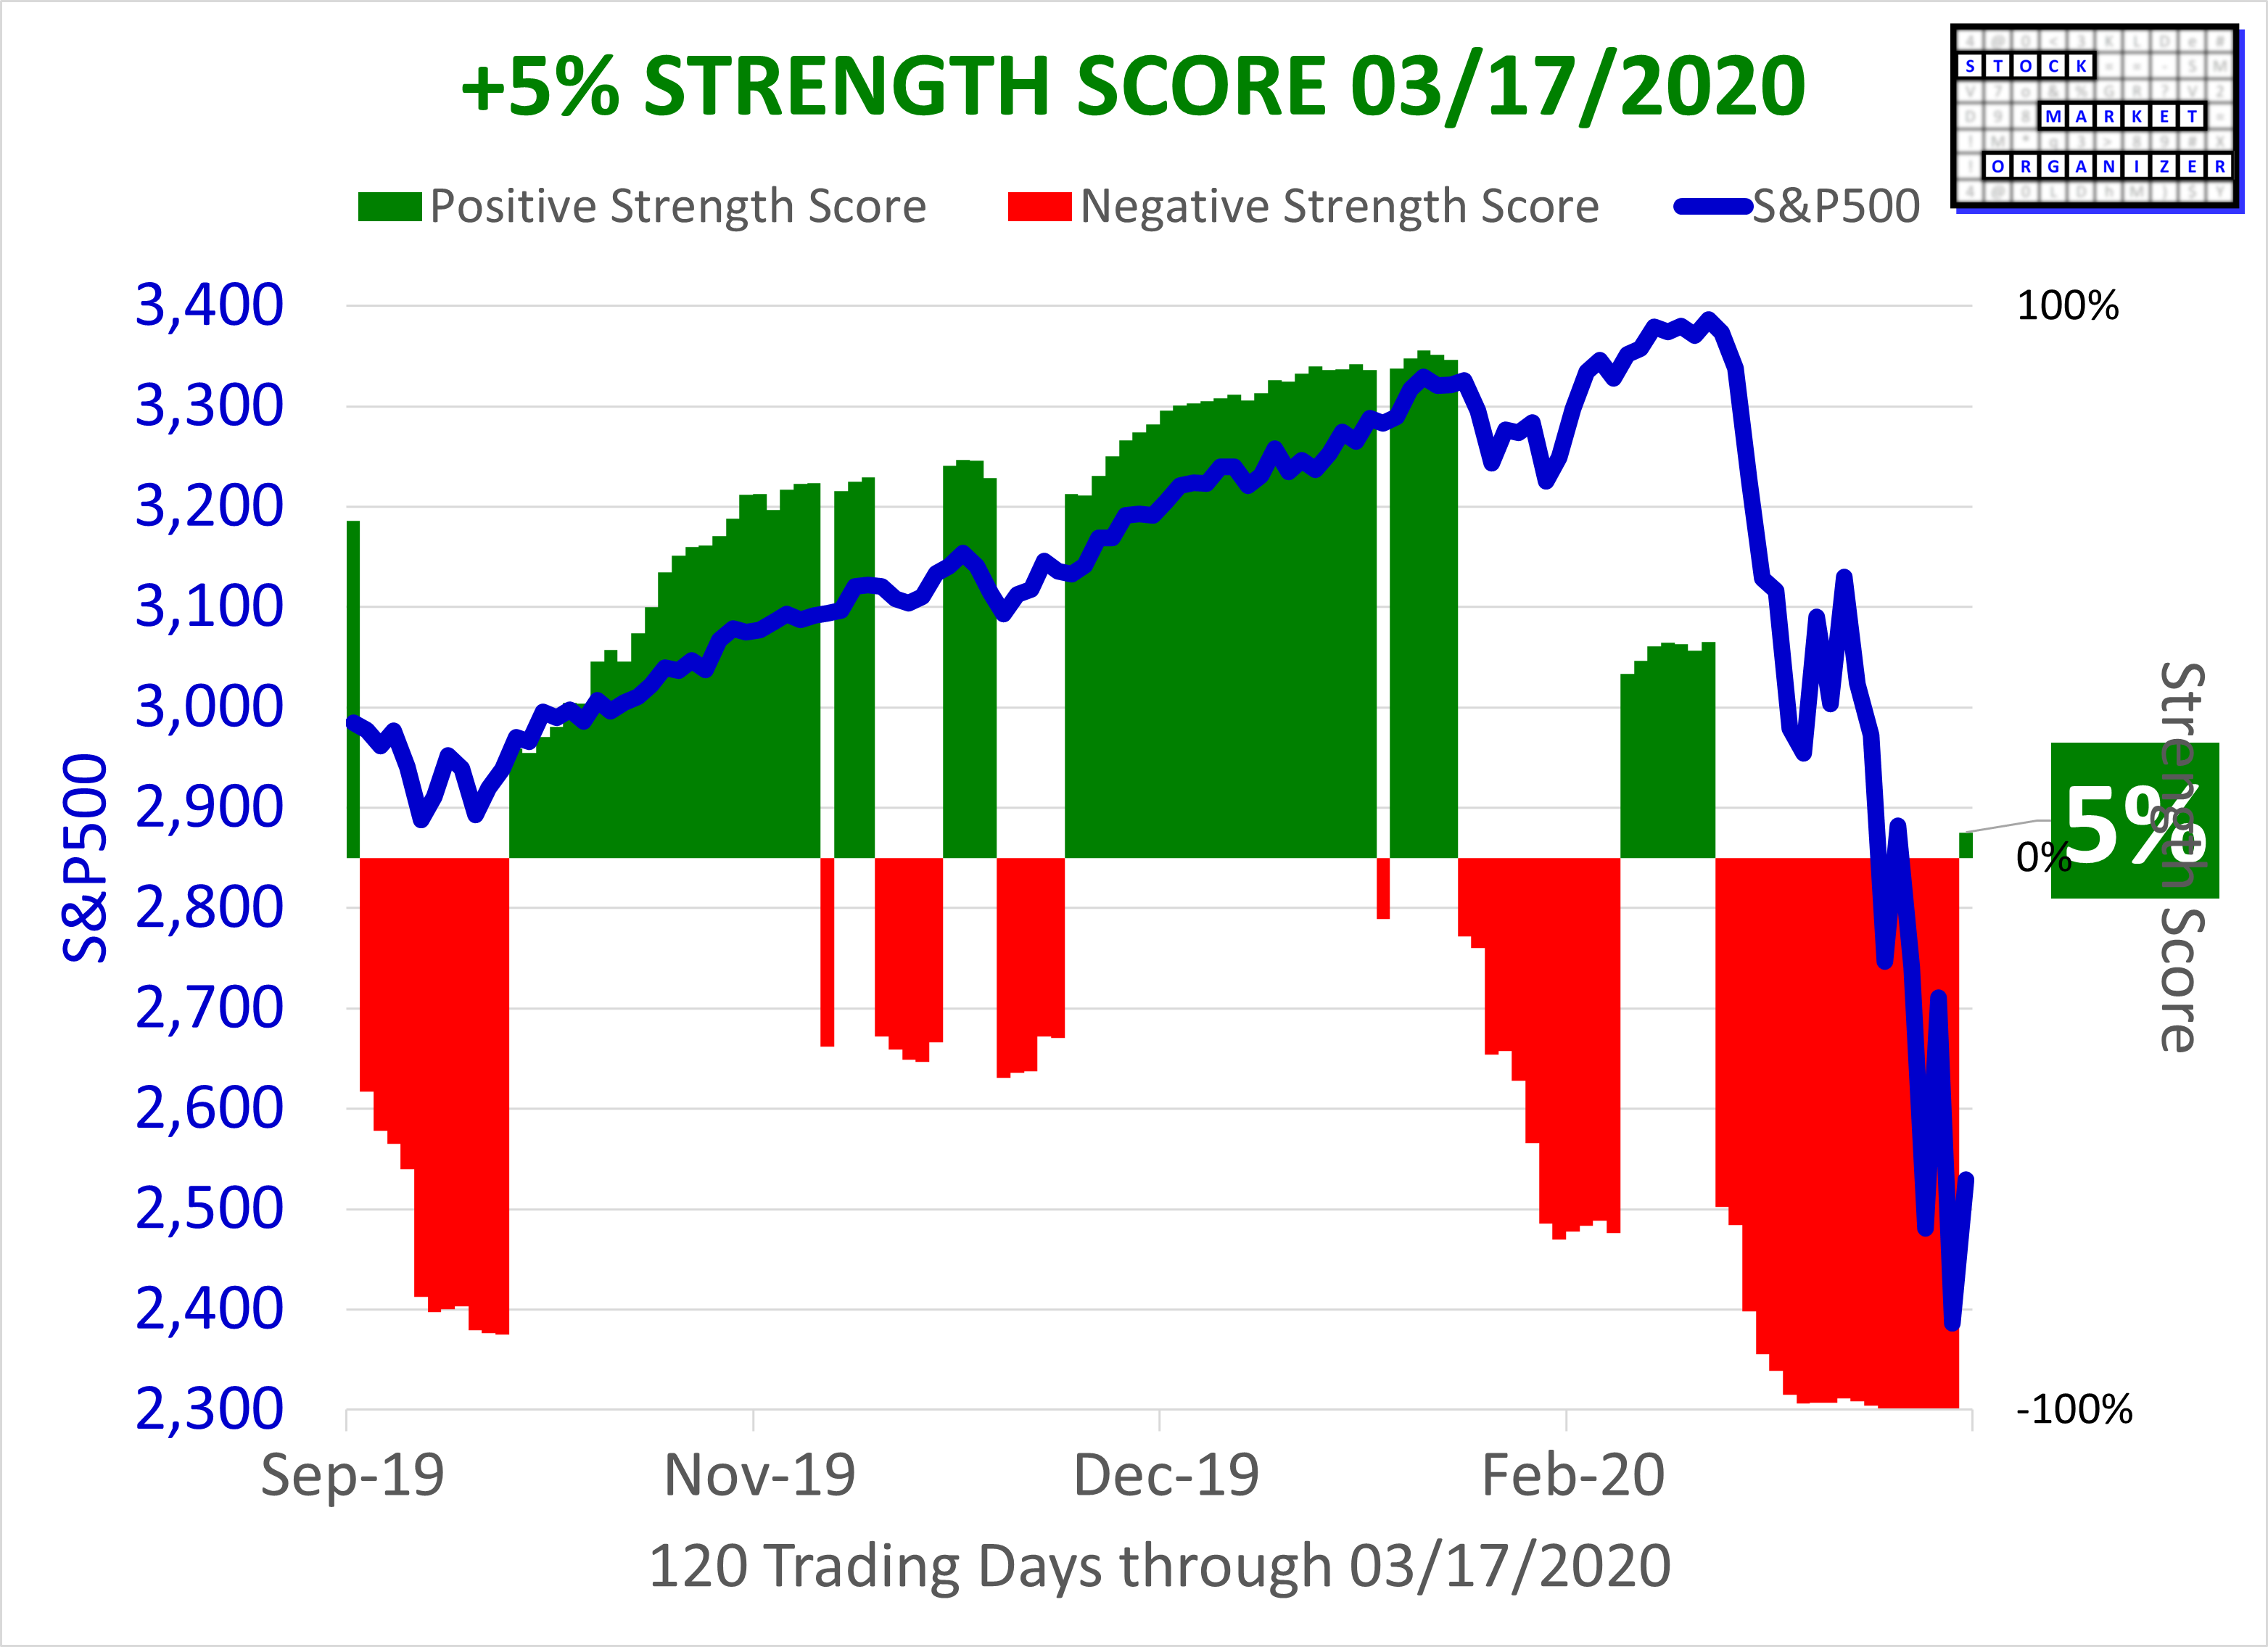
The Covid Crash Bottom March 16, 2020 (-100% Market Strength Score) to March 17, 2020 (+5% Market Strength Score)
First, the bad day:
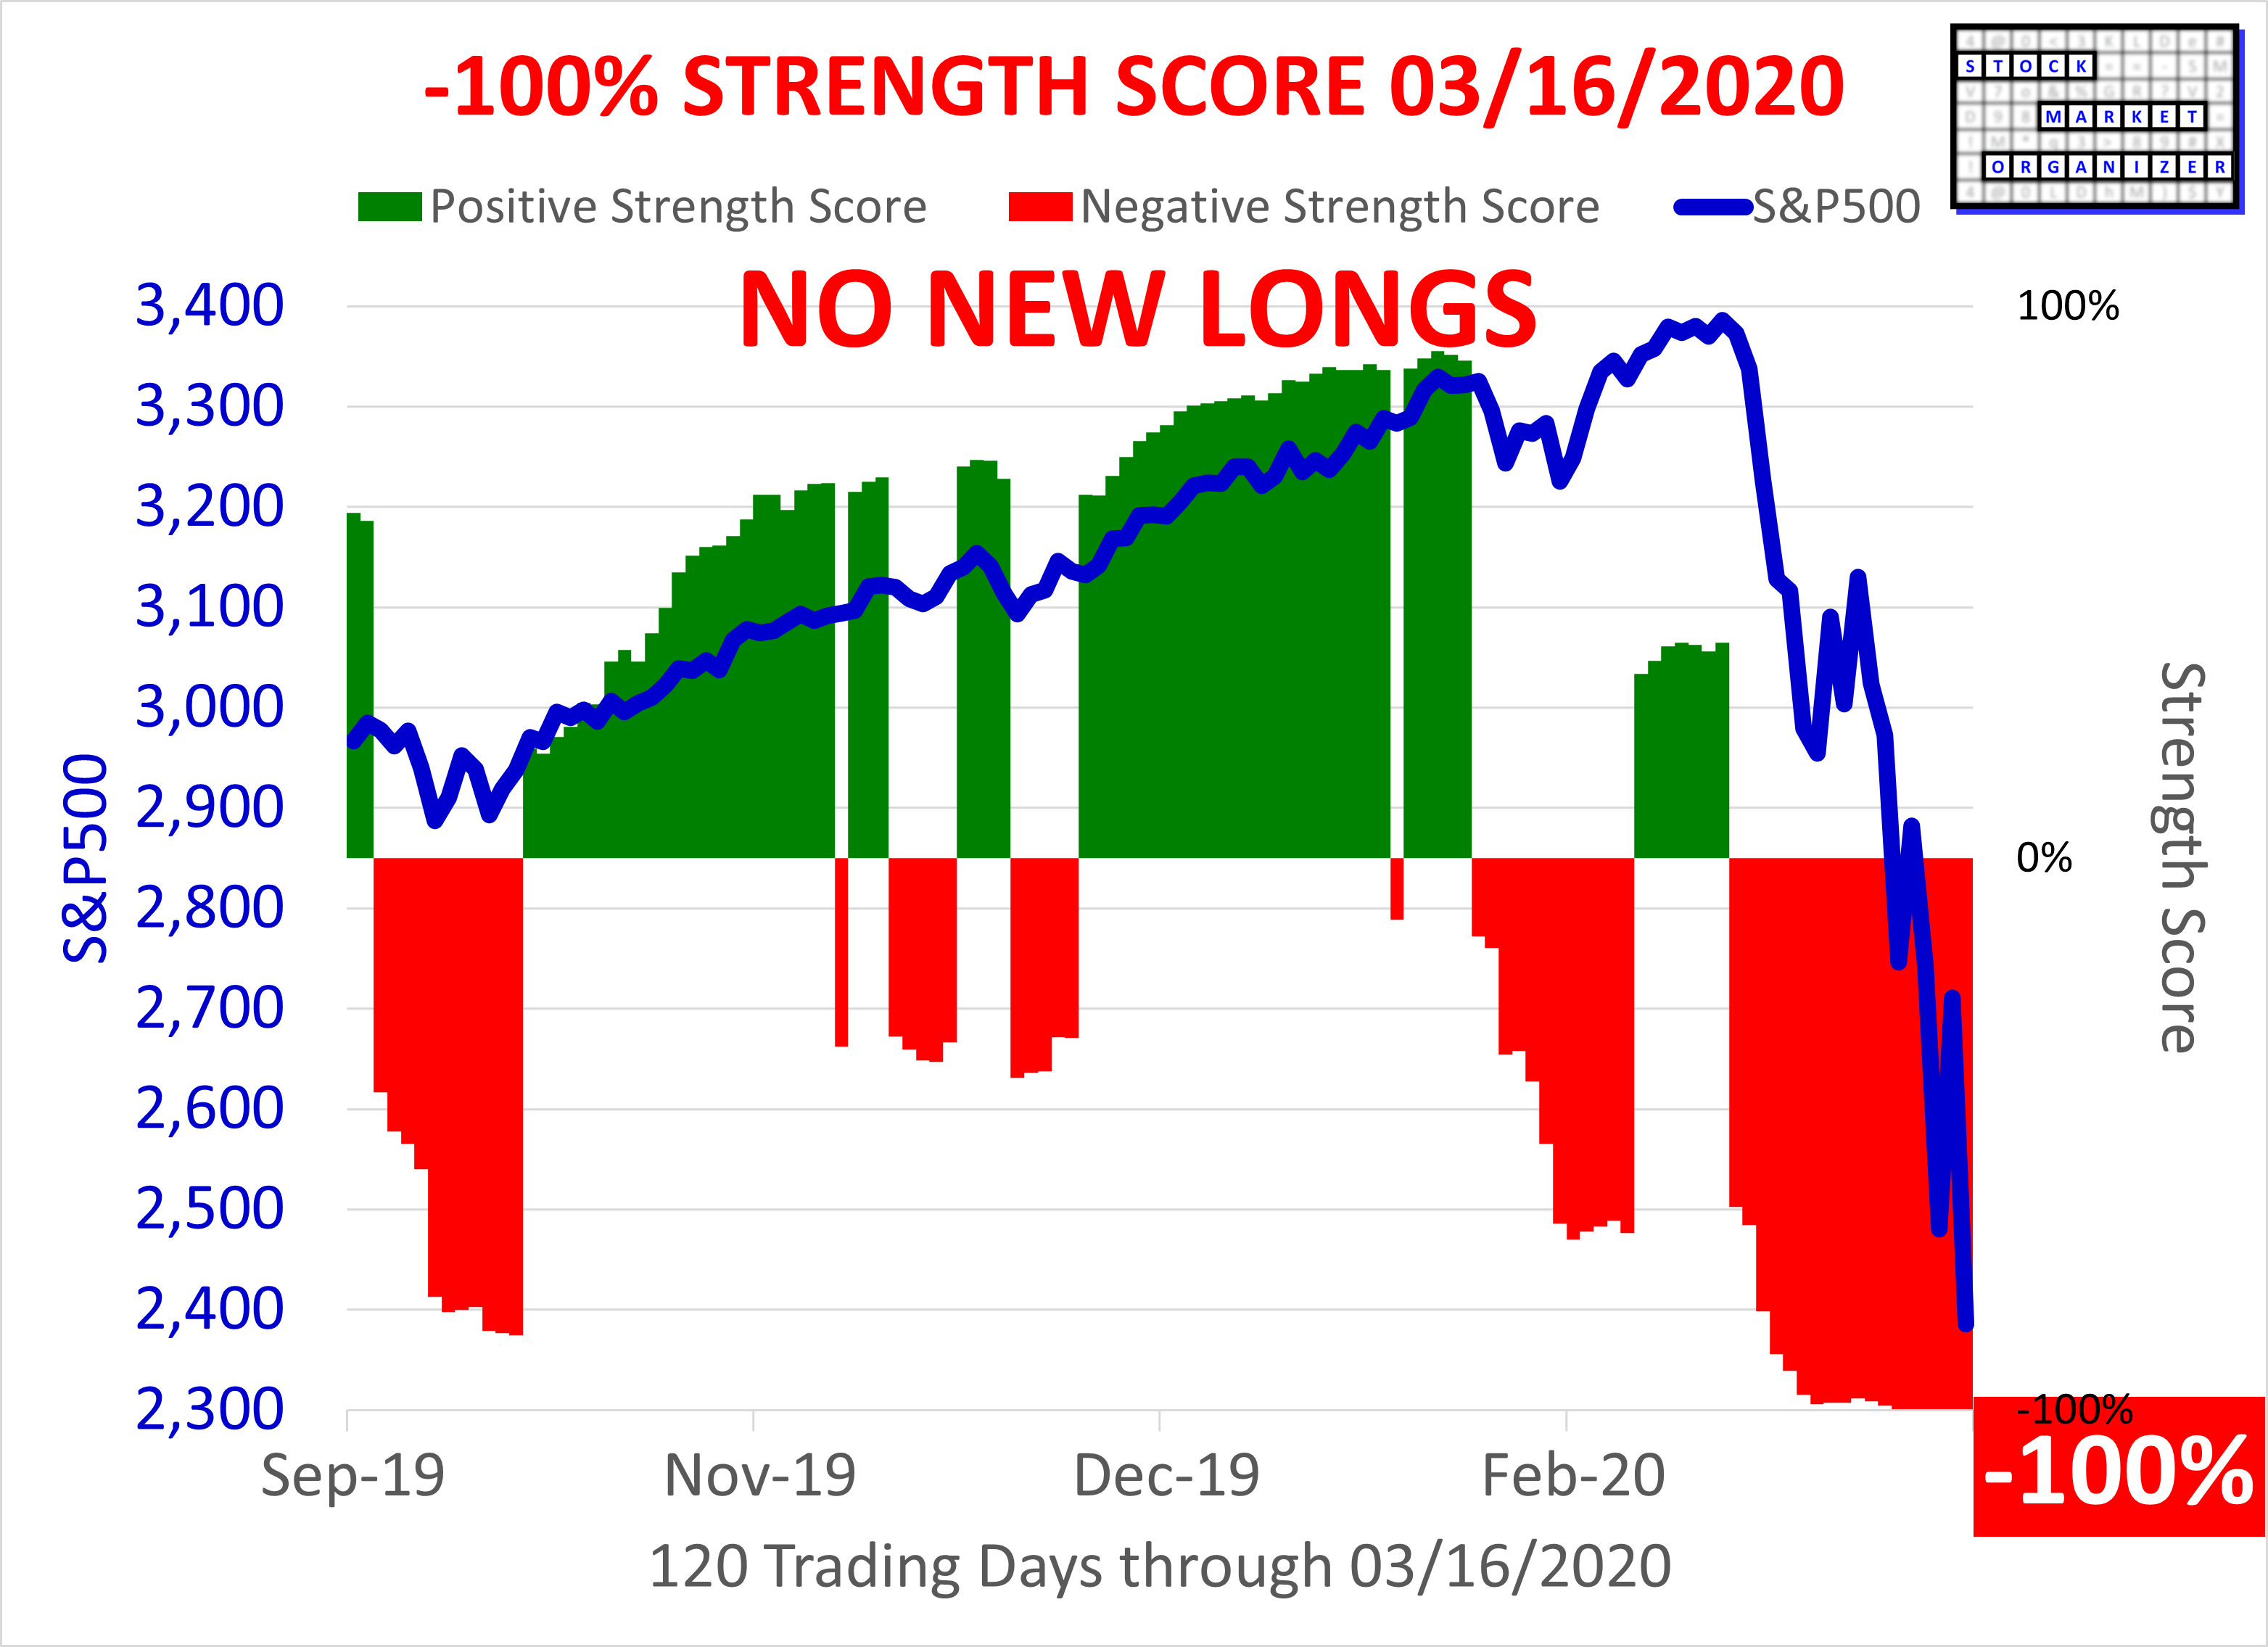
The corresponding Sector Risk Gauge, -100% Market Strength Score:
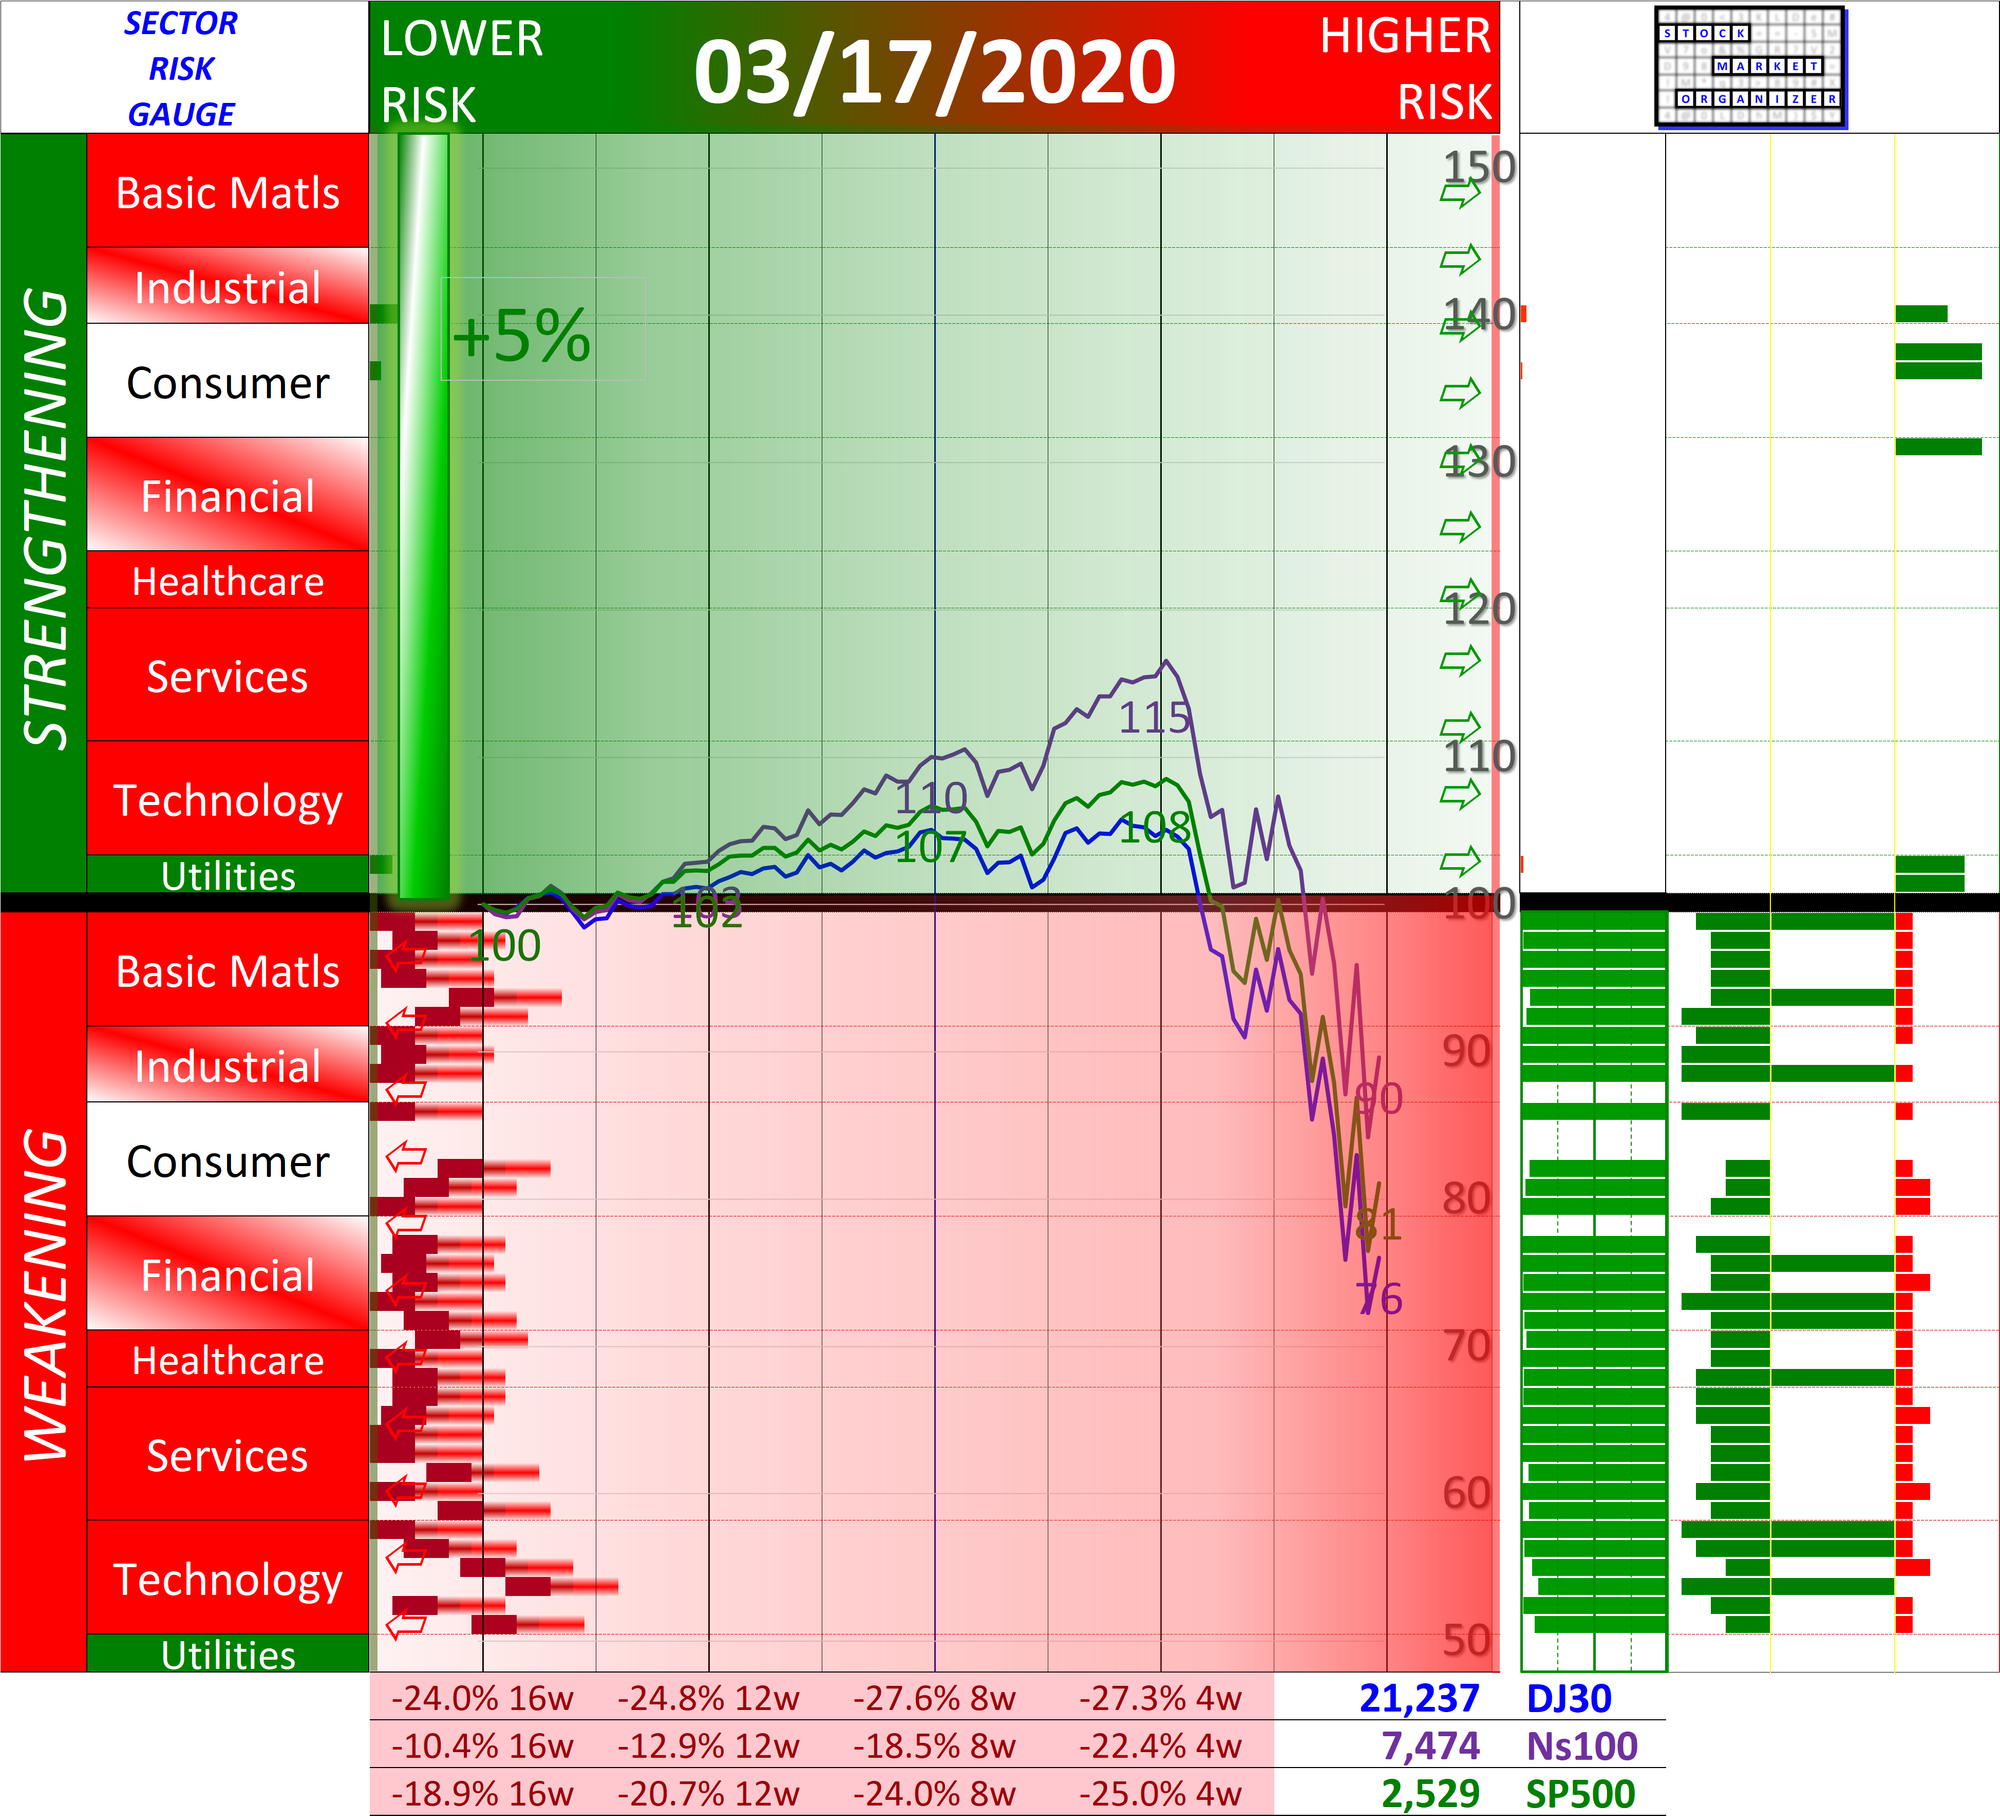
Next, the conversion to a positive environment with a +5% Market Strength Score March 17, 2020:
Corresponding Sector Risk Gauge March 17, 2020, +5% Market Strength Score: