SMO Dashboard Tue 2026-03-31 (Market = Bearish Advanced Phase)

TLDR:
This dashboard uncovers strength and weakness at the market, sector, industry, sub-industry, and stock levels to aid decision-making in the prevailing market environment.
Commentary
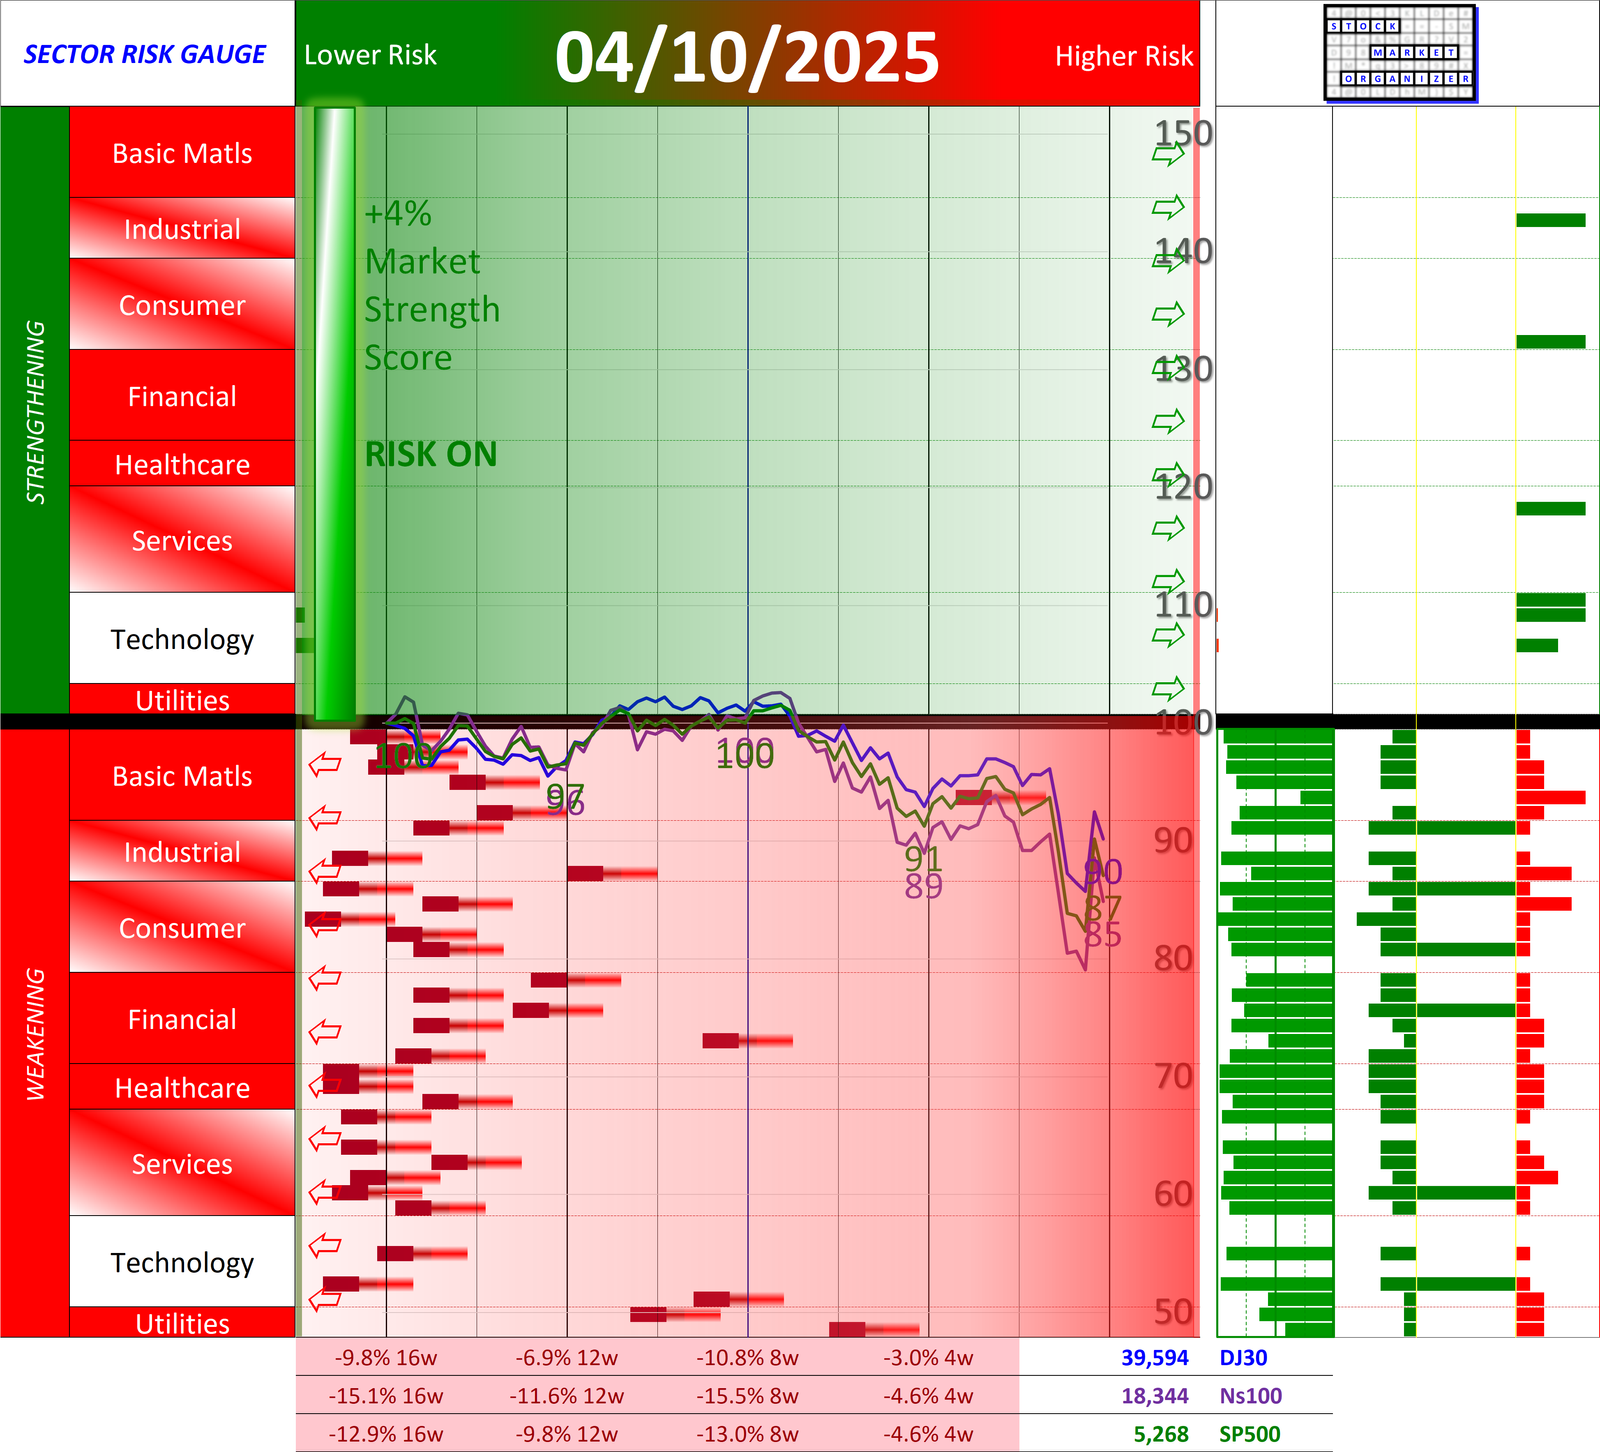
The Market Strength Score is currently advanced stage Bearish. Be cautious - this is high risk territory.
Tracked indexes performance this week:
- Strengthened/+1: None
- Strengthened/0: None
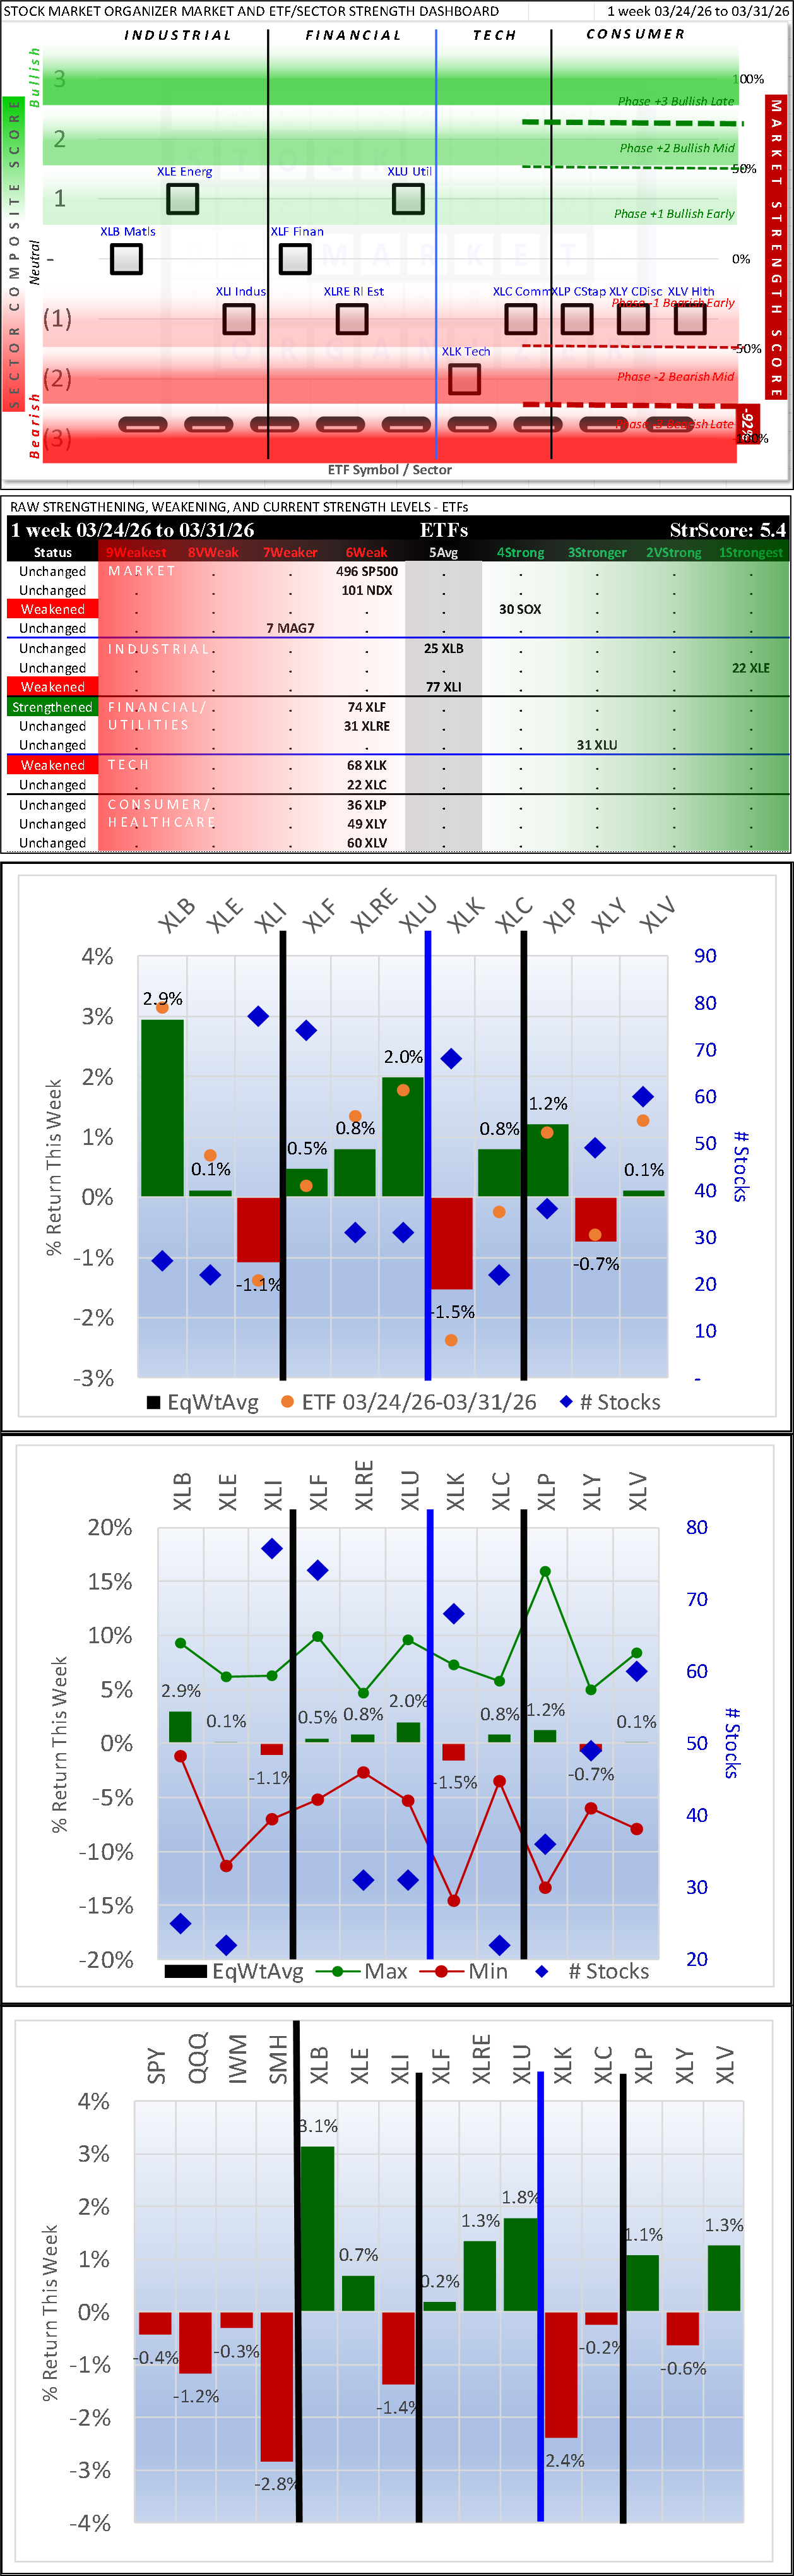
- Unchanged: SP500 (5Average), MAG7 (7Weaker)
- Weakened/0: NDX (6Weak), SOX (4Strong)
- Weakened/-1: None
The dashboard is widespread red except in Basic Materials. The red in Financials is broad-based but showed some improvement. Semis/Electronics had a rough week. Utilities improved. Energy/Oil remains strong. Metals improved.
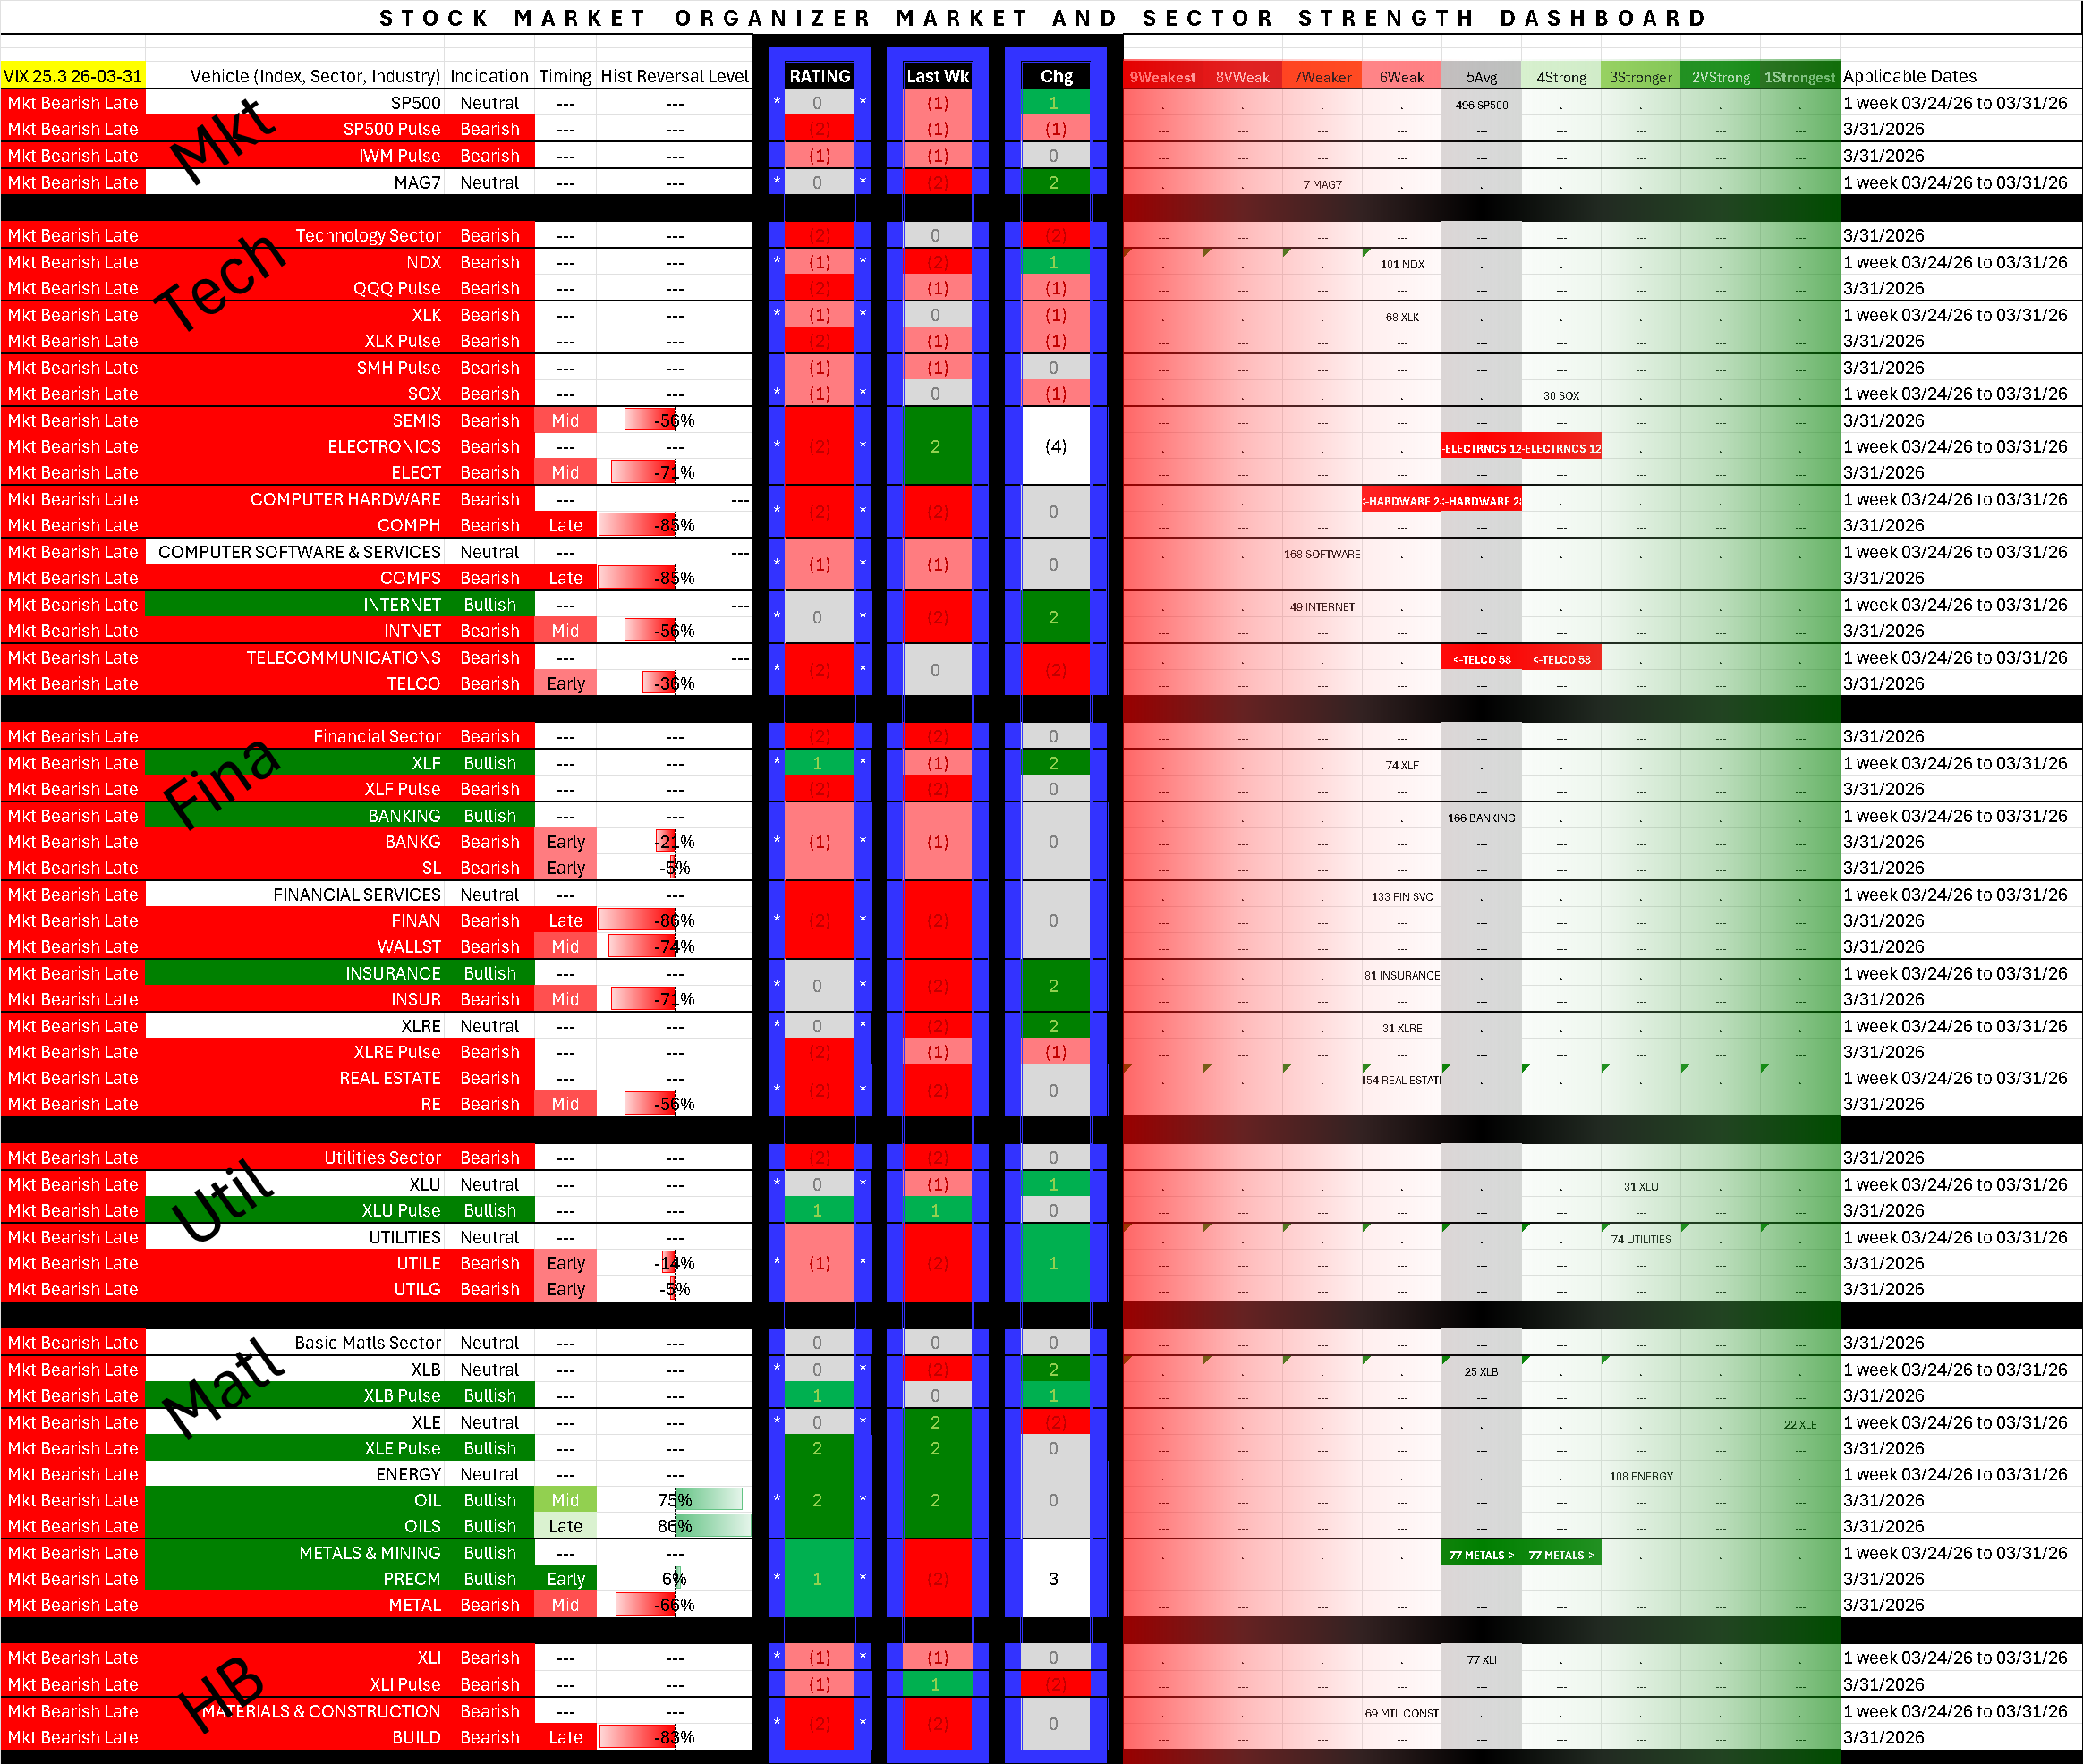
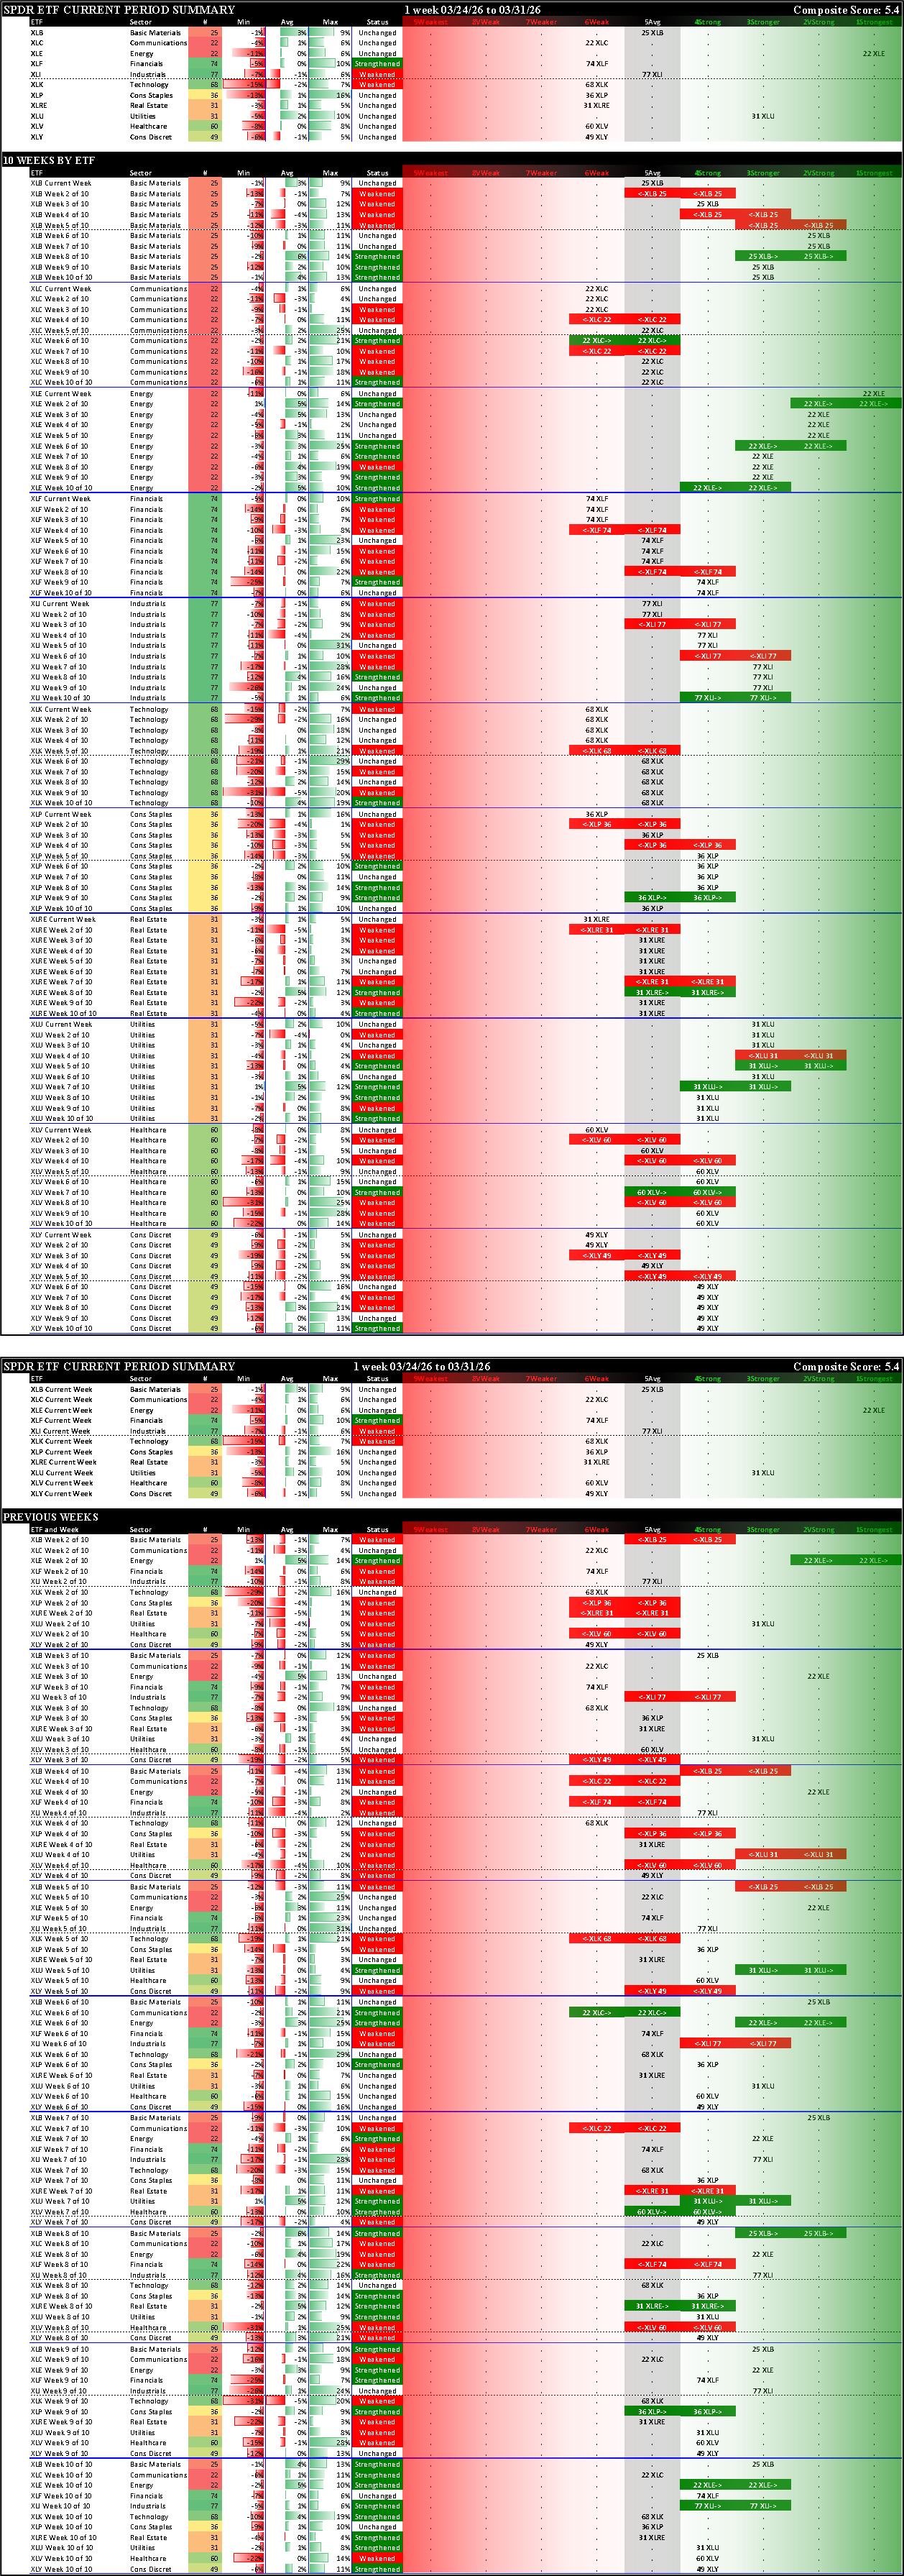
The column labeled "Rating" reflects this week's strength (based on this system's criteria) of the individual index, sector, or industry vehicle. Note also the columns which show last week's score and the change from last week's score.
Market Strength Score
Currently -92%, Phase -3 Bearish Advanced. Changed to Negative yesterday. Very low yet not at full extreme. Expect volatility with the possibility of a cascading decline, though be ready to turn positive even if the headlines seem dismal (see this post for an example of this concept).
SPDR Sector ETFs Detail
XLU Utilities and XLE Energy lead on the green side this week as XLK Technology lagged.
Context - 10 Week Lookbacks, by ETF and by Week
See below for changes over the past 10 weeks.
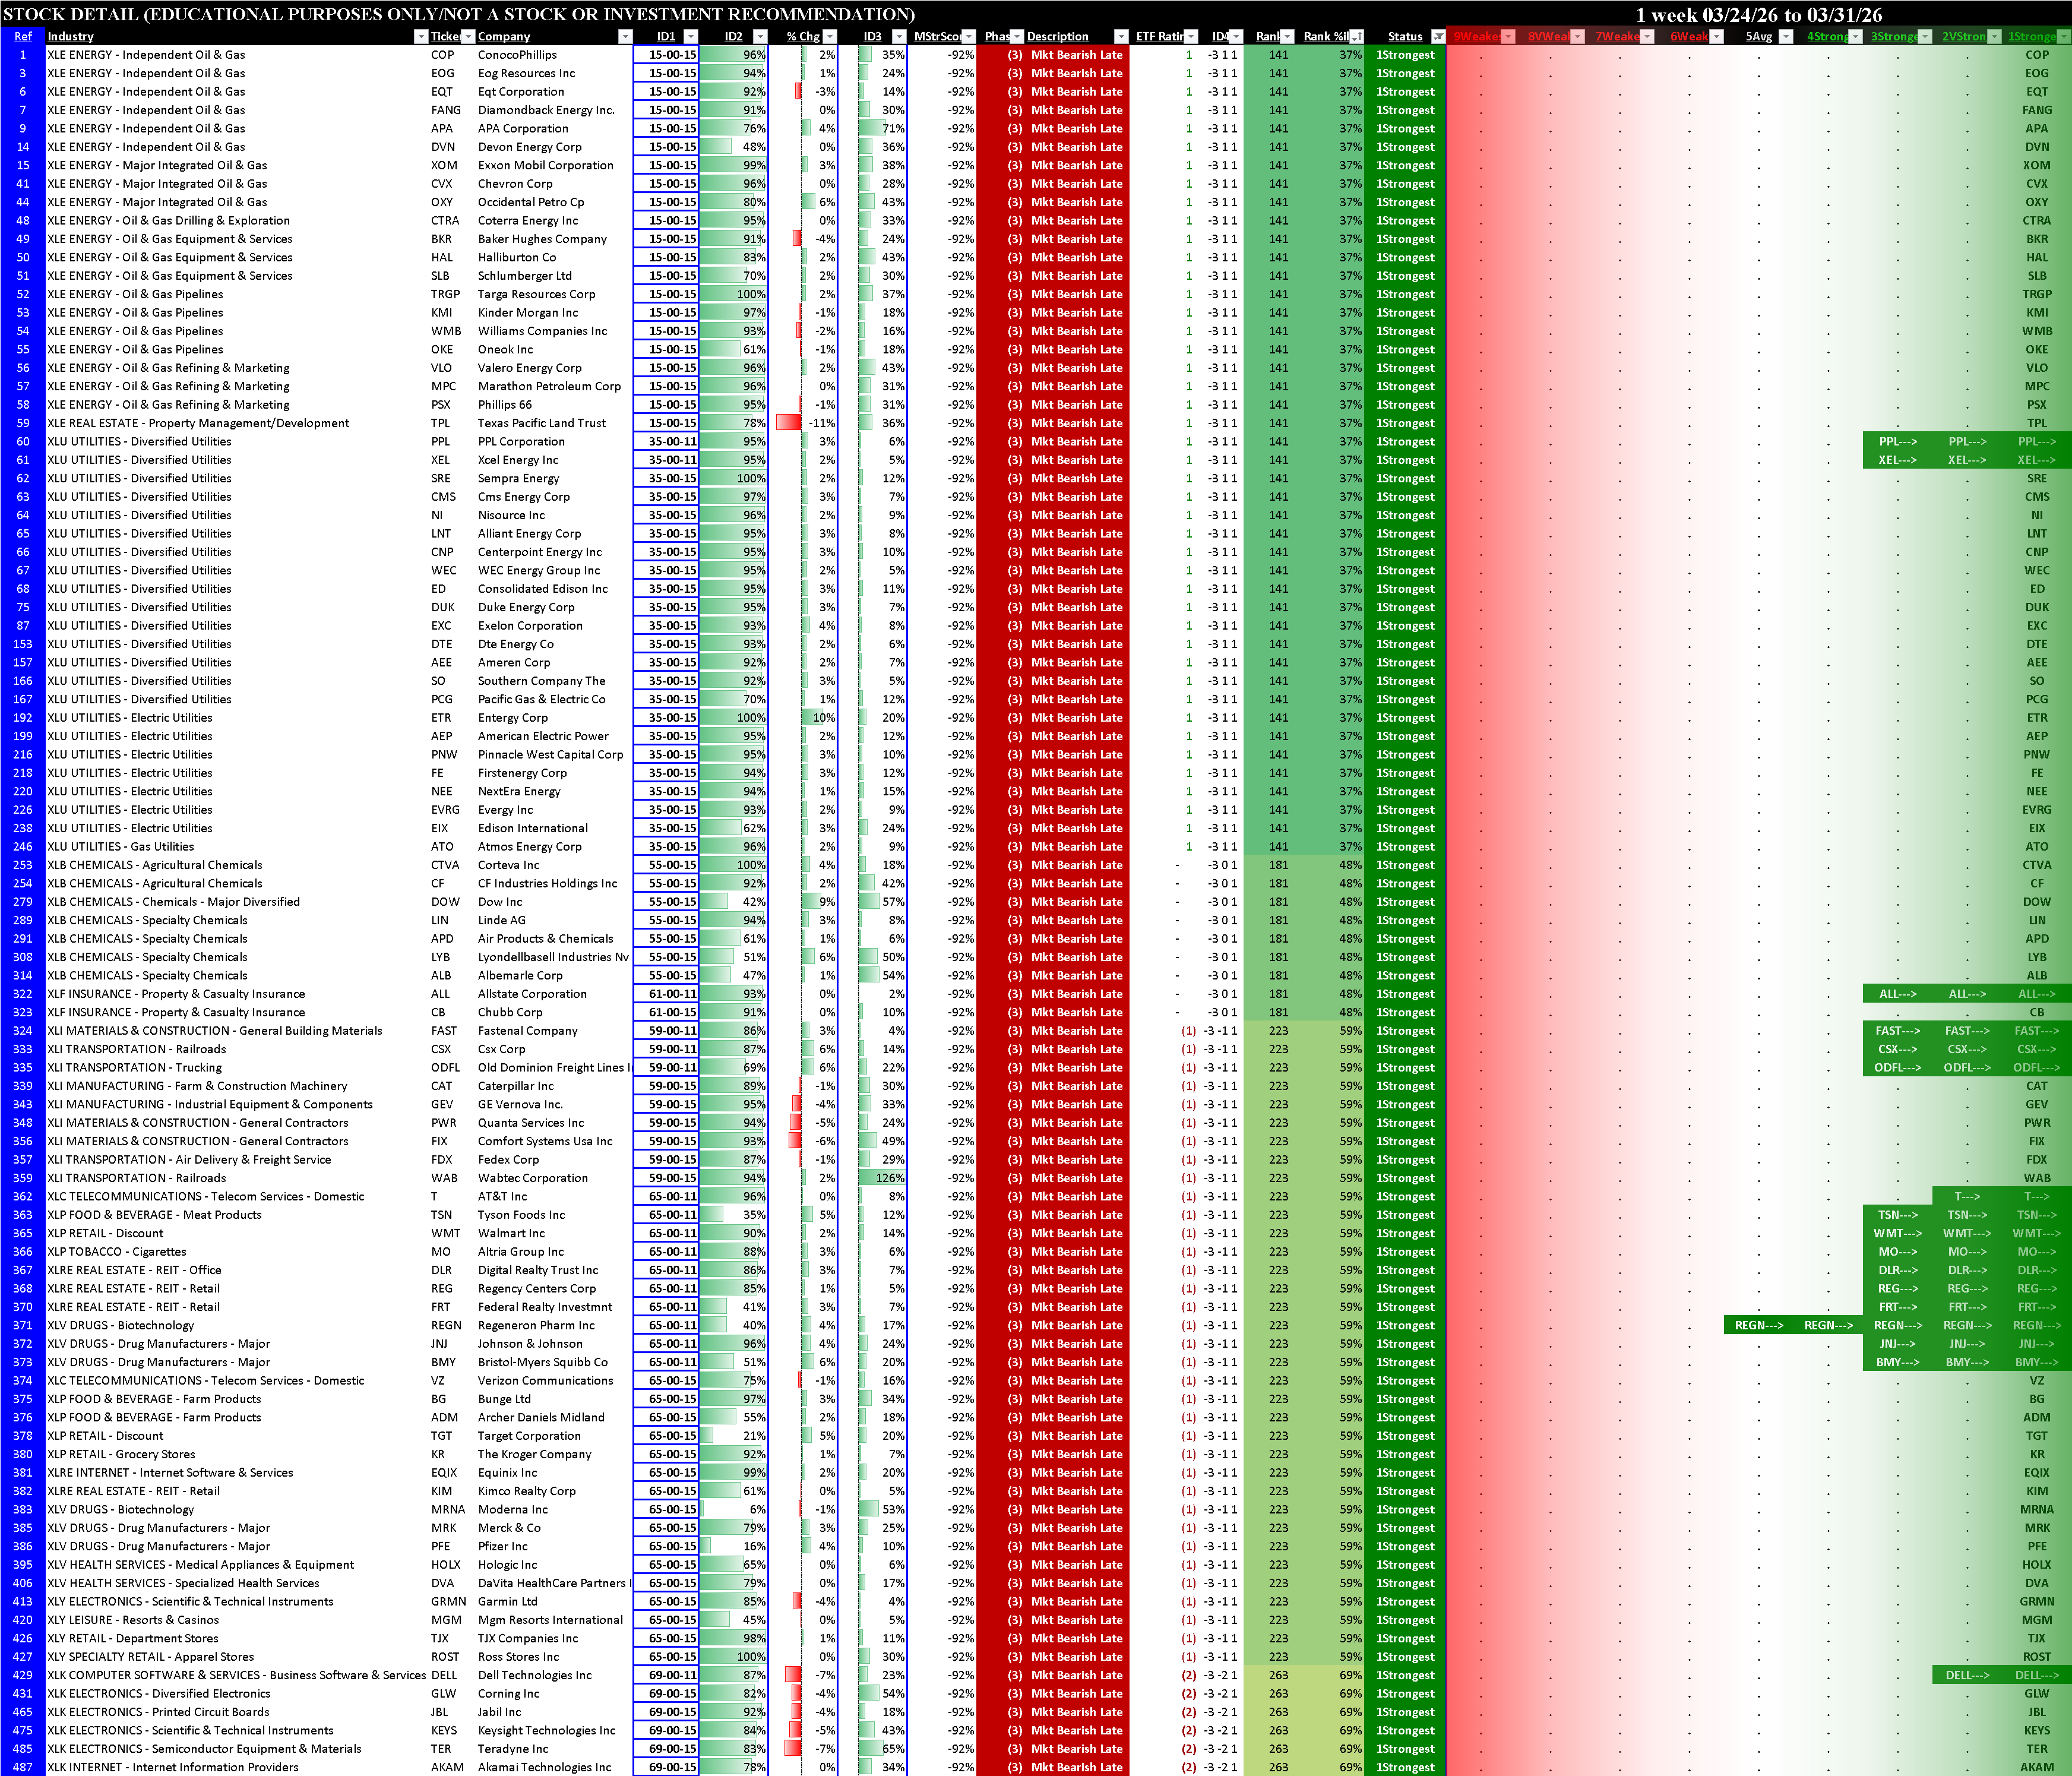
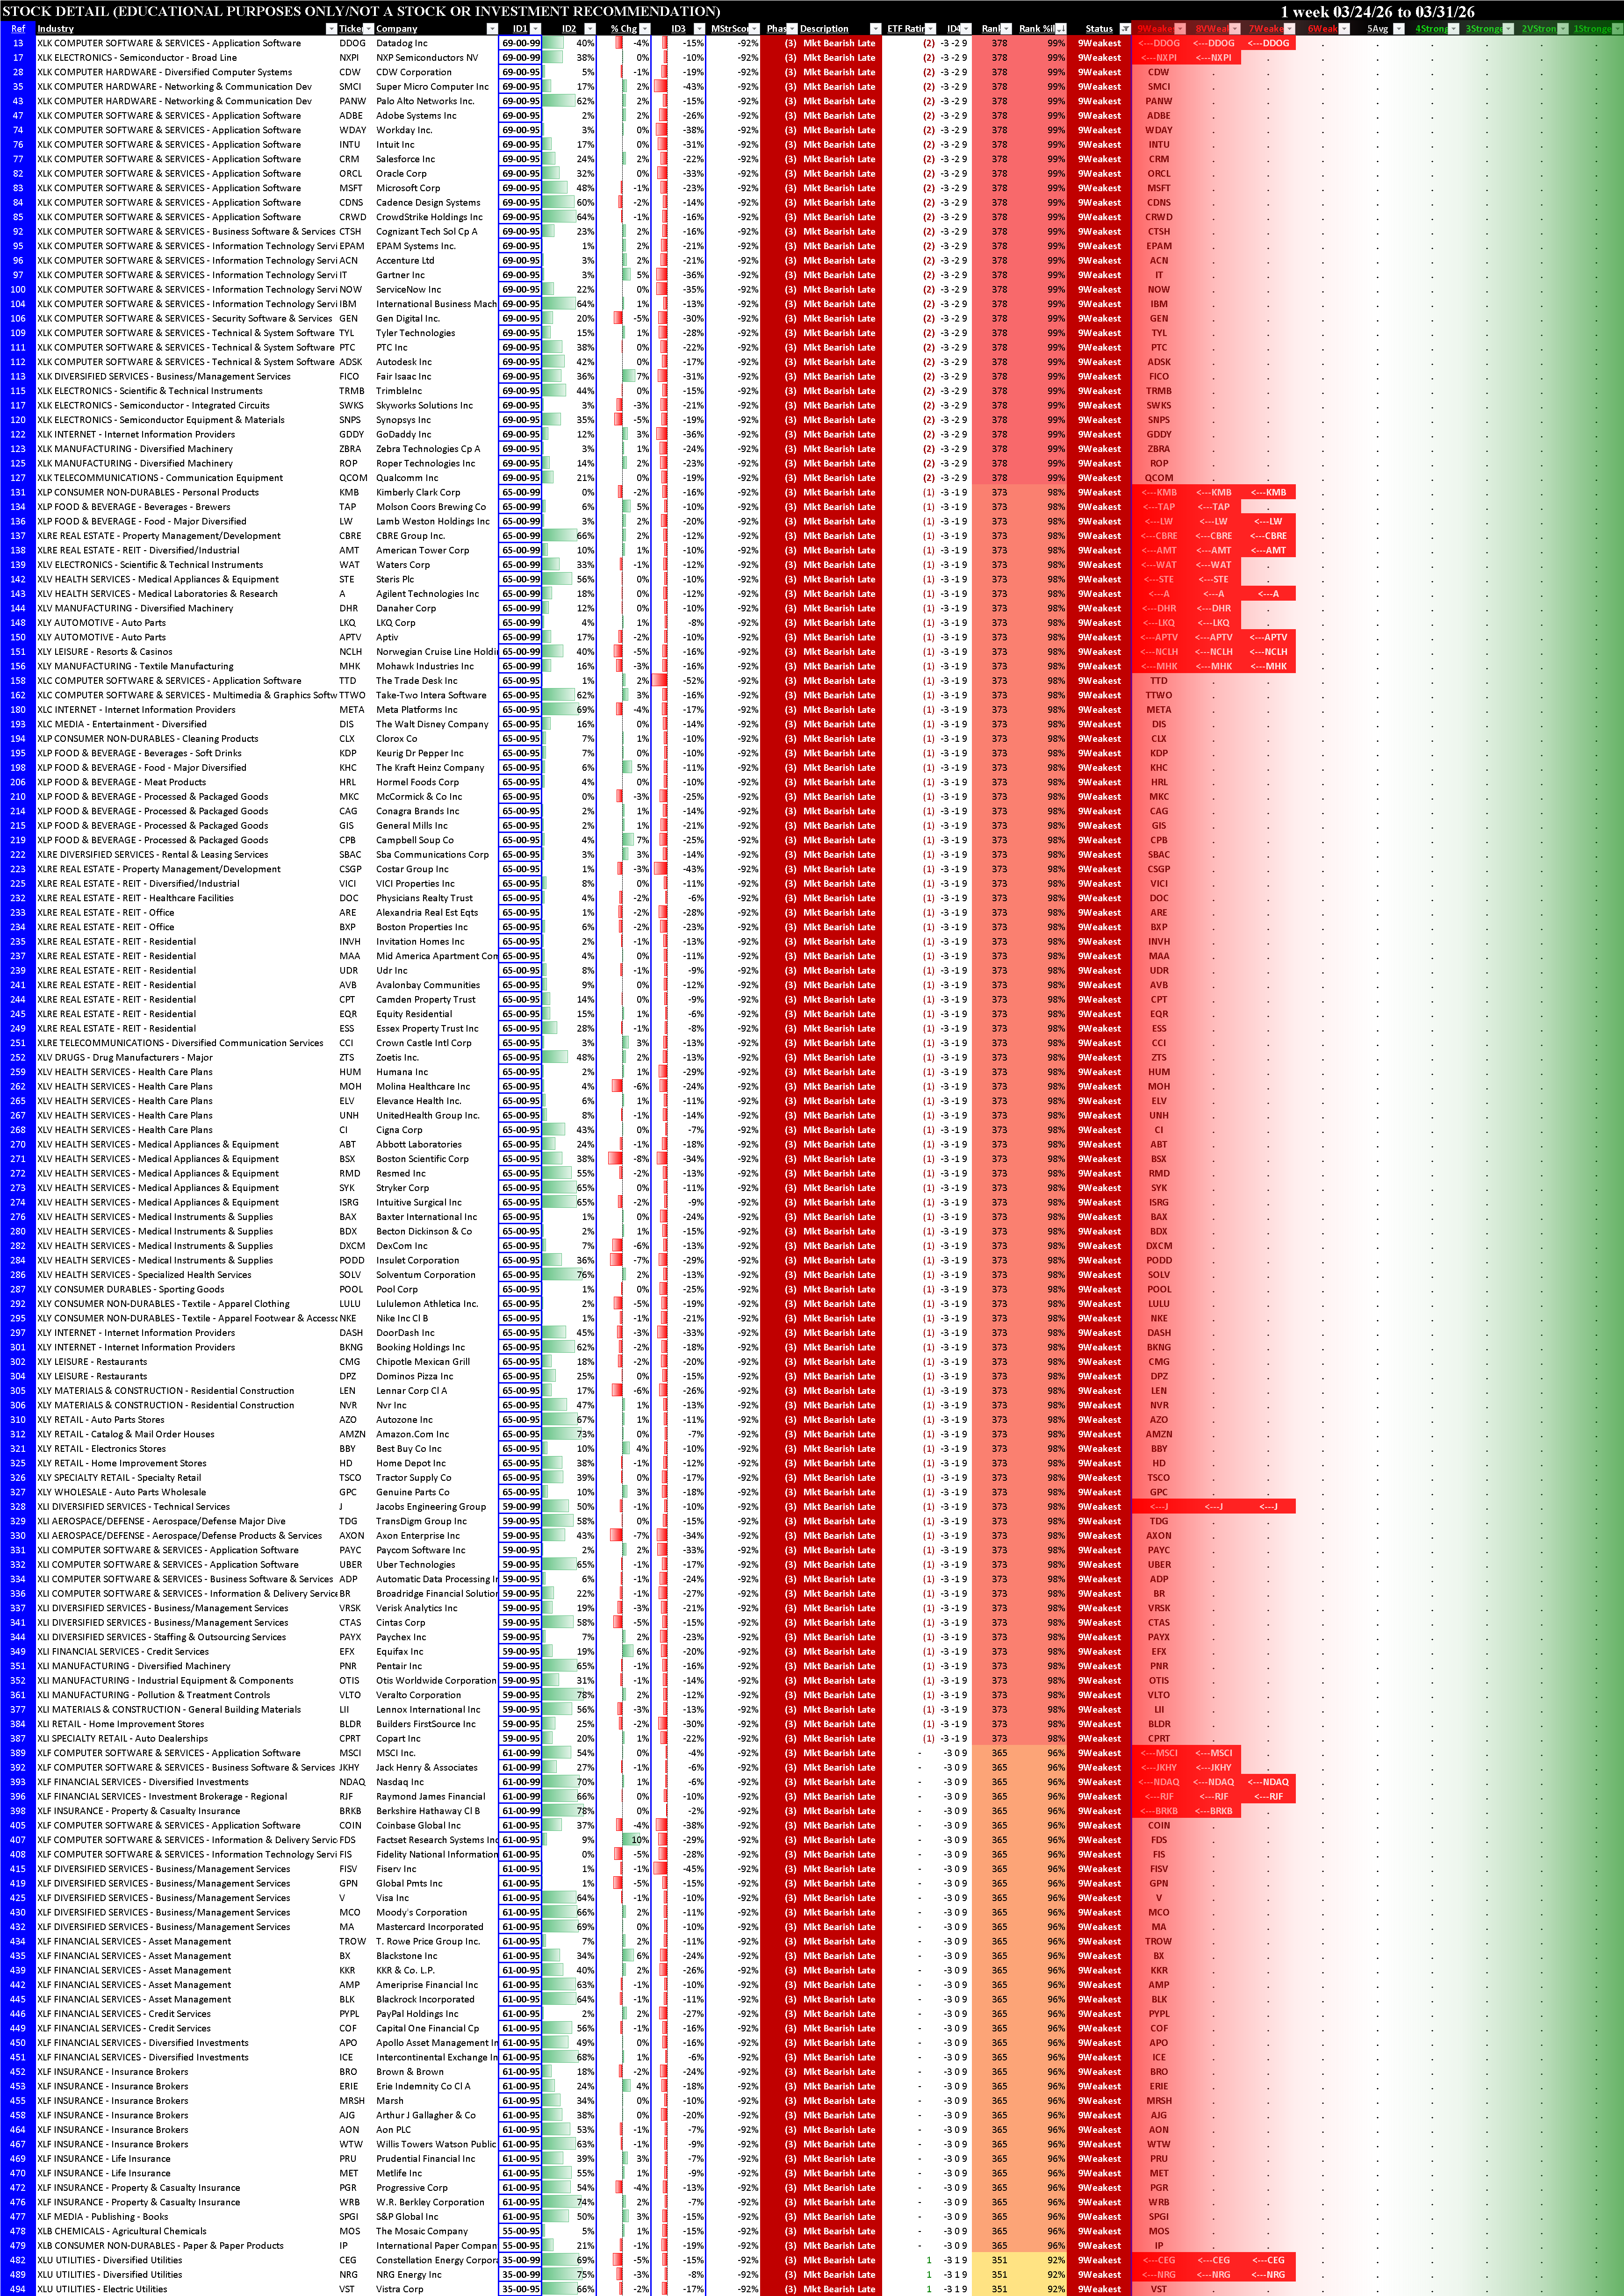
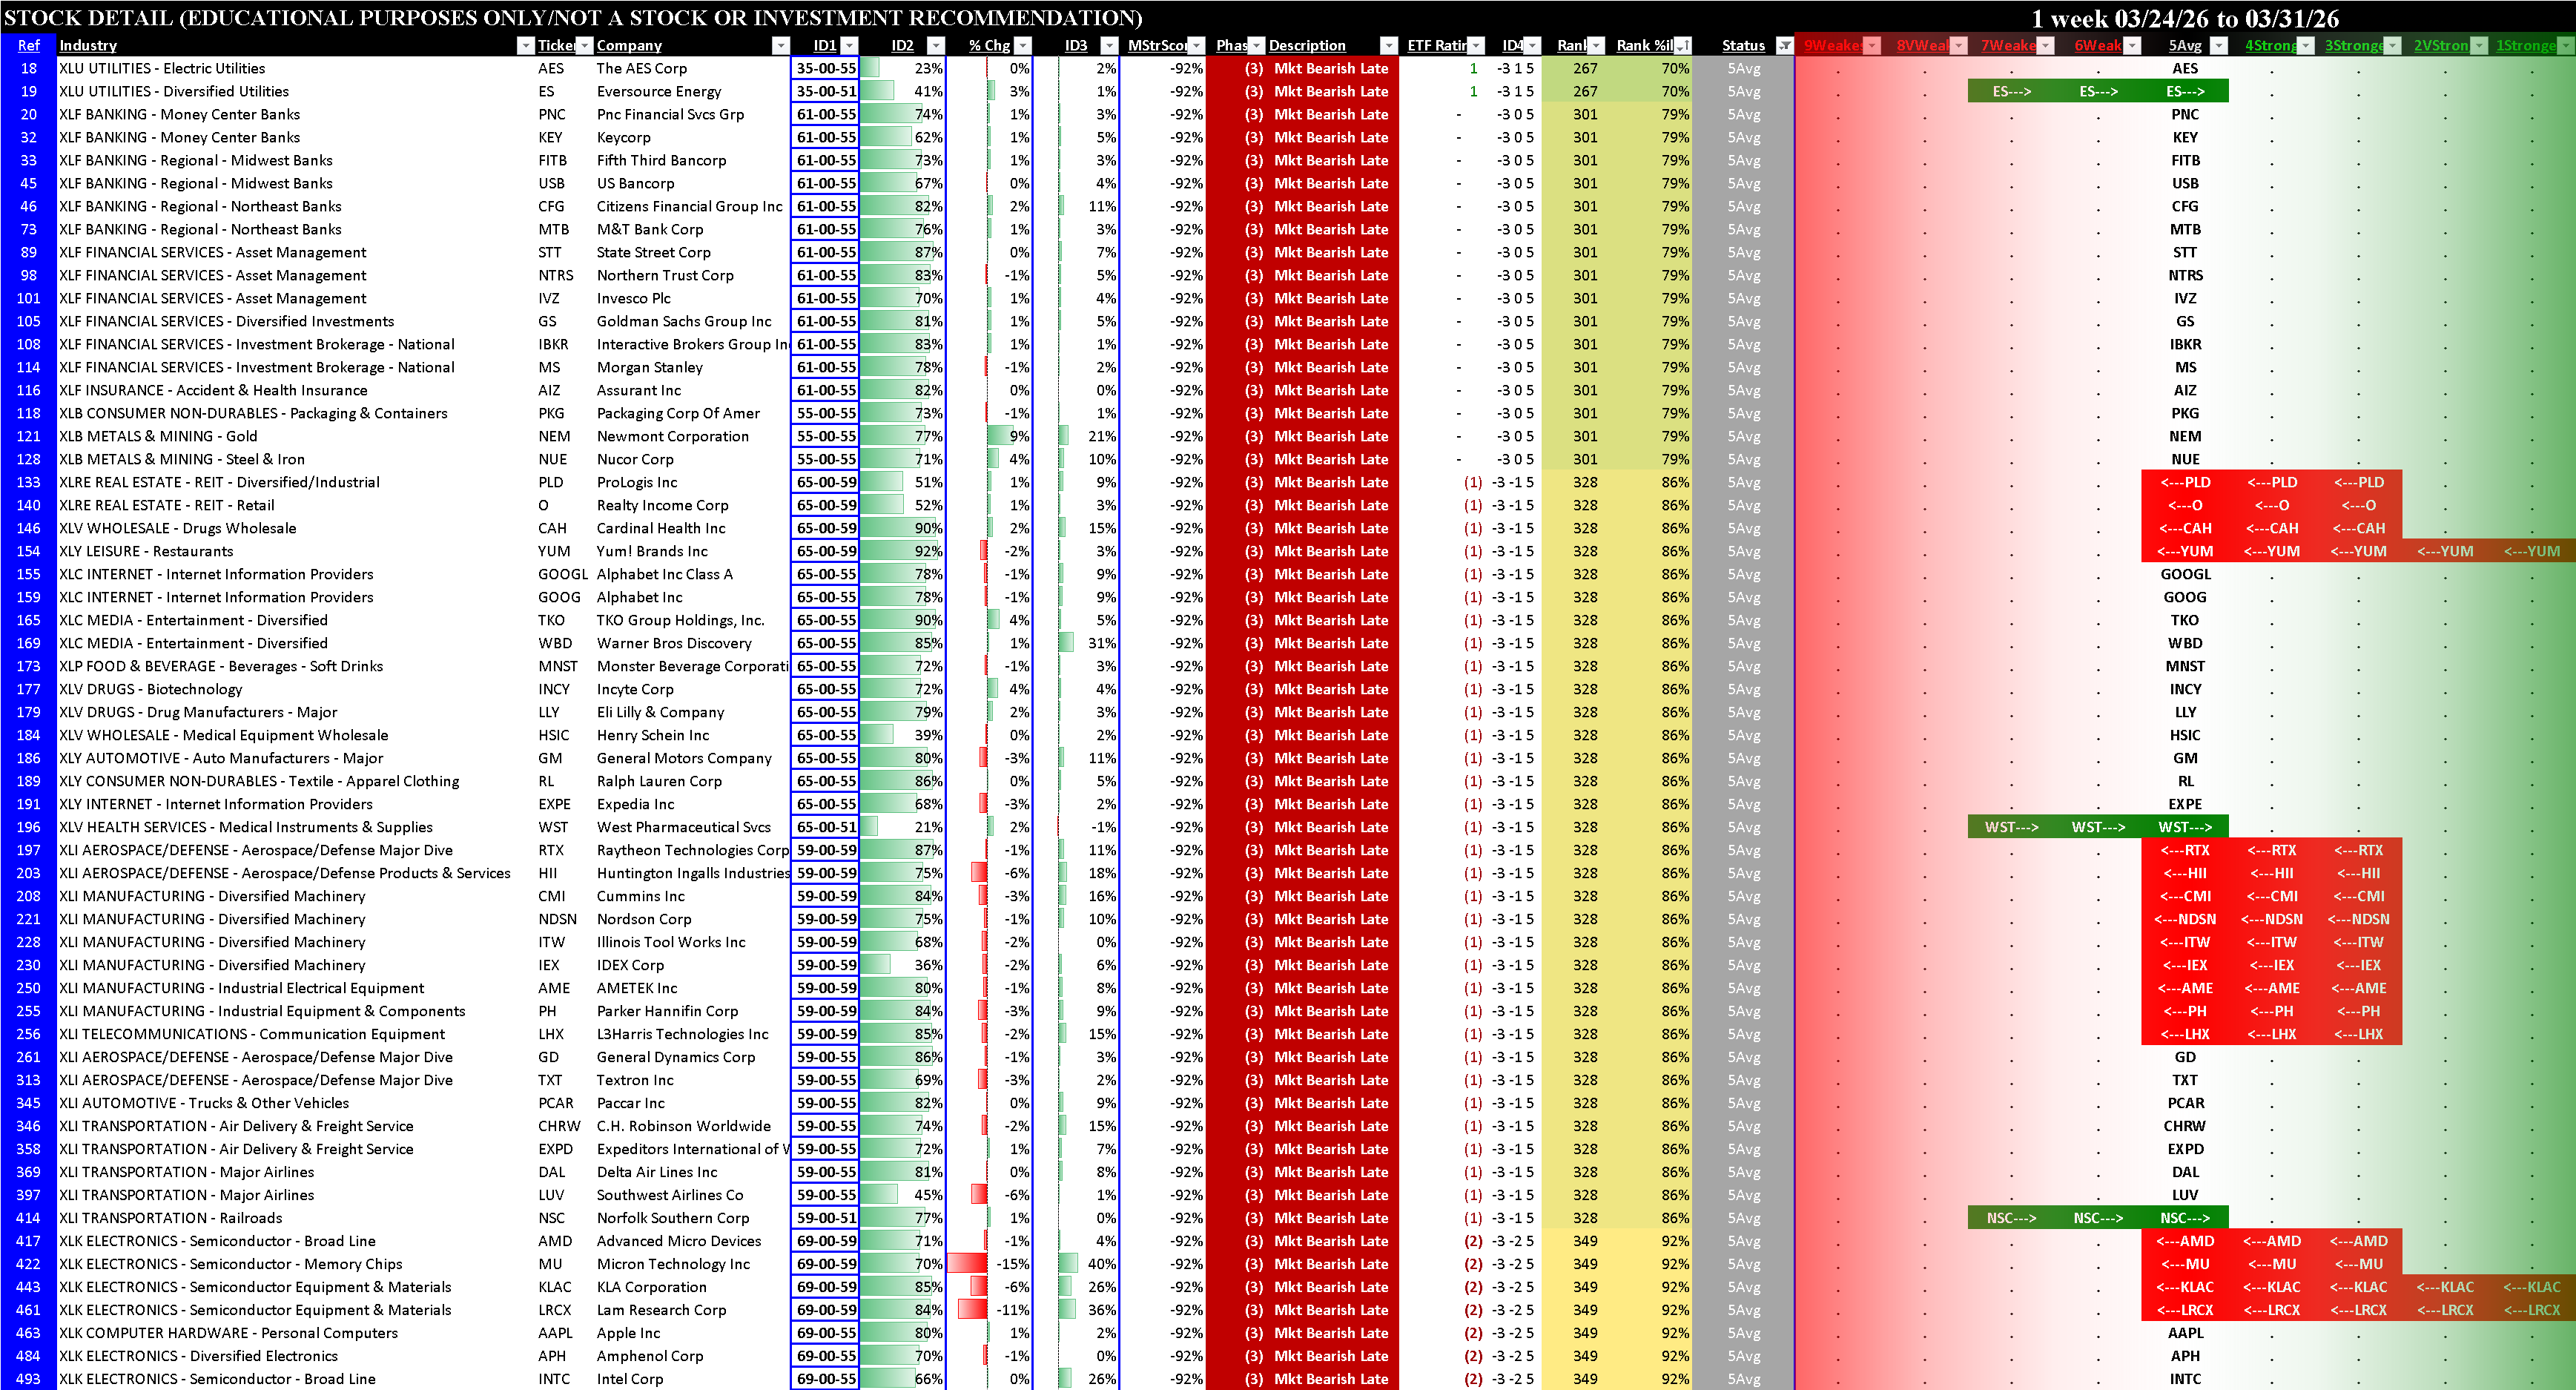
Sector ETFs Stocks Rated 1Strongest and 9Weakest
Long and short candidates are listed below, ranked based on market, sector, and stock strength characteristics. As a bonus, the bottom table shows 5Average stocks, for possible volatility-related strategies.