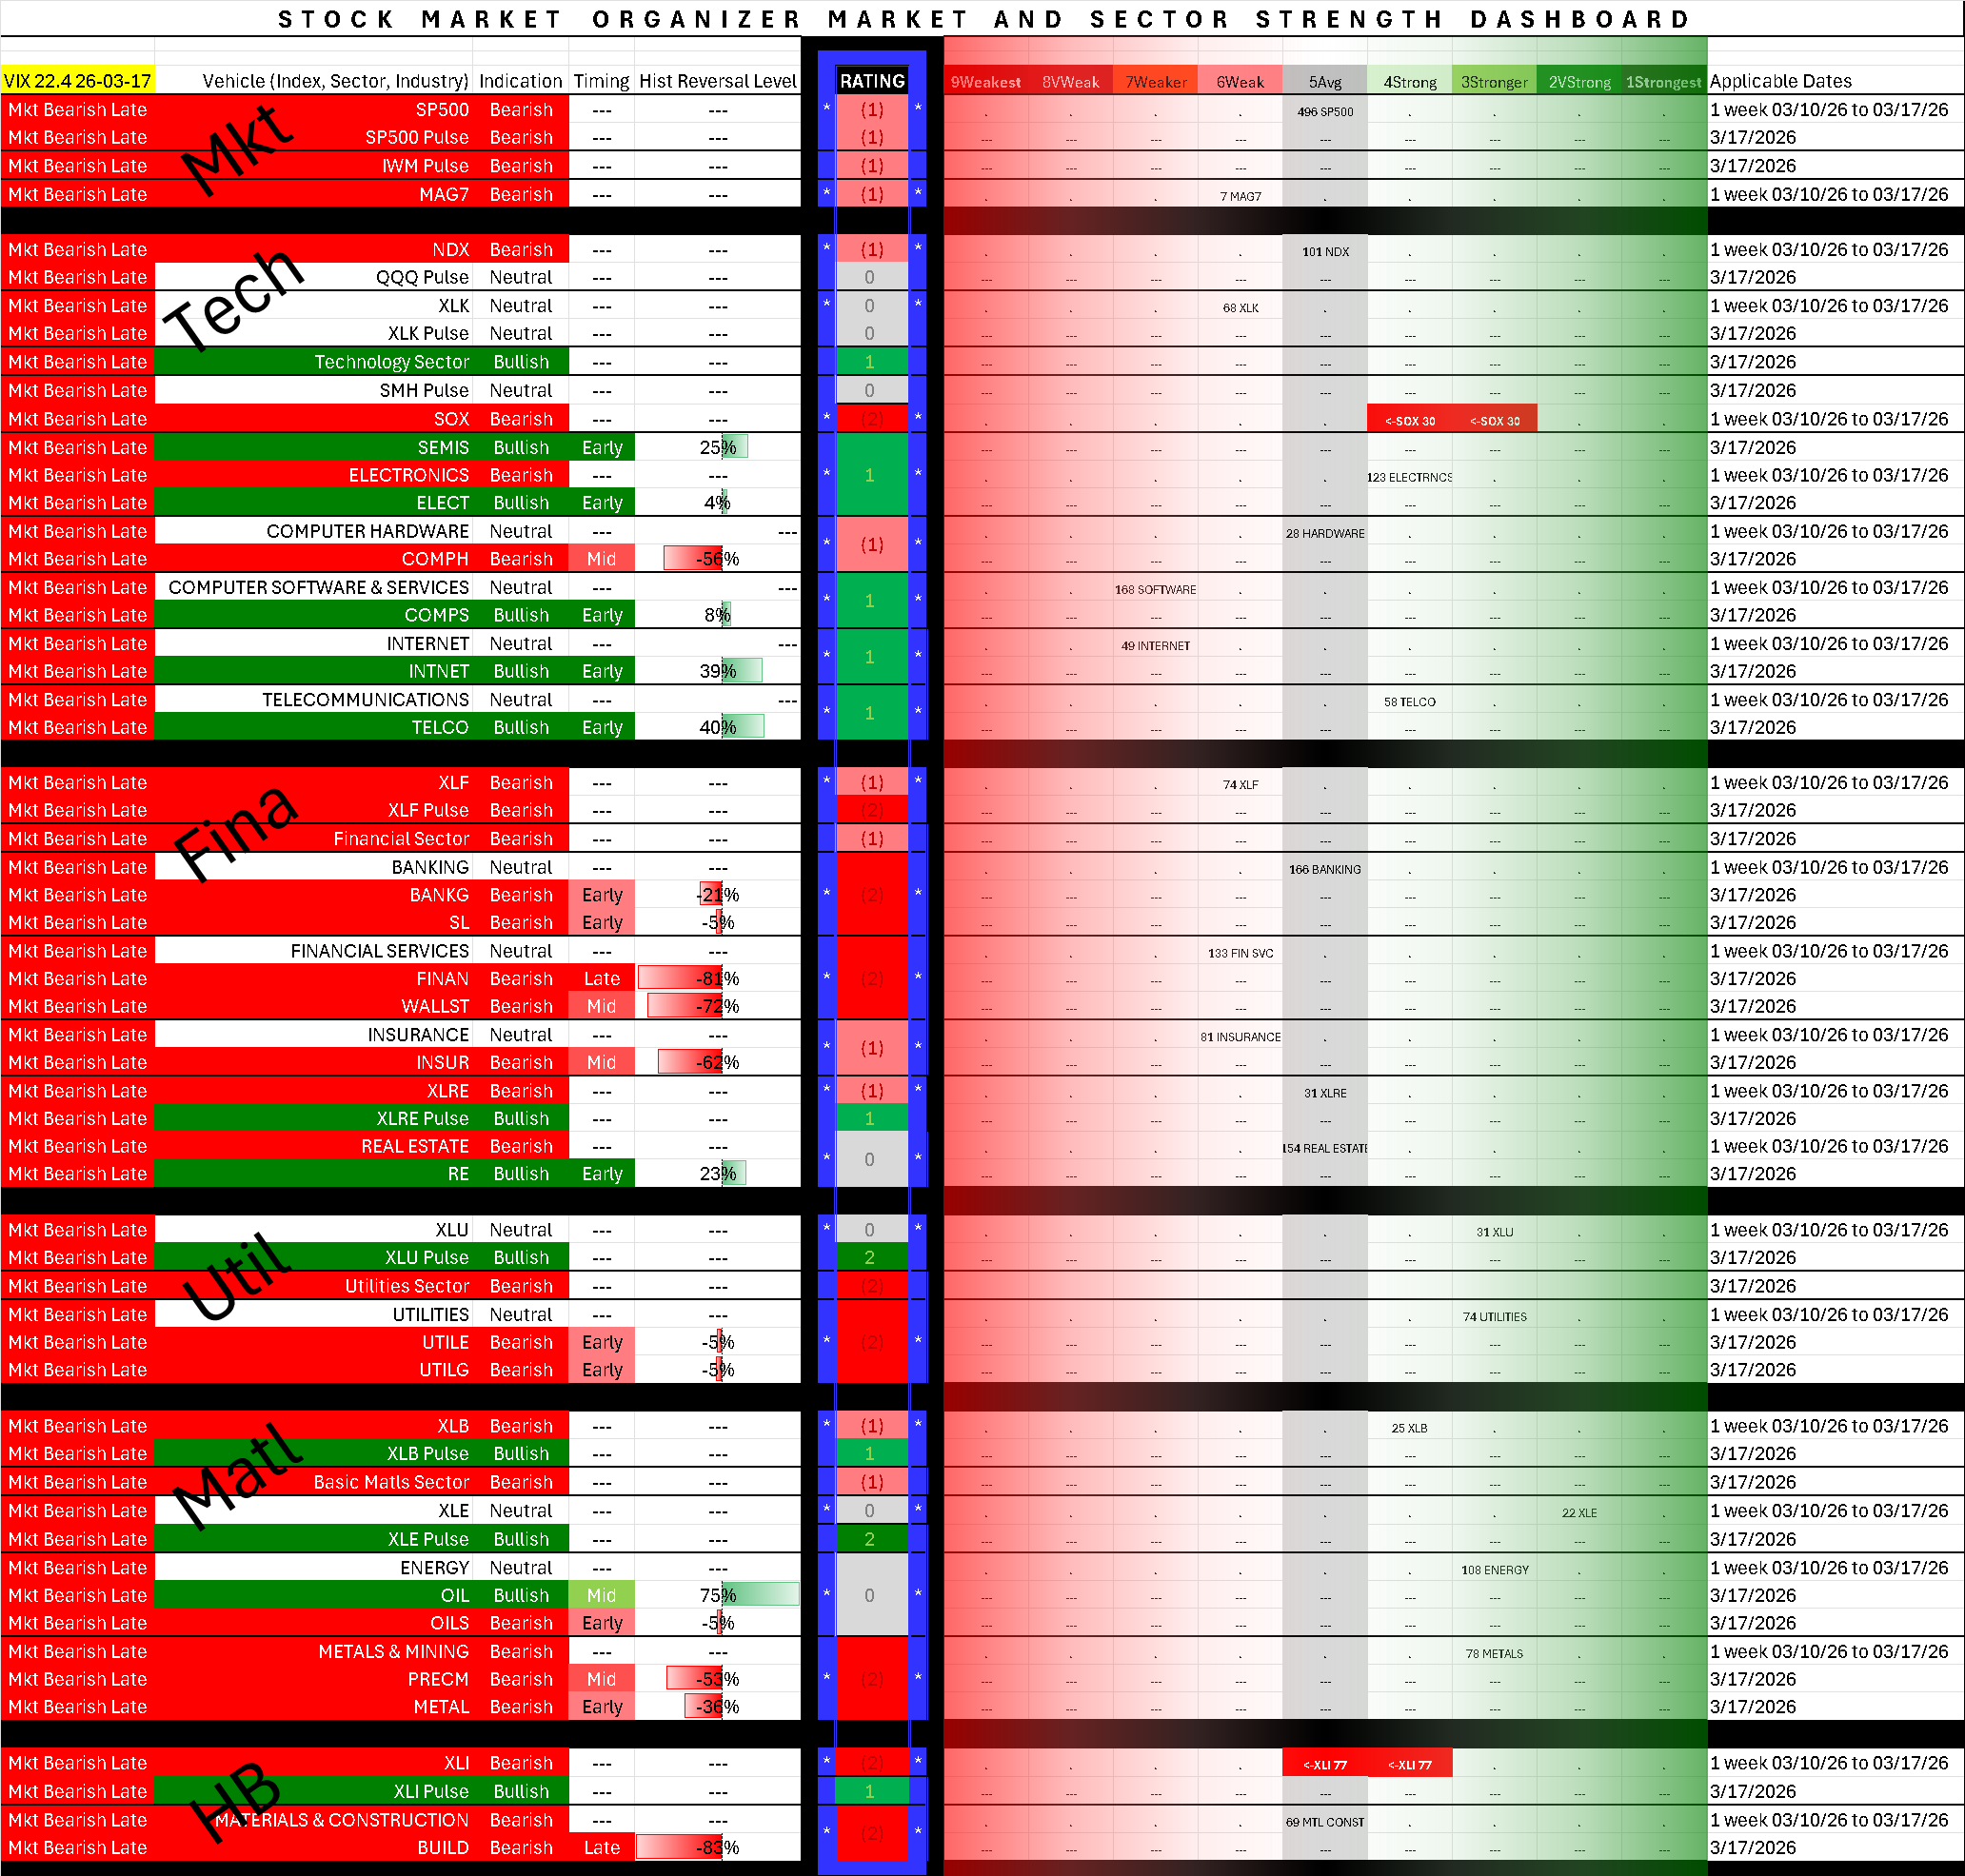
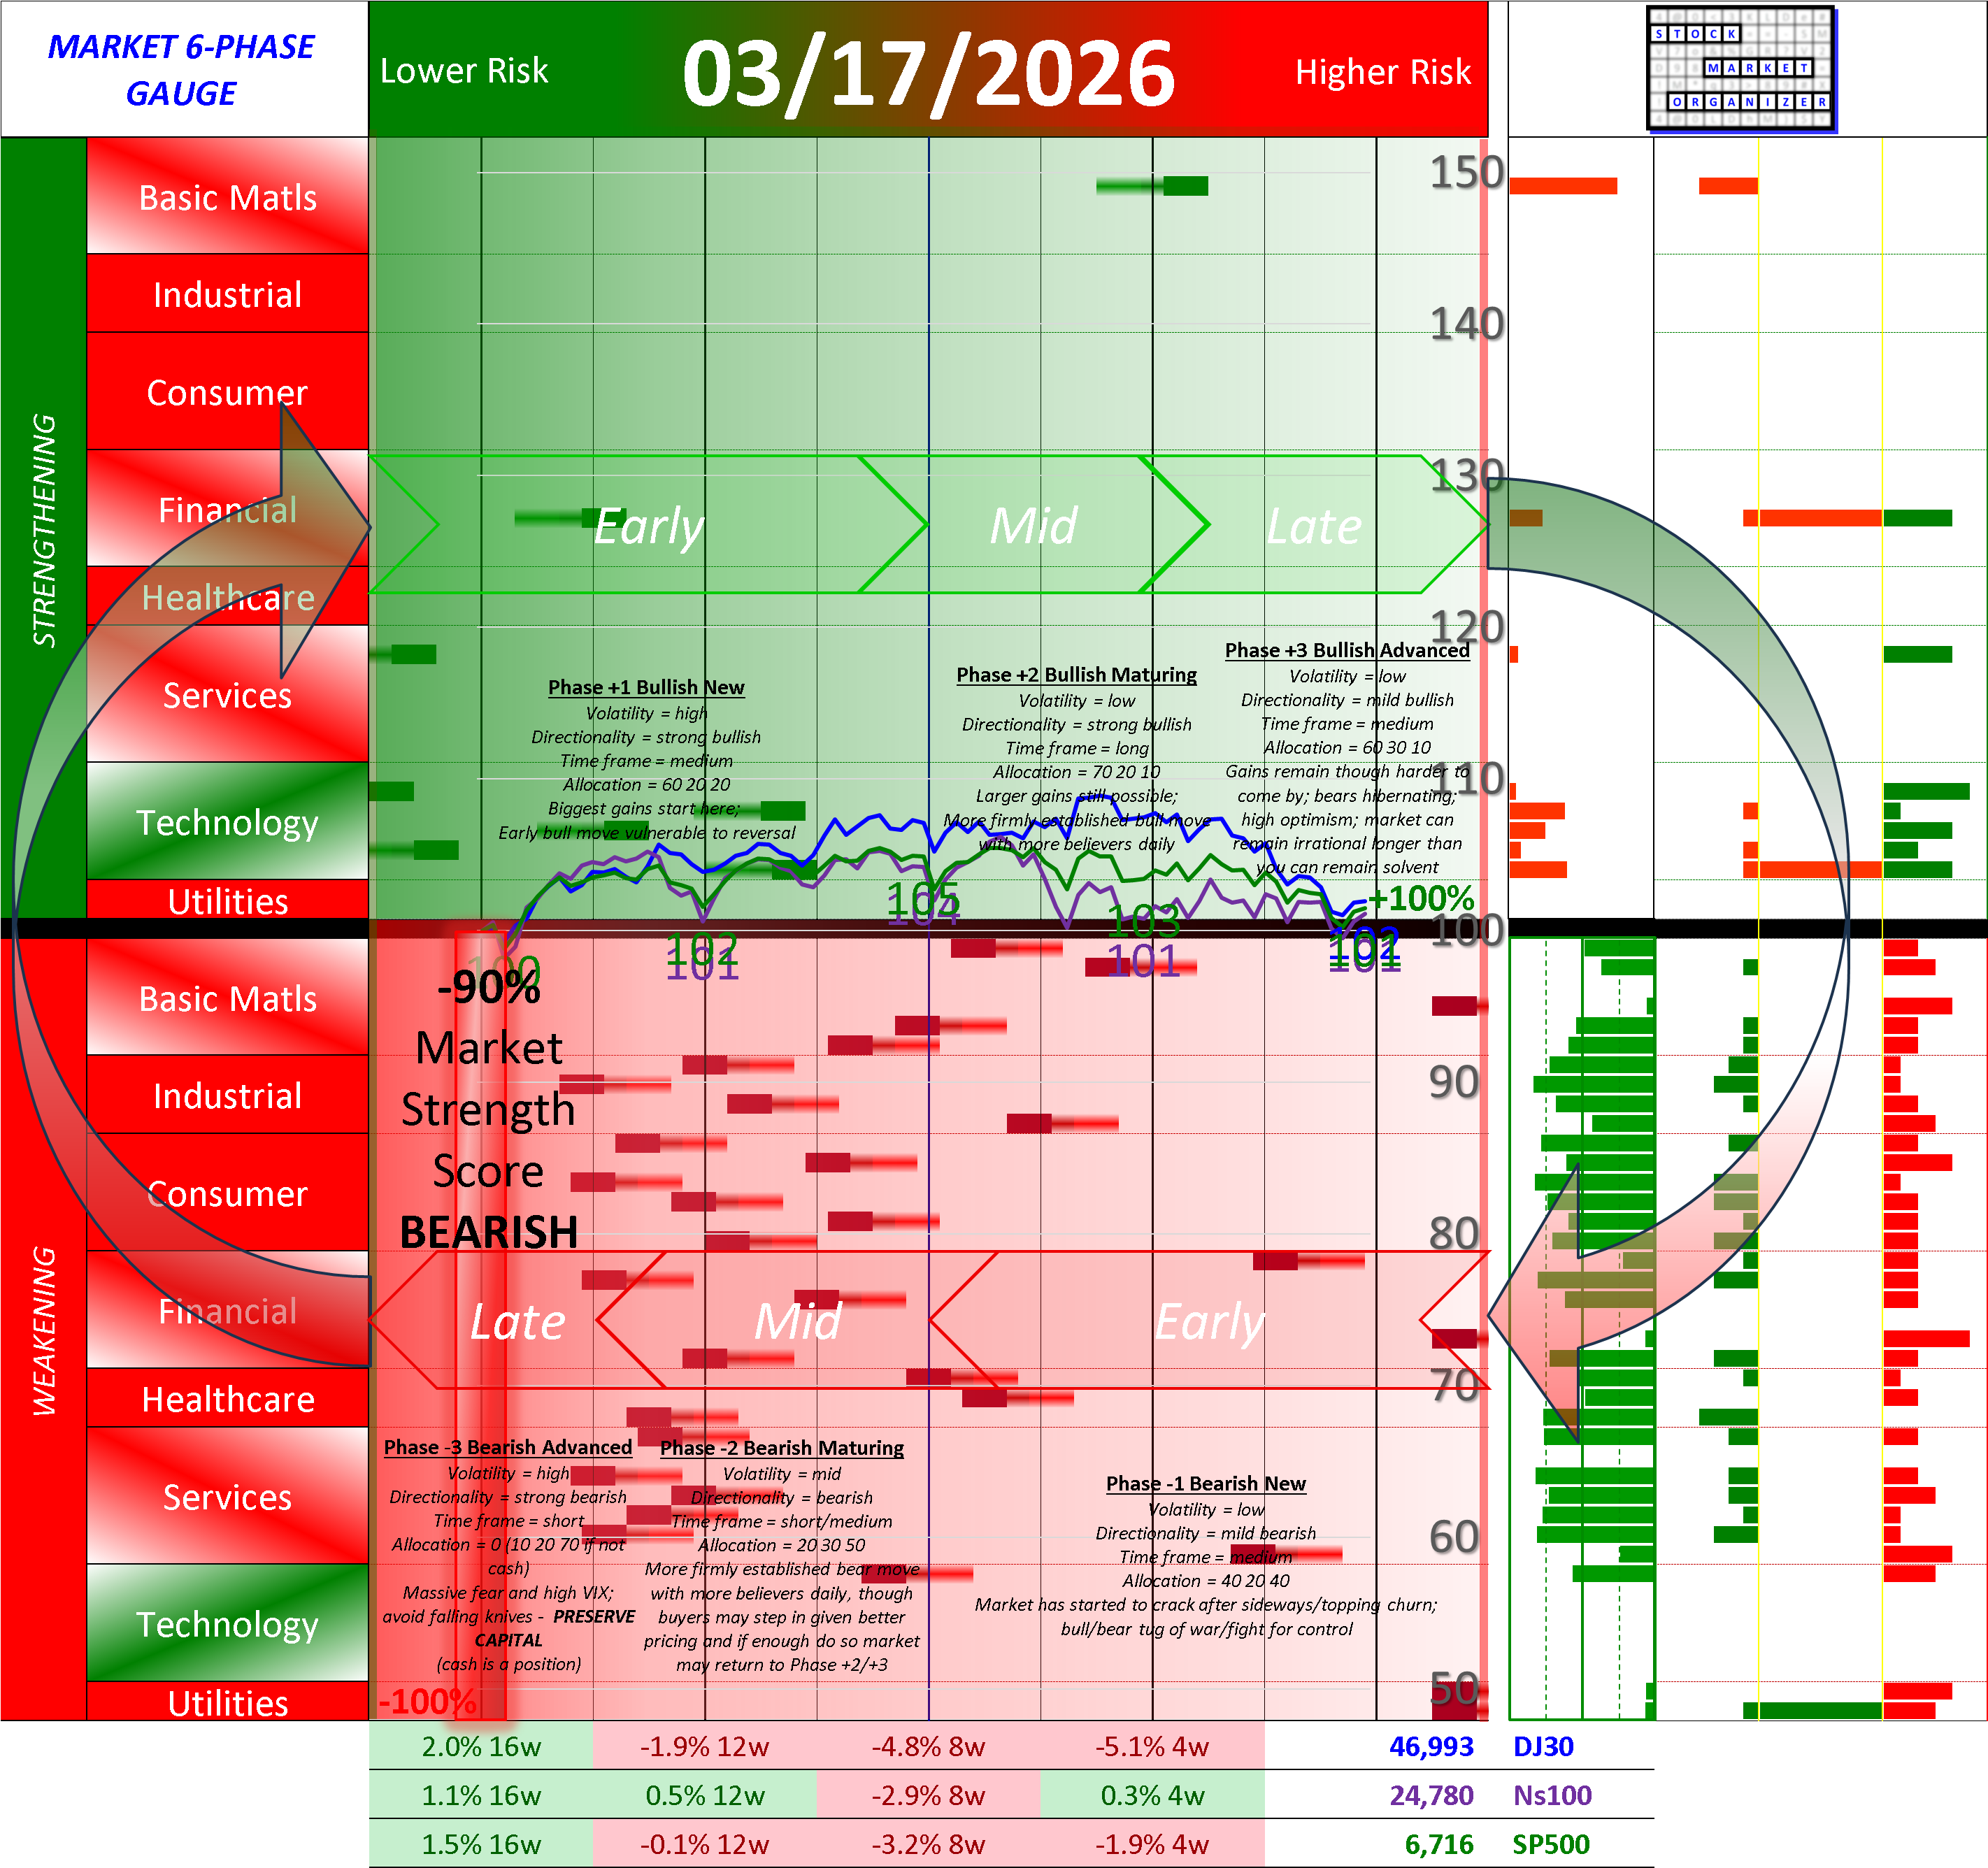
SMO Dashboard Tue 2026-03-17 (Market = Bearish Advanced Phase)

TLDR:
This dashboard uncovers strength and weakness at the market, sector, industry, sub-industry, and stock levels to aid decision-making in the prevailing market environment.
Commentary
The Market Strength Score is currently advanced stage Bearish. Be cautious - this is high risk territory.
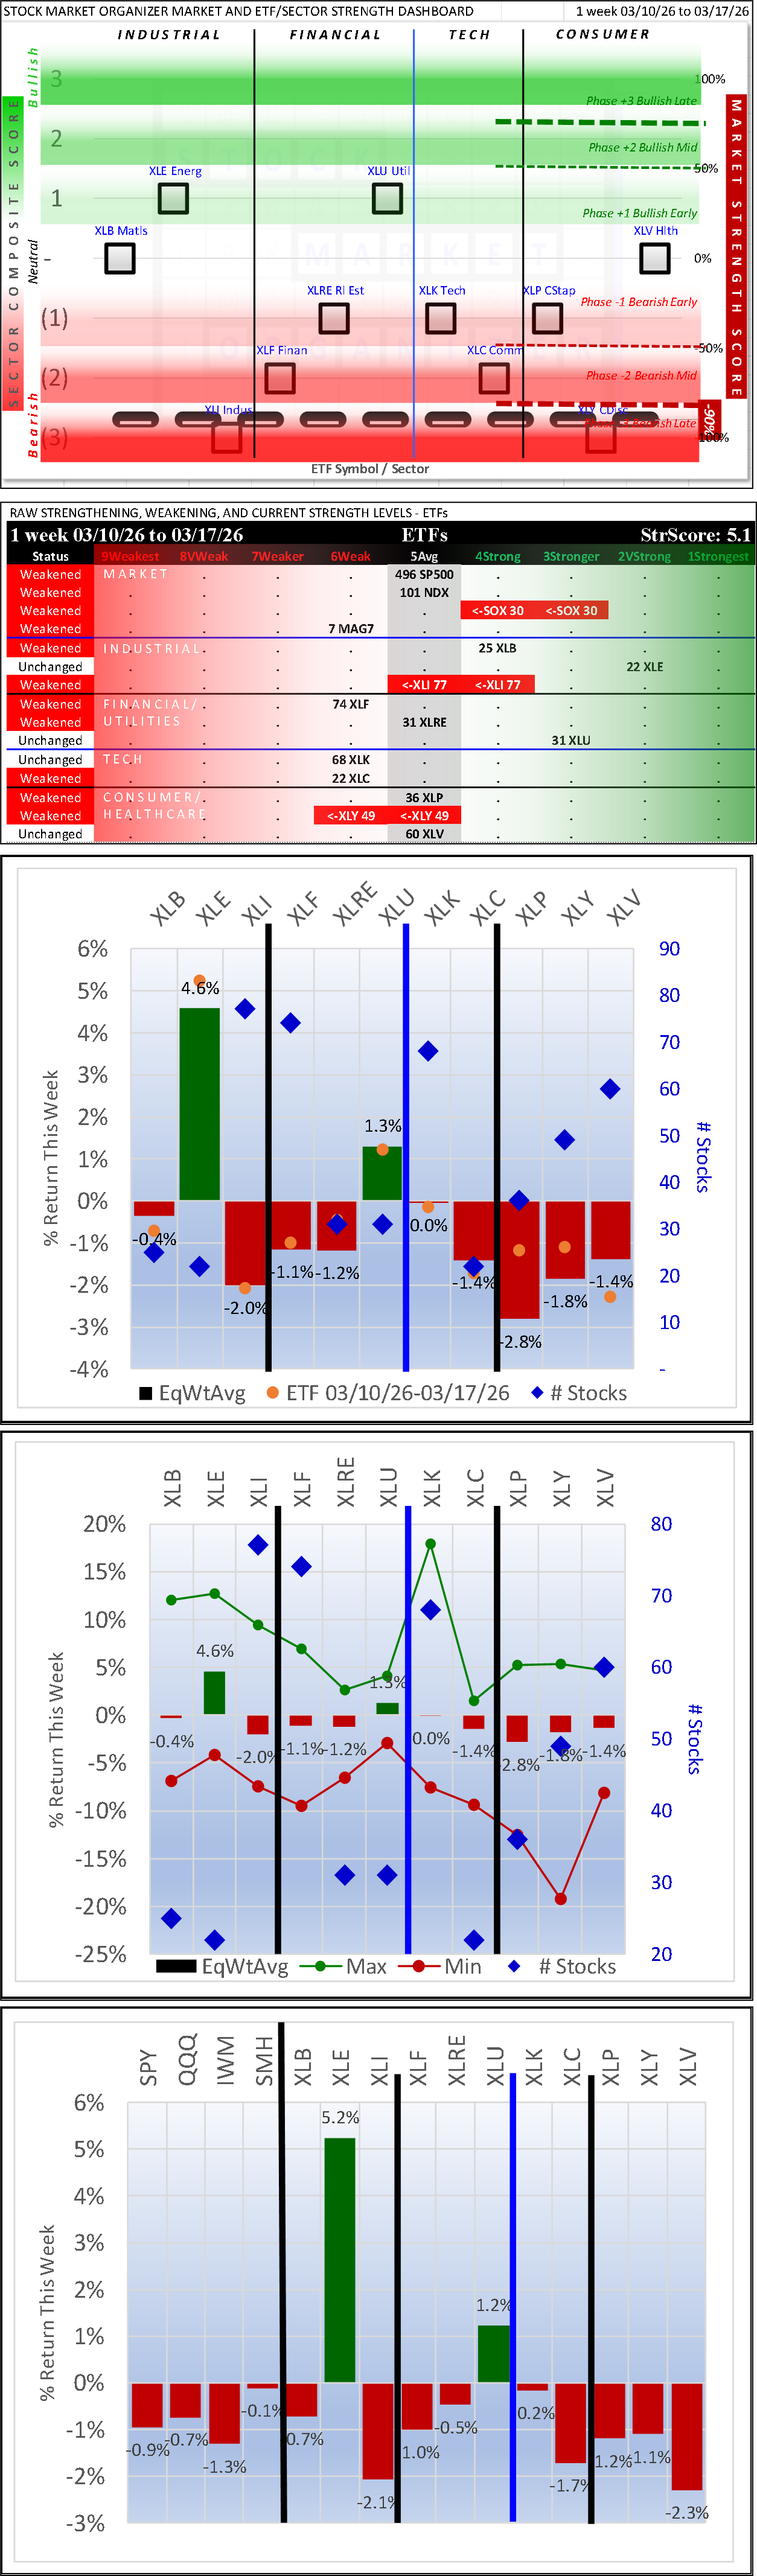
Tracked indexes performance this week:
- Strengthened/+1: None
- Strengthened/0: None
- Unchanged: None
- Weakened/0 SP500 (5Average), NDX (5Average), MAG7 (6Weak)
- Weakened/-1: SOX (4Strong)
The dashboard is widespread red- that said, Technology is certainly showing relative strength. Financials are red while Real Estate is showing signs of life. Utilities are weak. Energy/Oil is mixed. Metals are weak.
The column labeled "Rating" reflects the strength (based on this system's criteria) of the individual vehicle (index, sector, or industry).
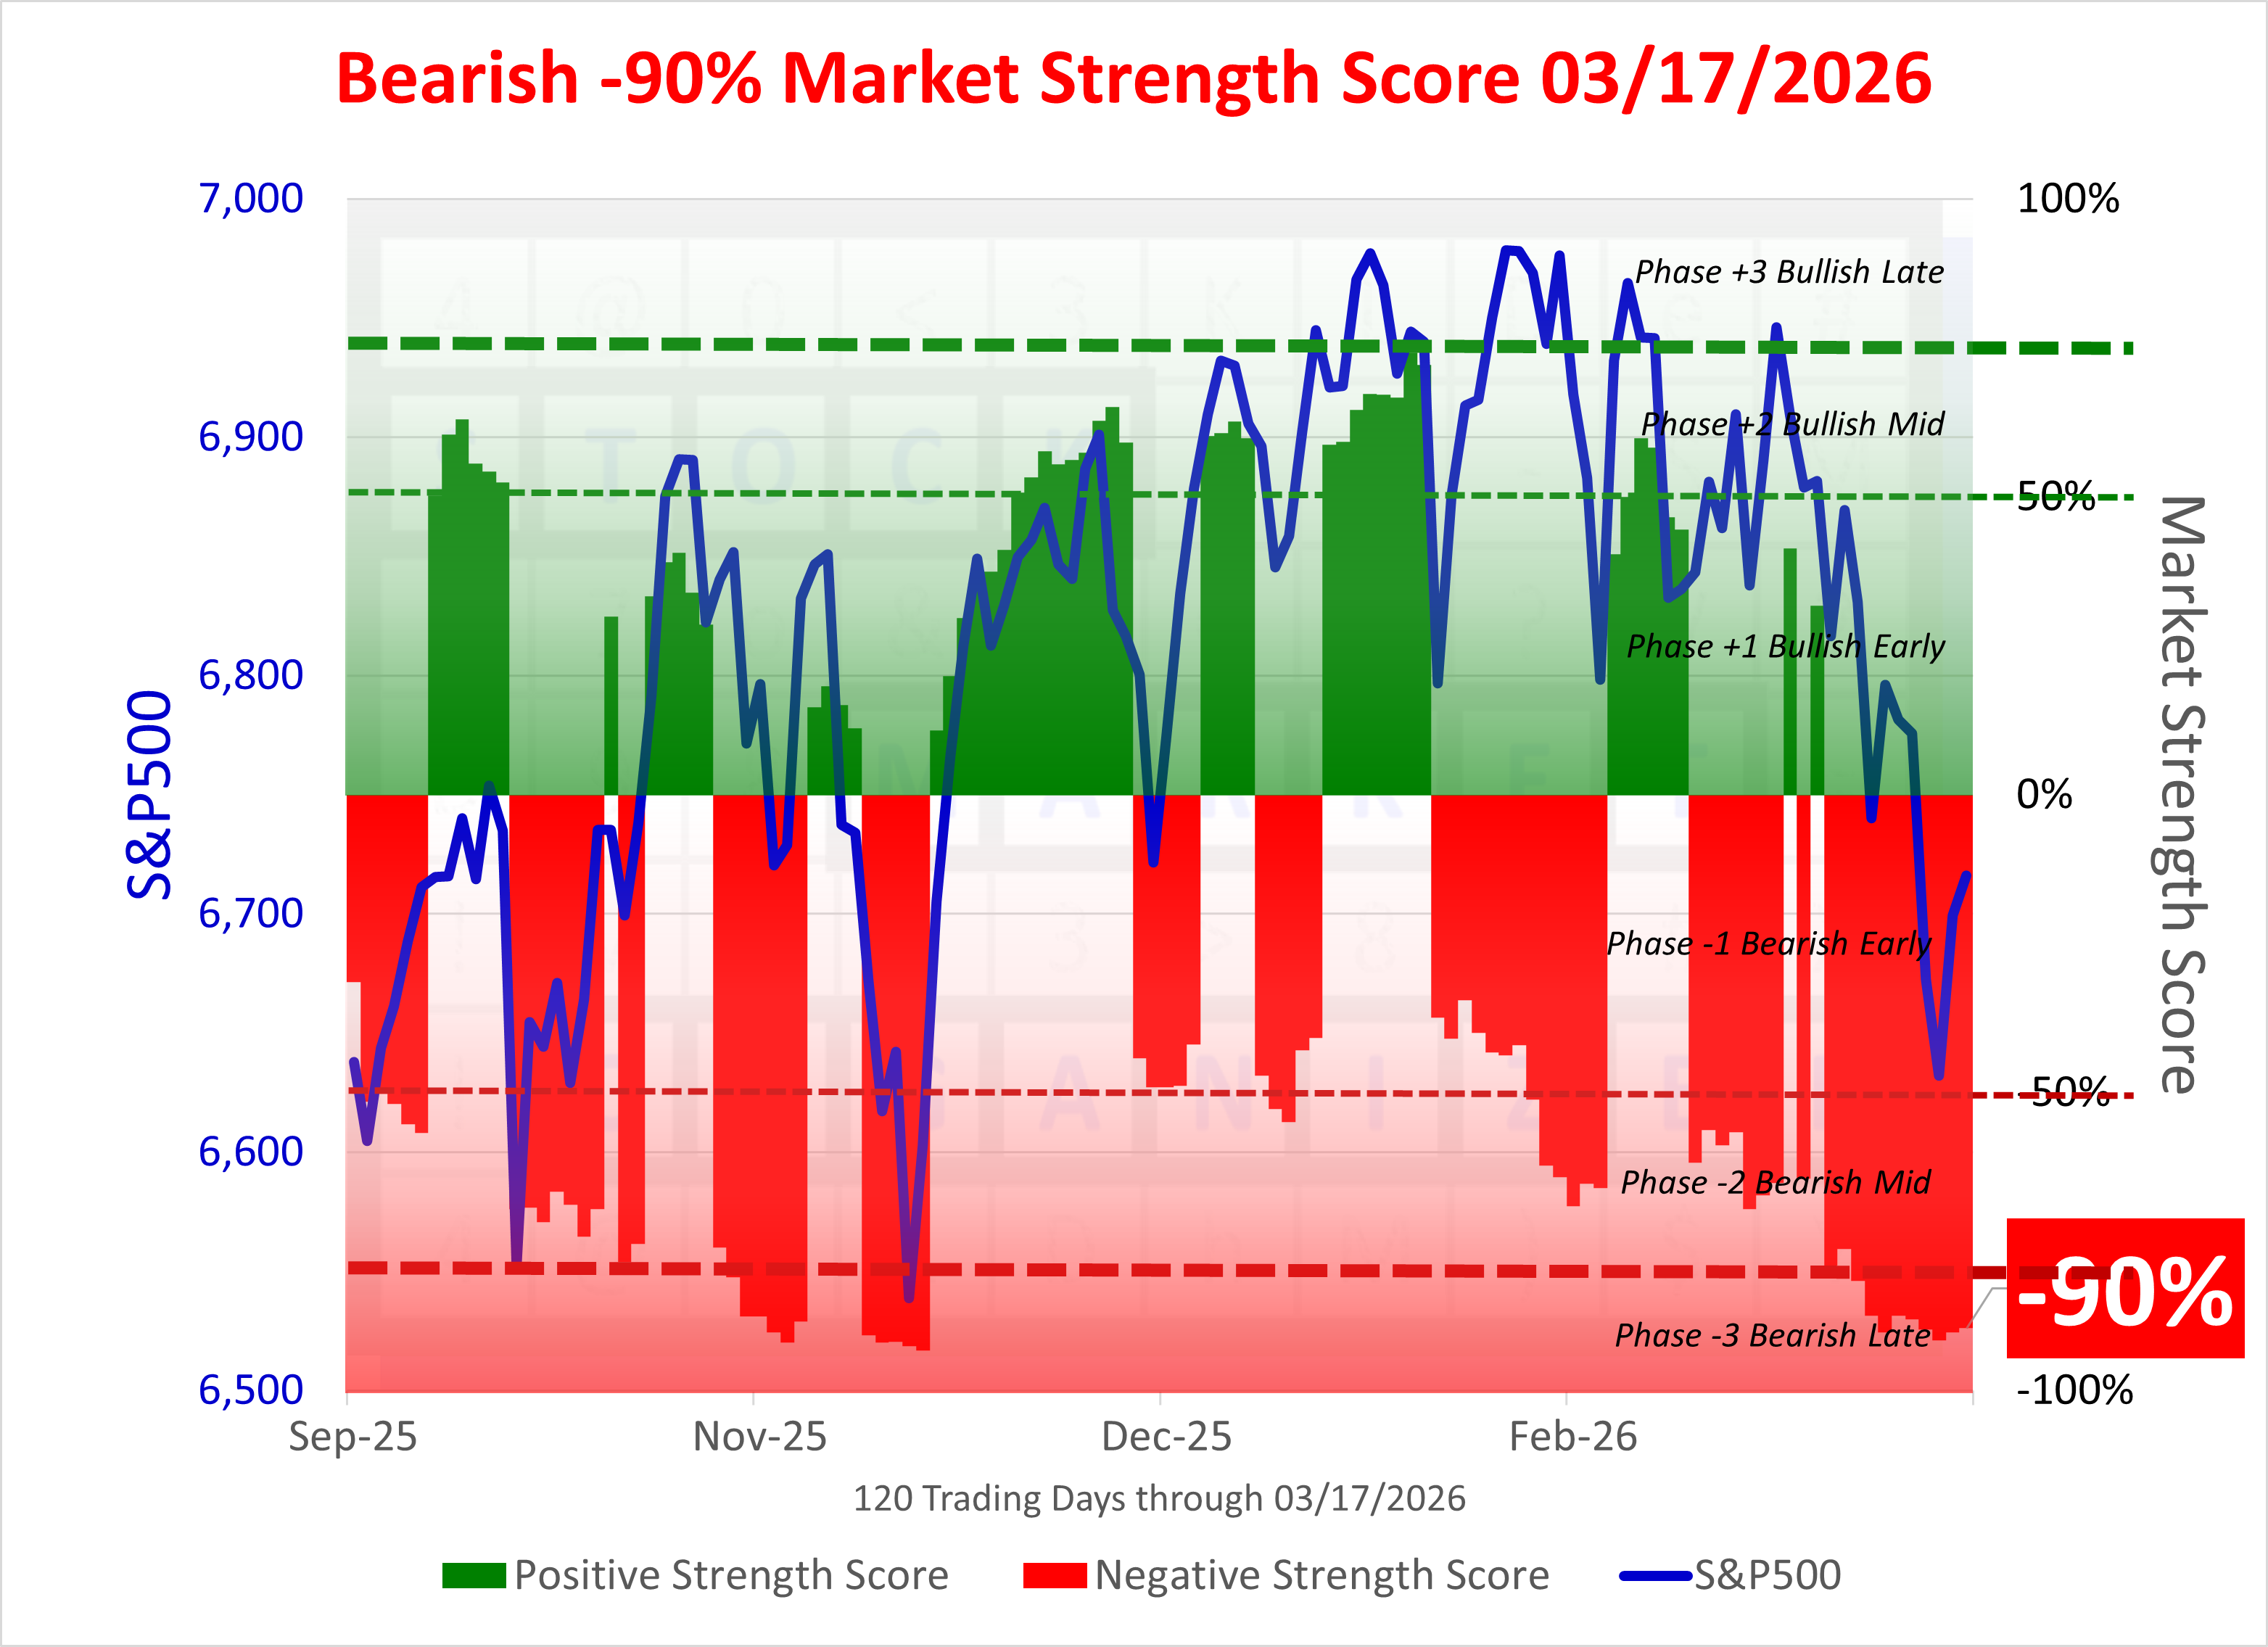
Market Strength Score
Currently -90%, Phase -3 Bearish Advanced. Expect volatility with the possibility of a cascading decline, though be ready to turn positive even if the headlines seem dismal (see this post for an example of this concept).
SPDR Sector ETFs Detail
XLE Energy and XLU Utilities were on the green side this week as XLI Industrials and XLY Consumer Discretionary lagged.
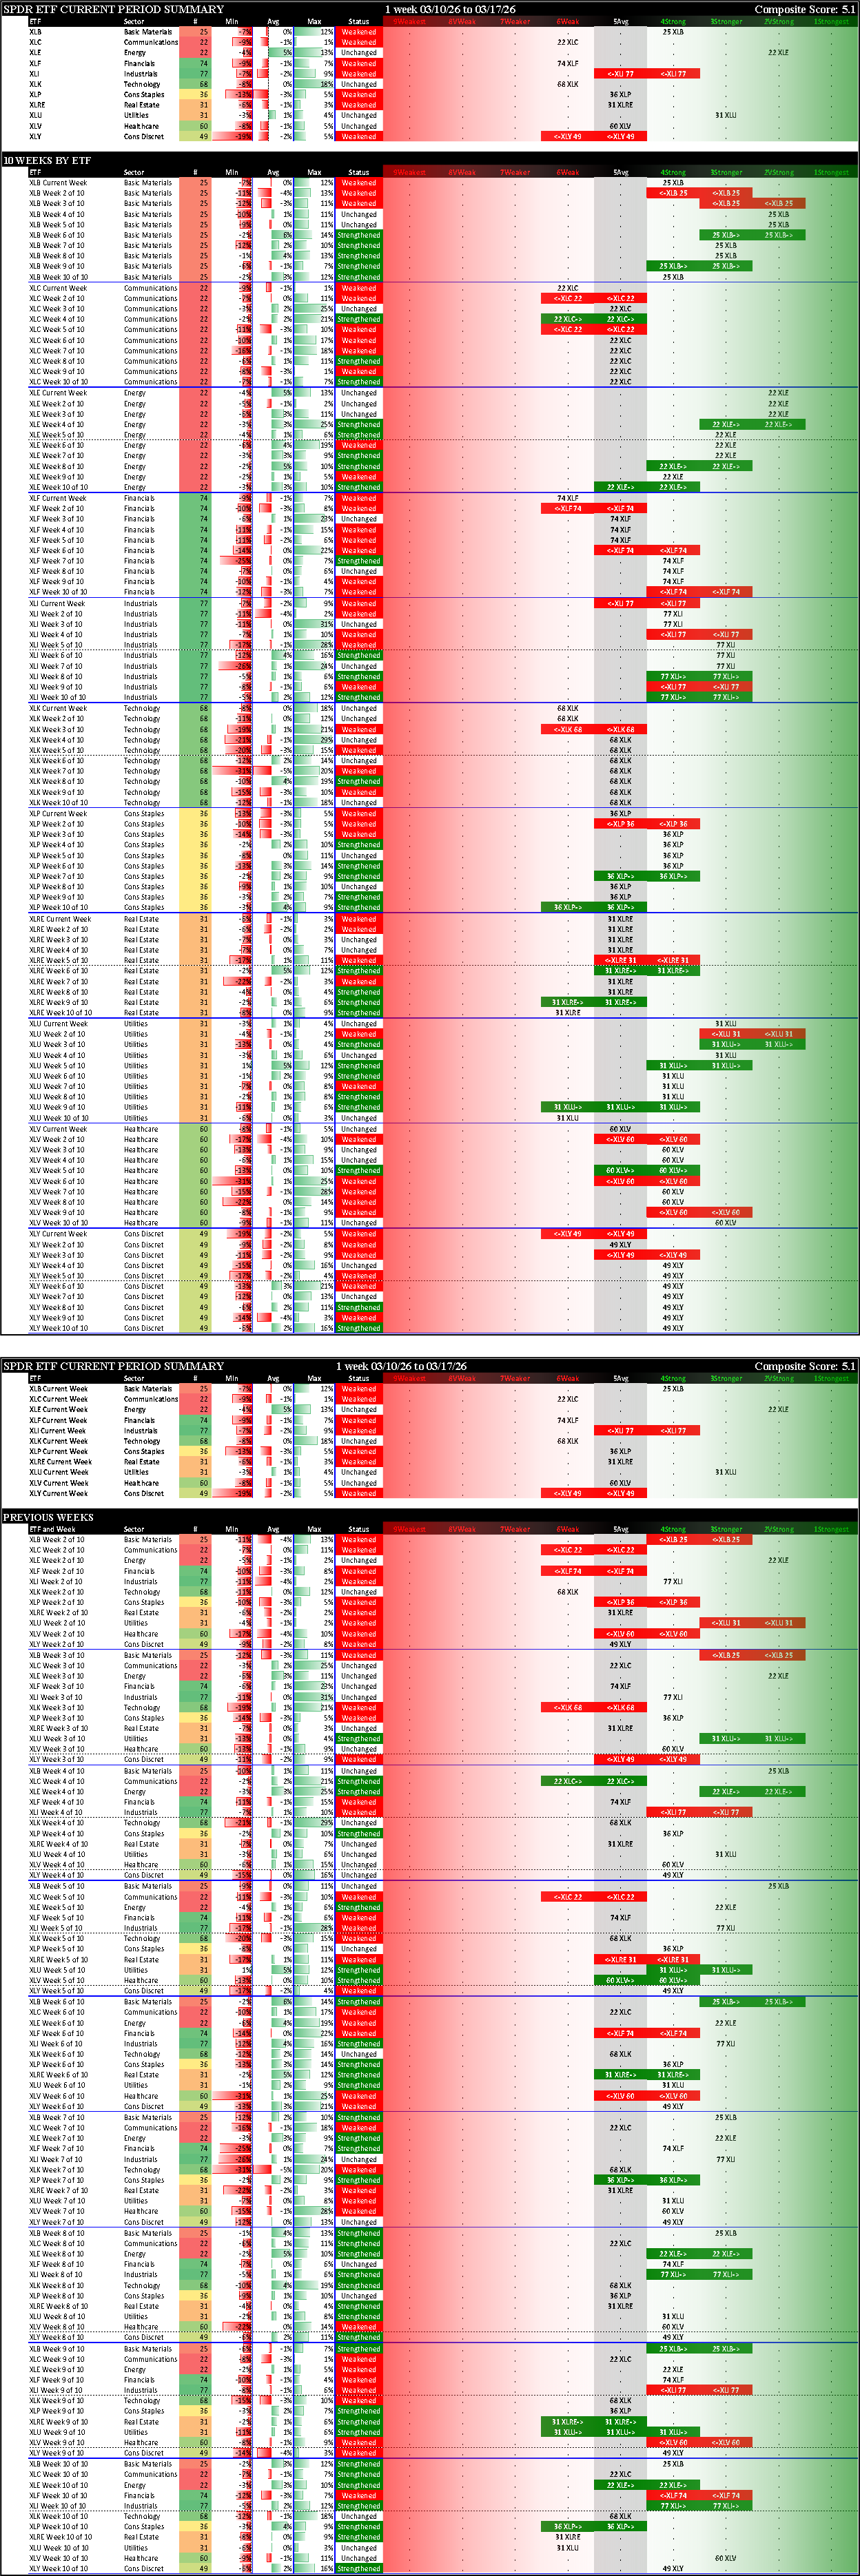
Context - 10 Week Lookbacks, by ETF and by Week
Four of 11 sectors were unchanged (XLE Energy, XLK Technology, XLU Utilities, and XLV Health Care), while the remaining 7 weakened, two enough to change ratings (XLI Industrials and XLY Health Care).
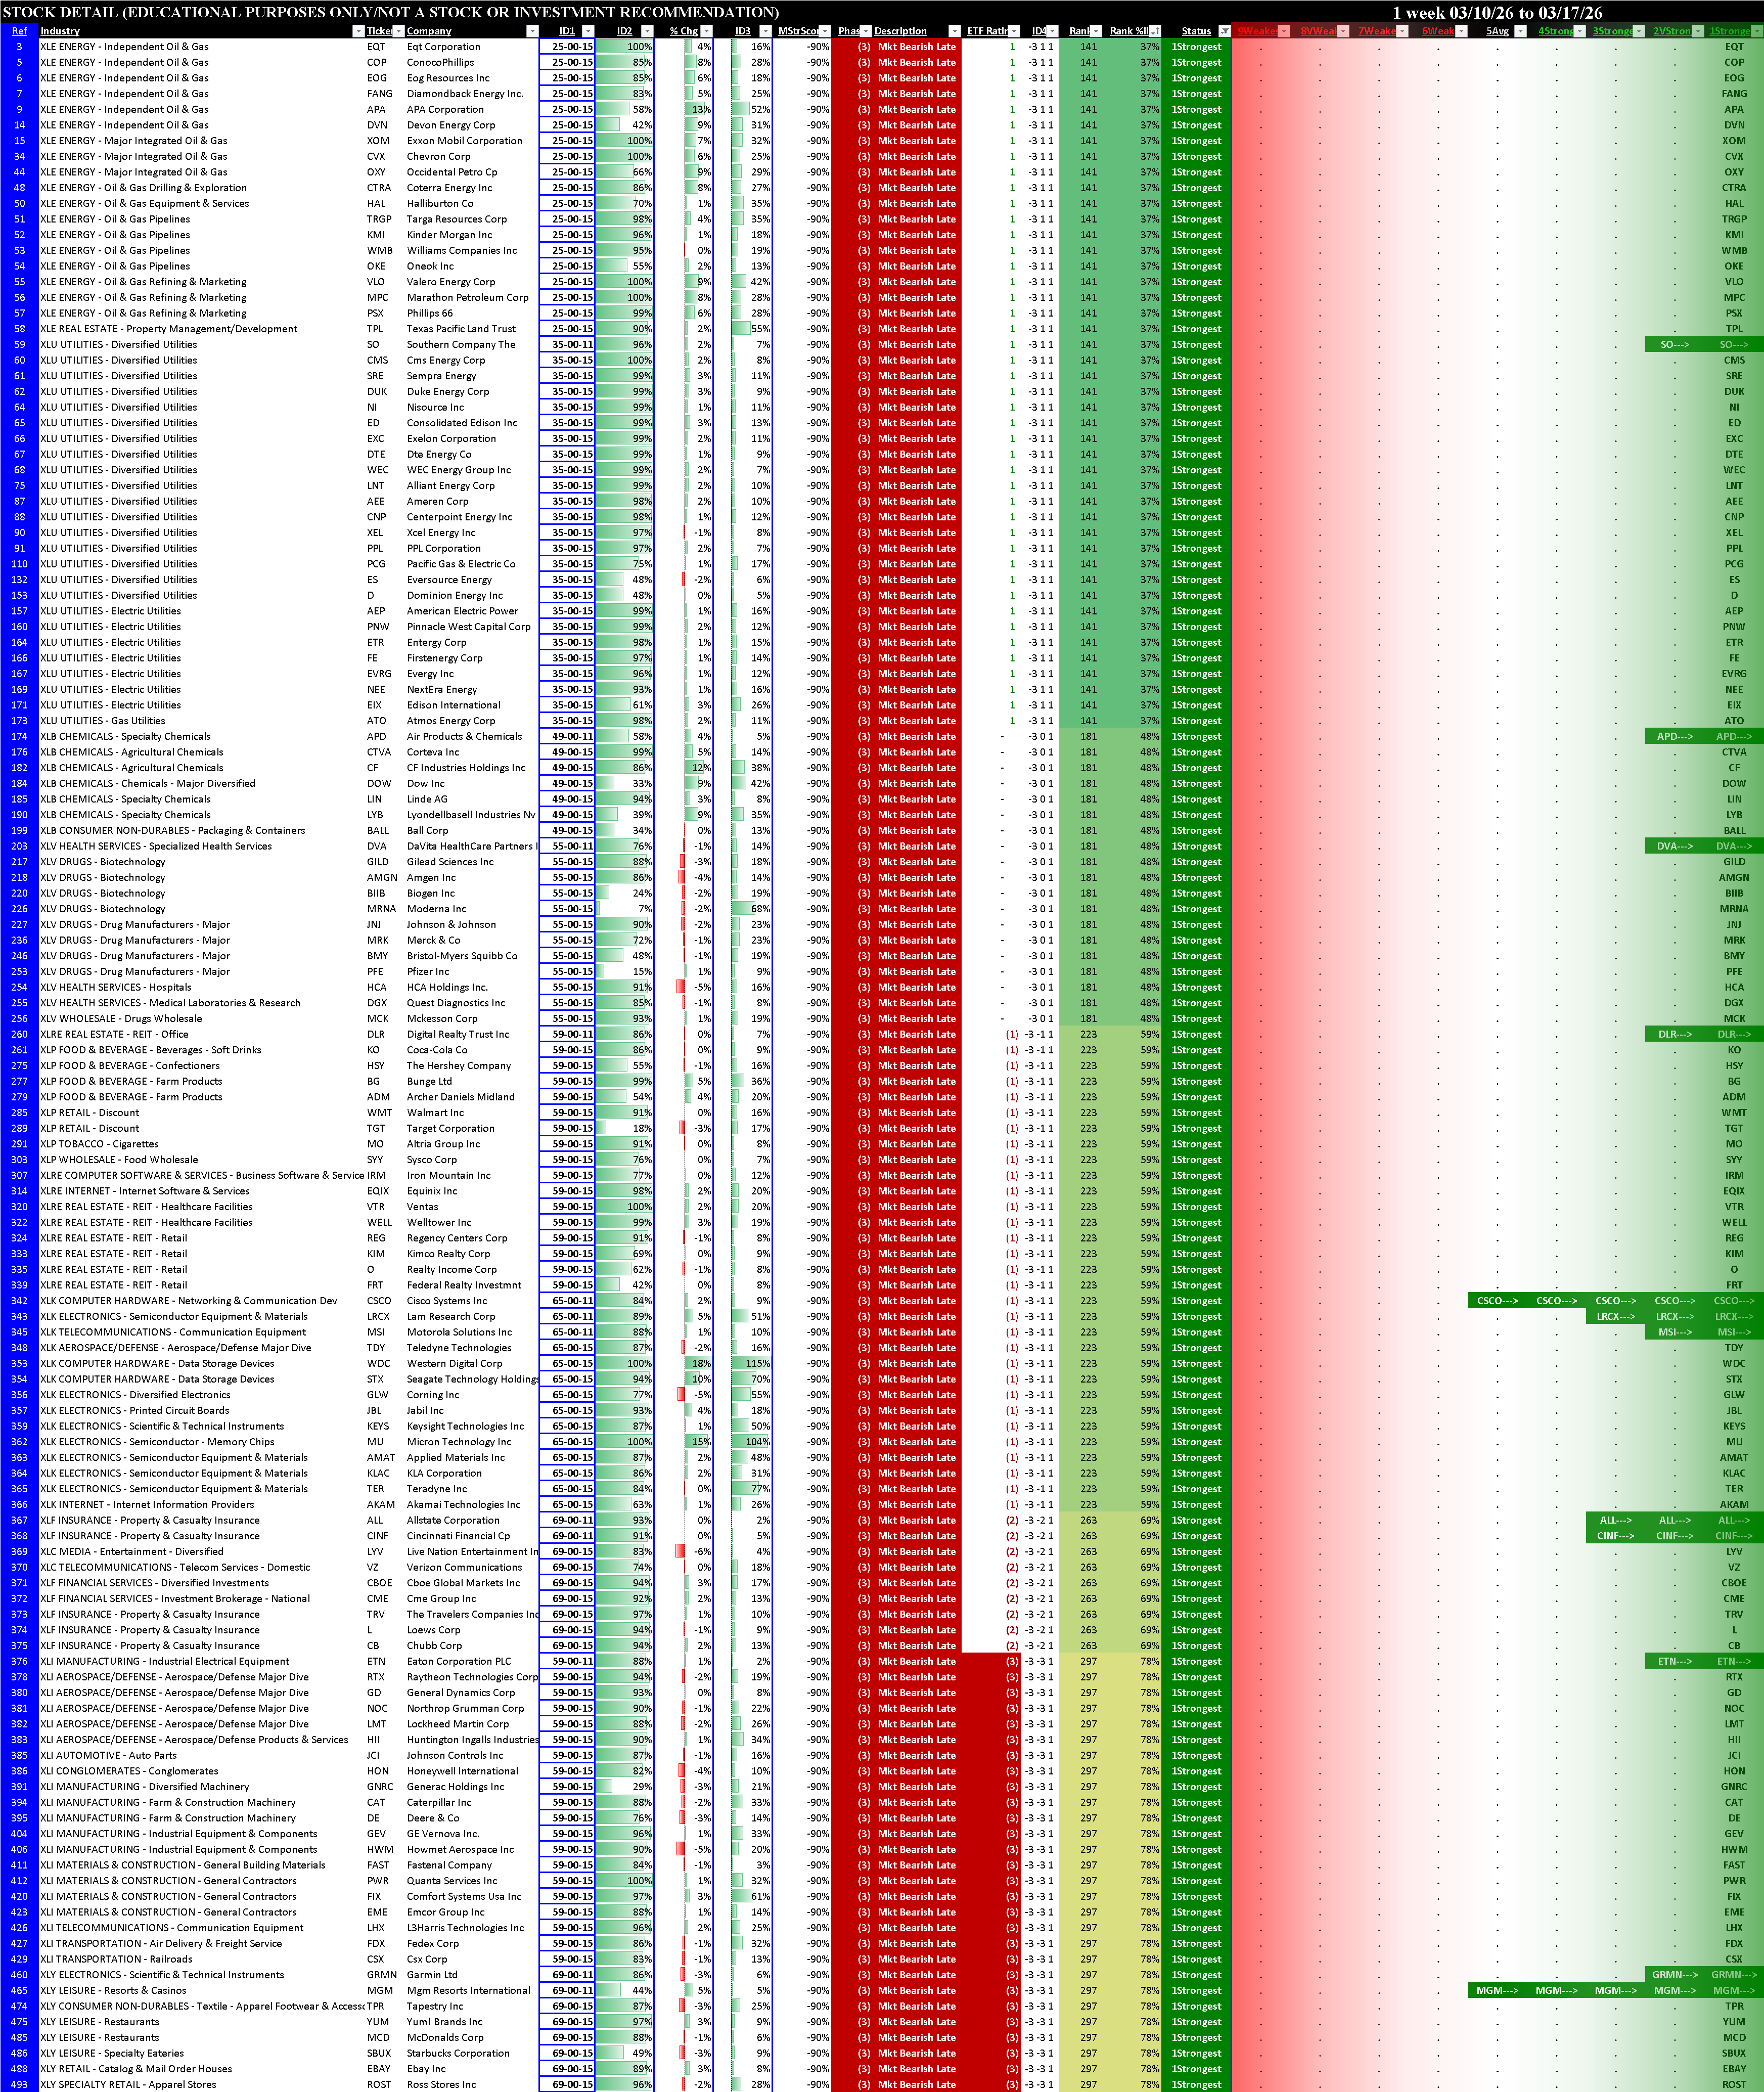
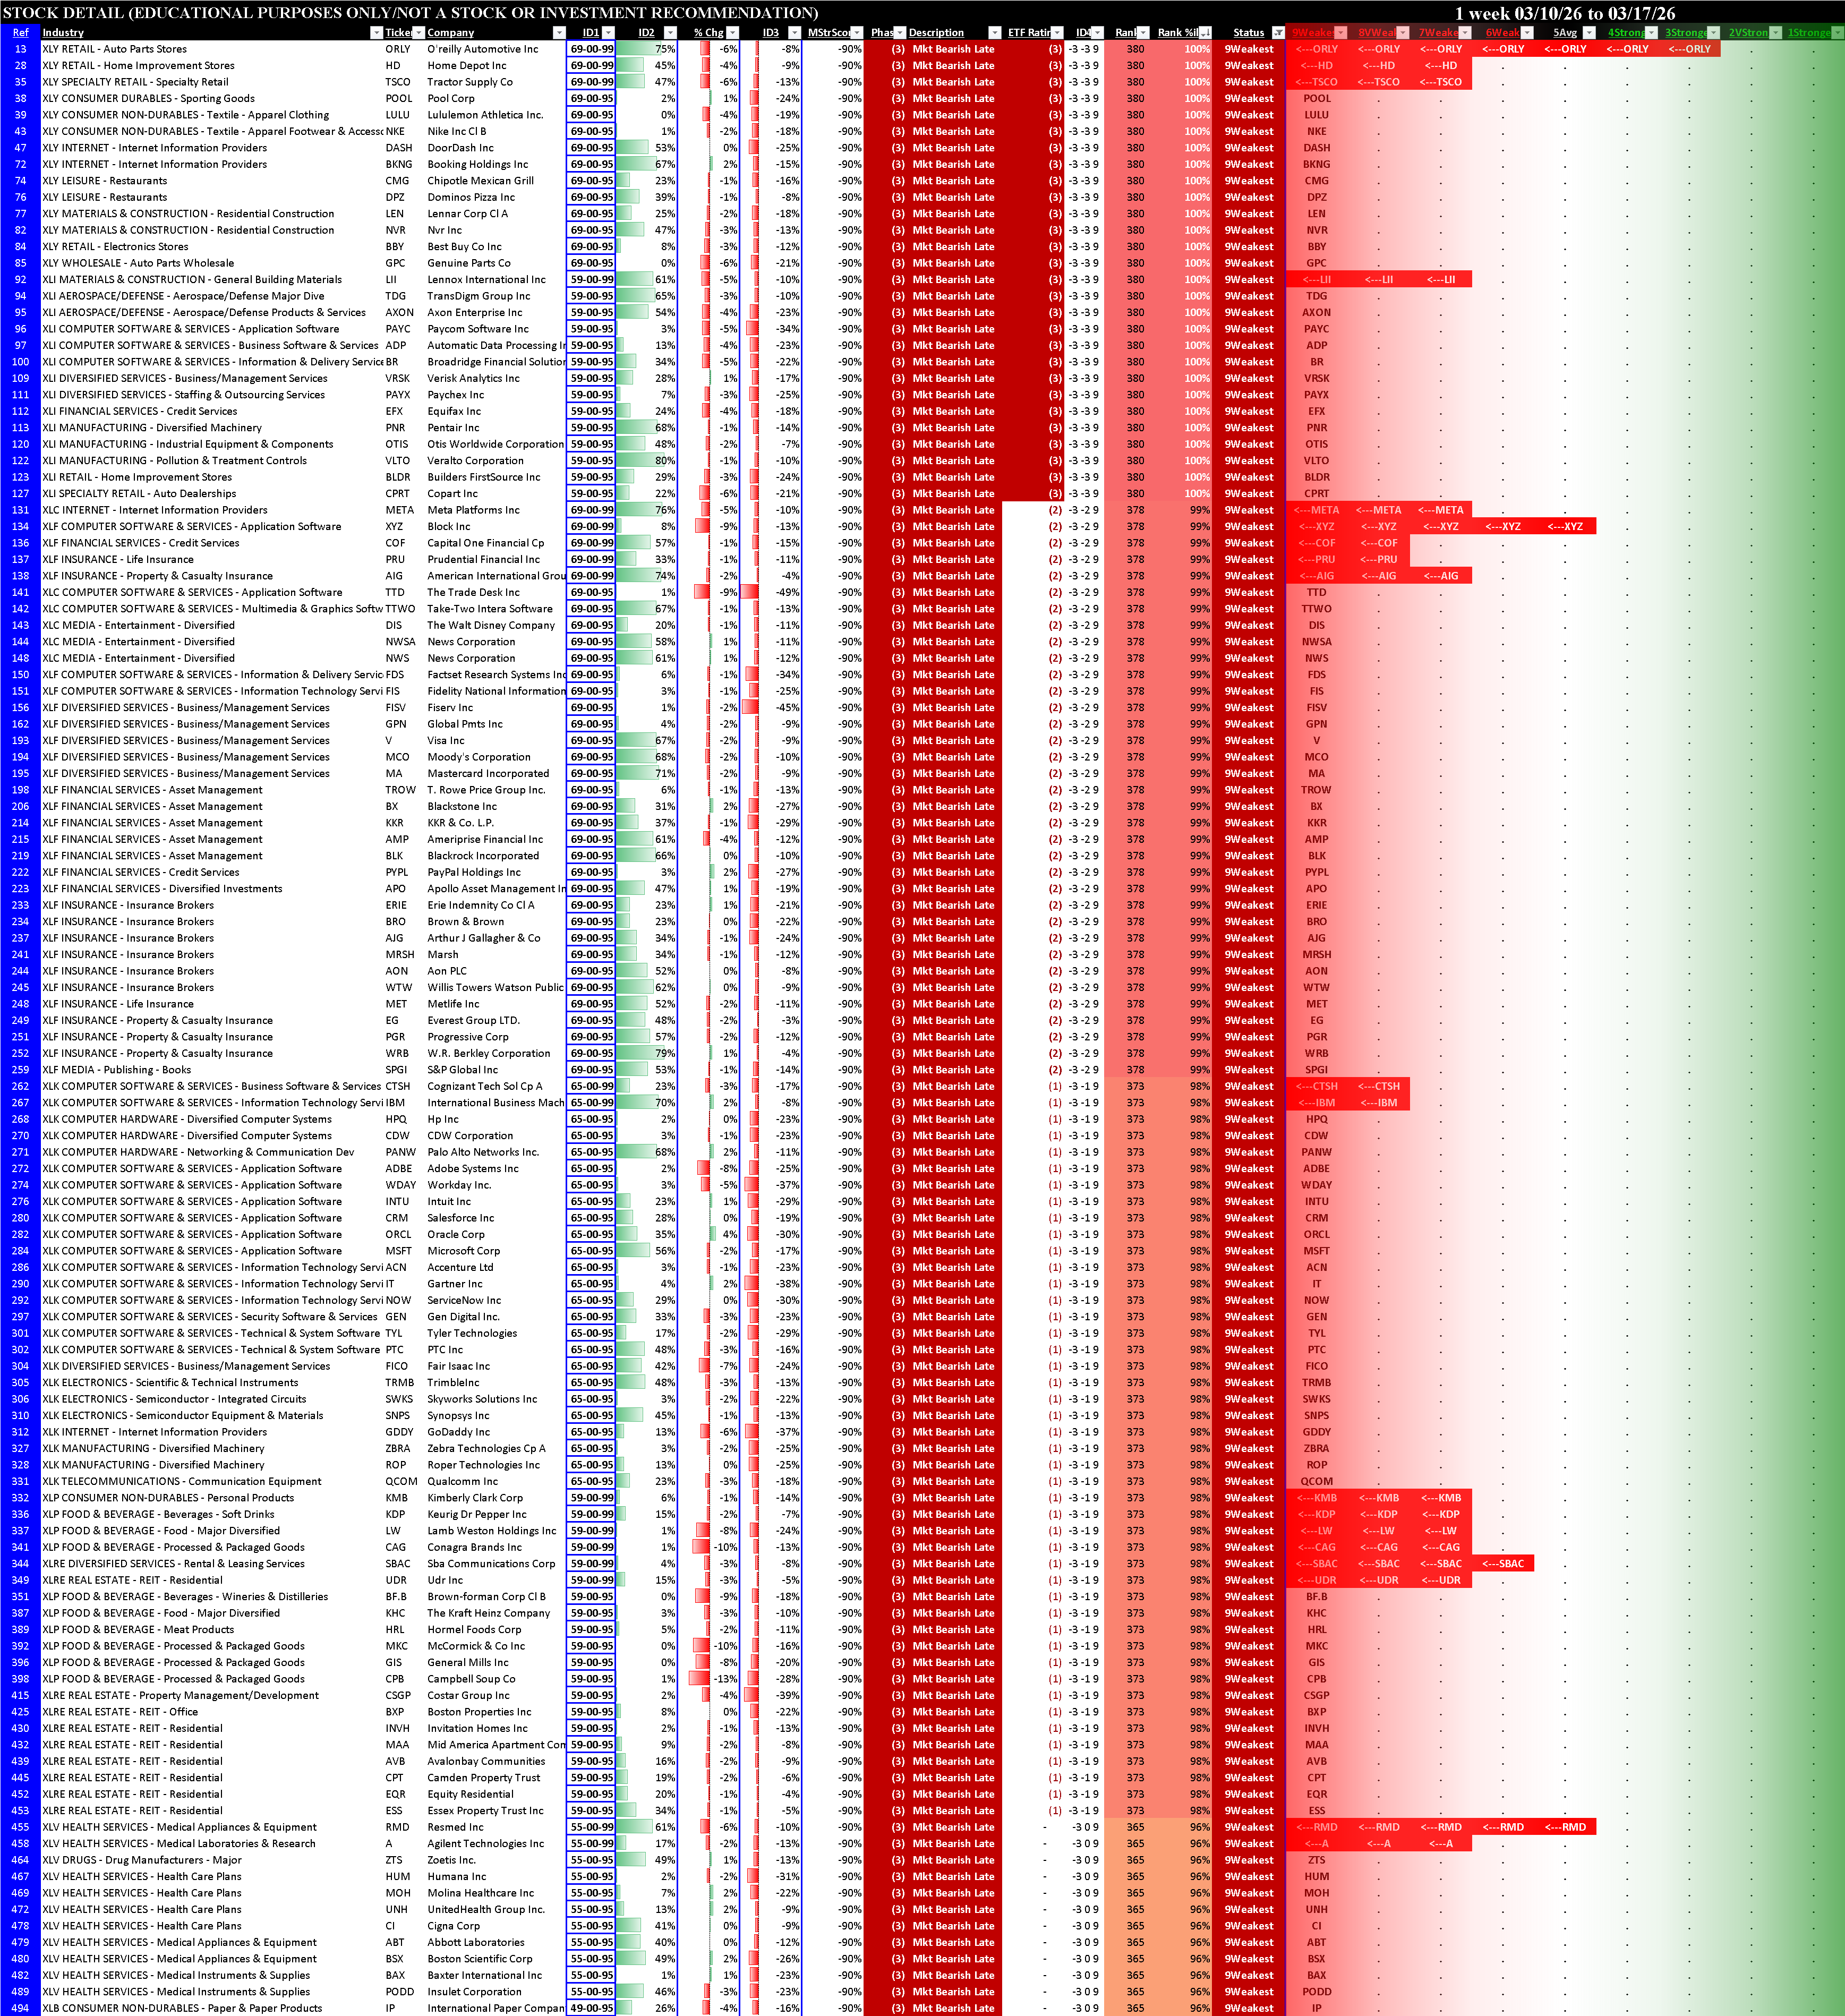
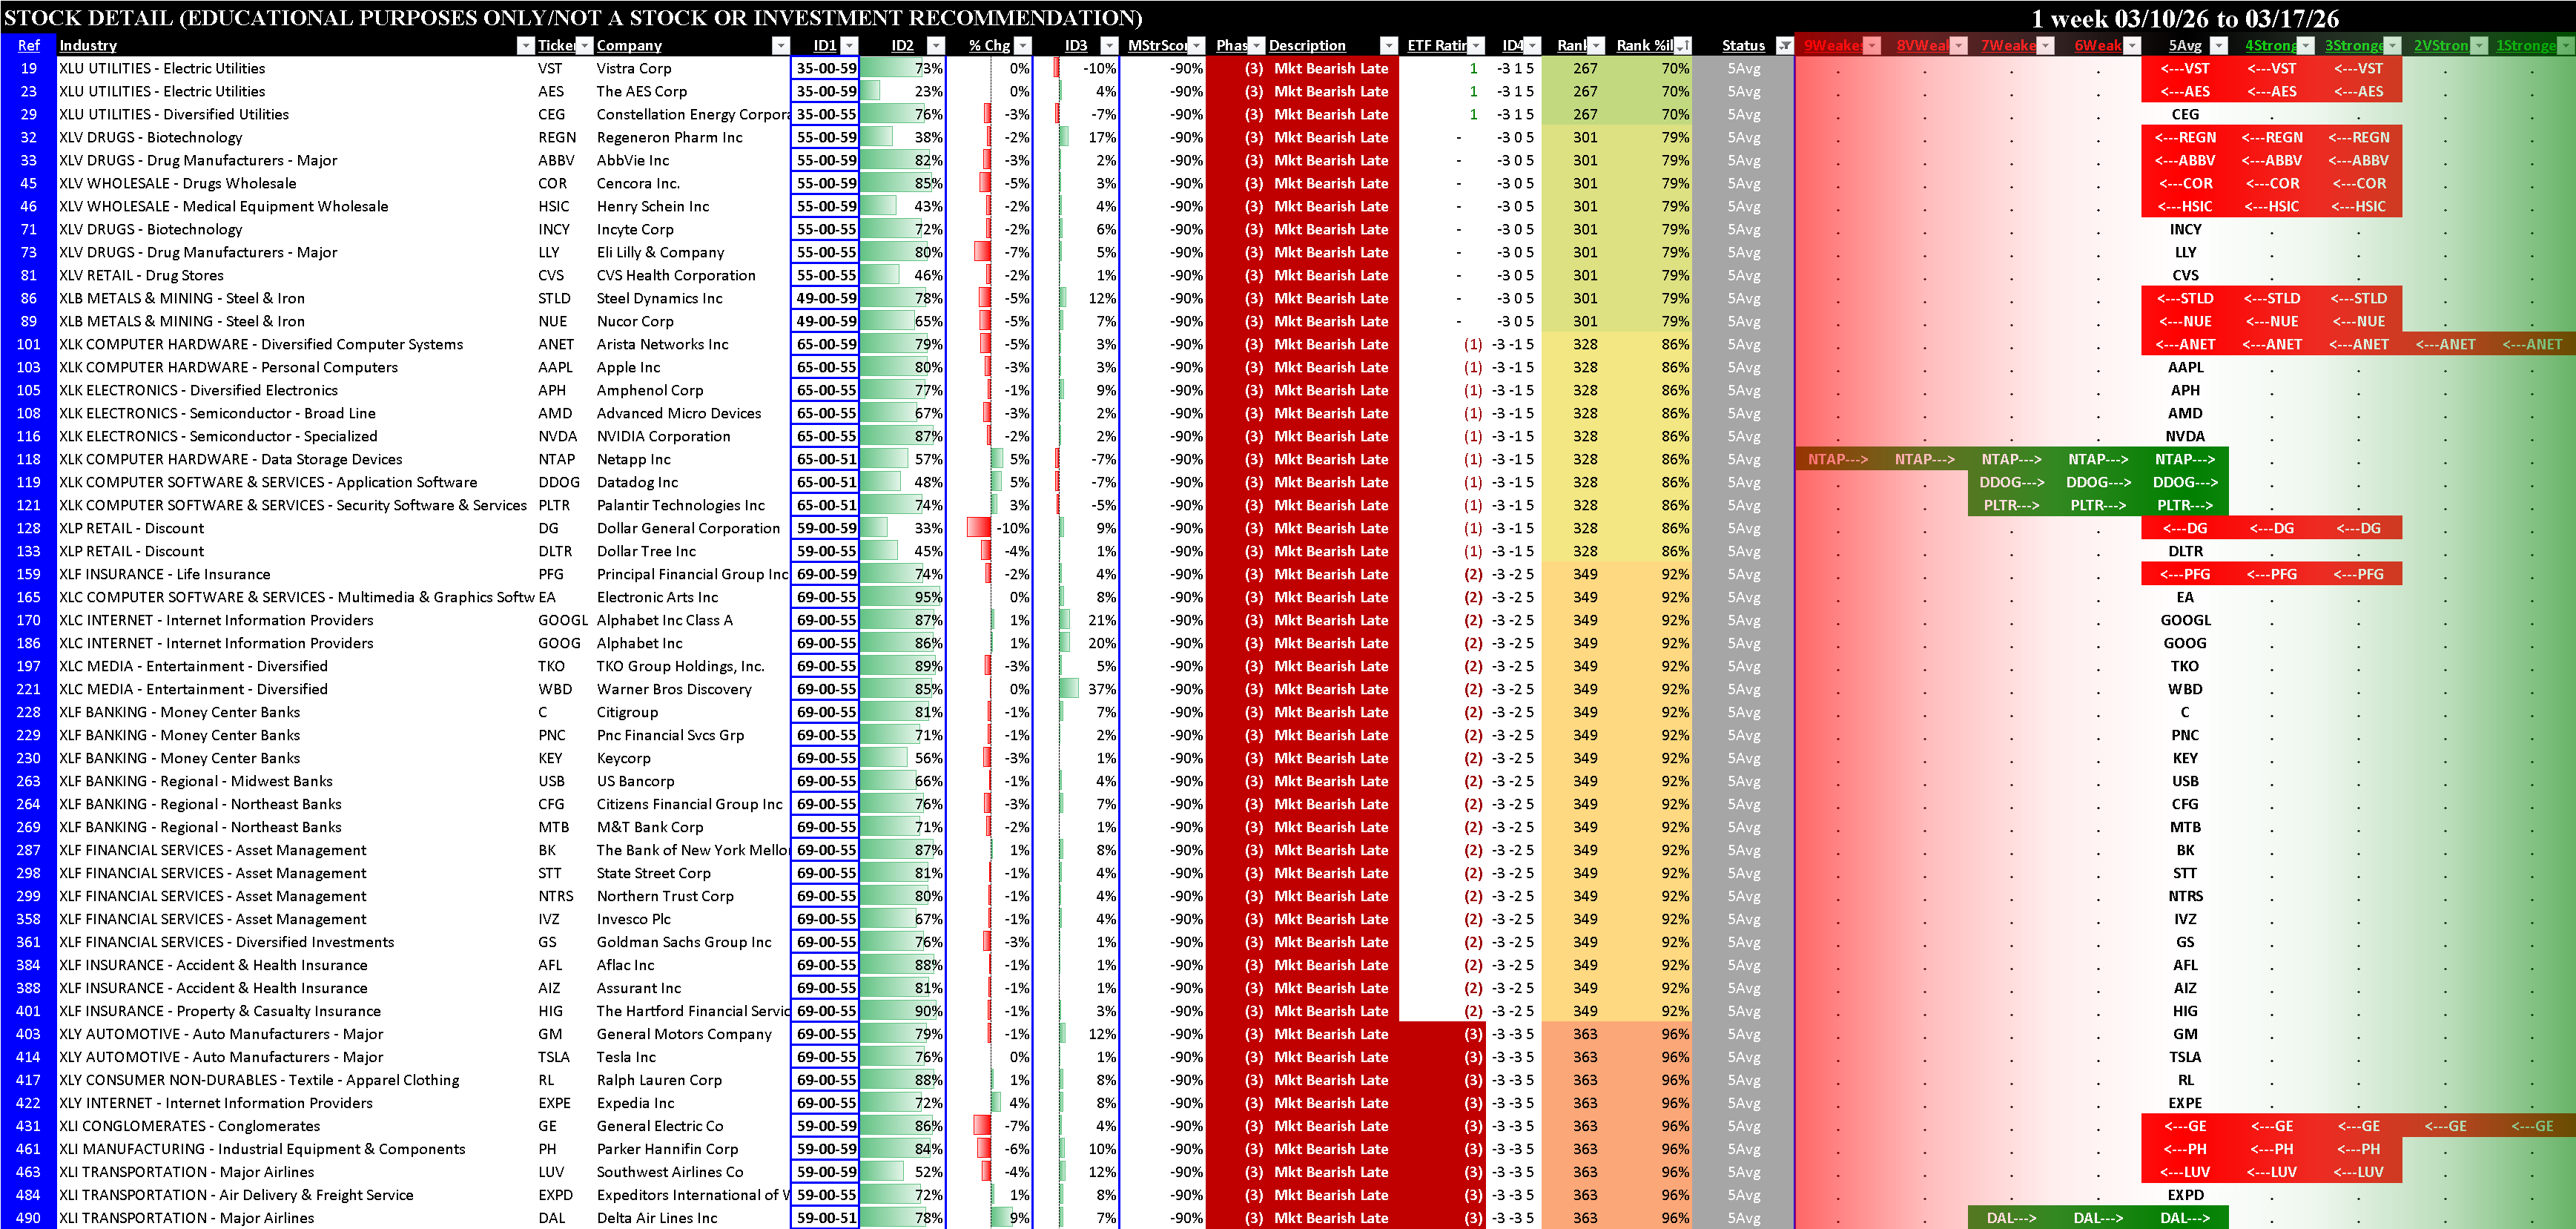
Sector ETFs Stocks Rated 1Strongest and 9Weakest
Long and short candidates are listed below, ranked based on market, sector, and stock strength characteristics. As a bonus, the bottom table shows 5Average stocks, for possible volatility-related strategies.