SMO Dashboard Tue 2026-03-03 (Market = Bearish Mid Phase)

TLDR:
This dashboard uncovers strength and weakness at the market, sector, industry, sub-industry, and stock levels to aid decision-making in the prevailing market environment.
Commentary
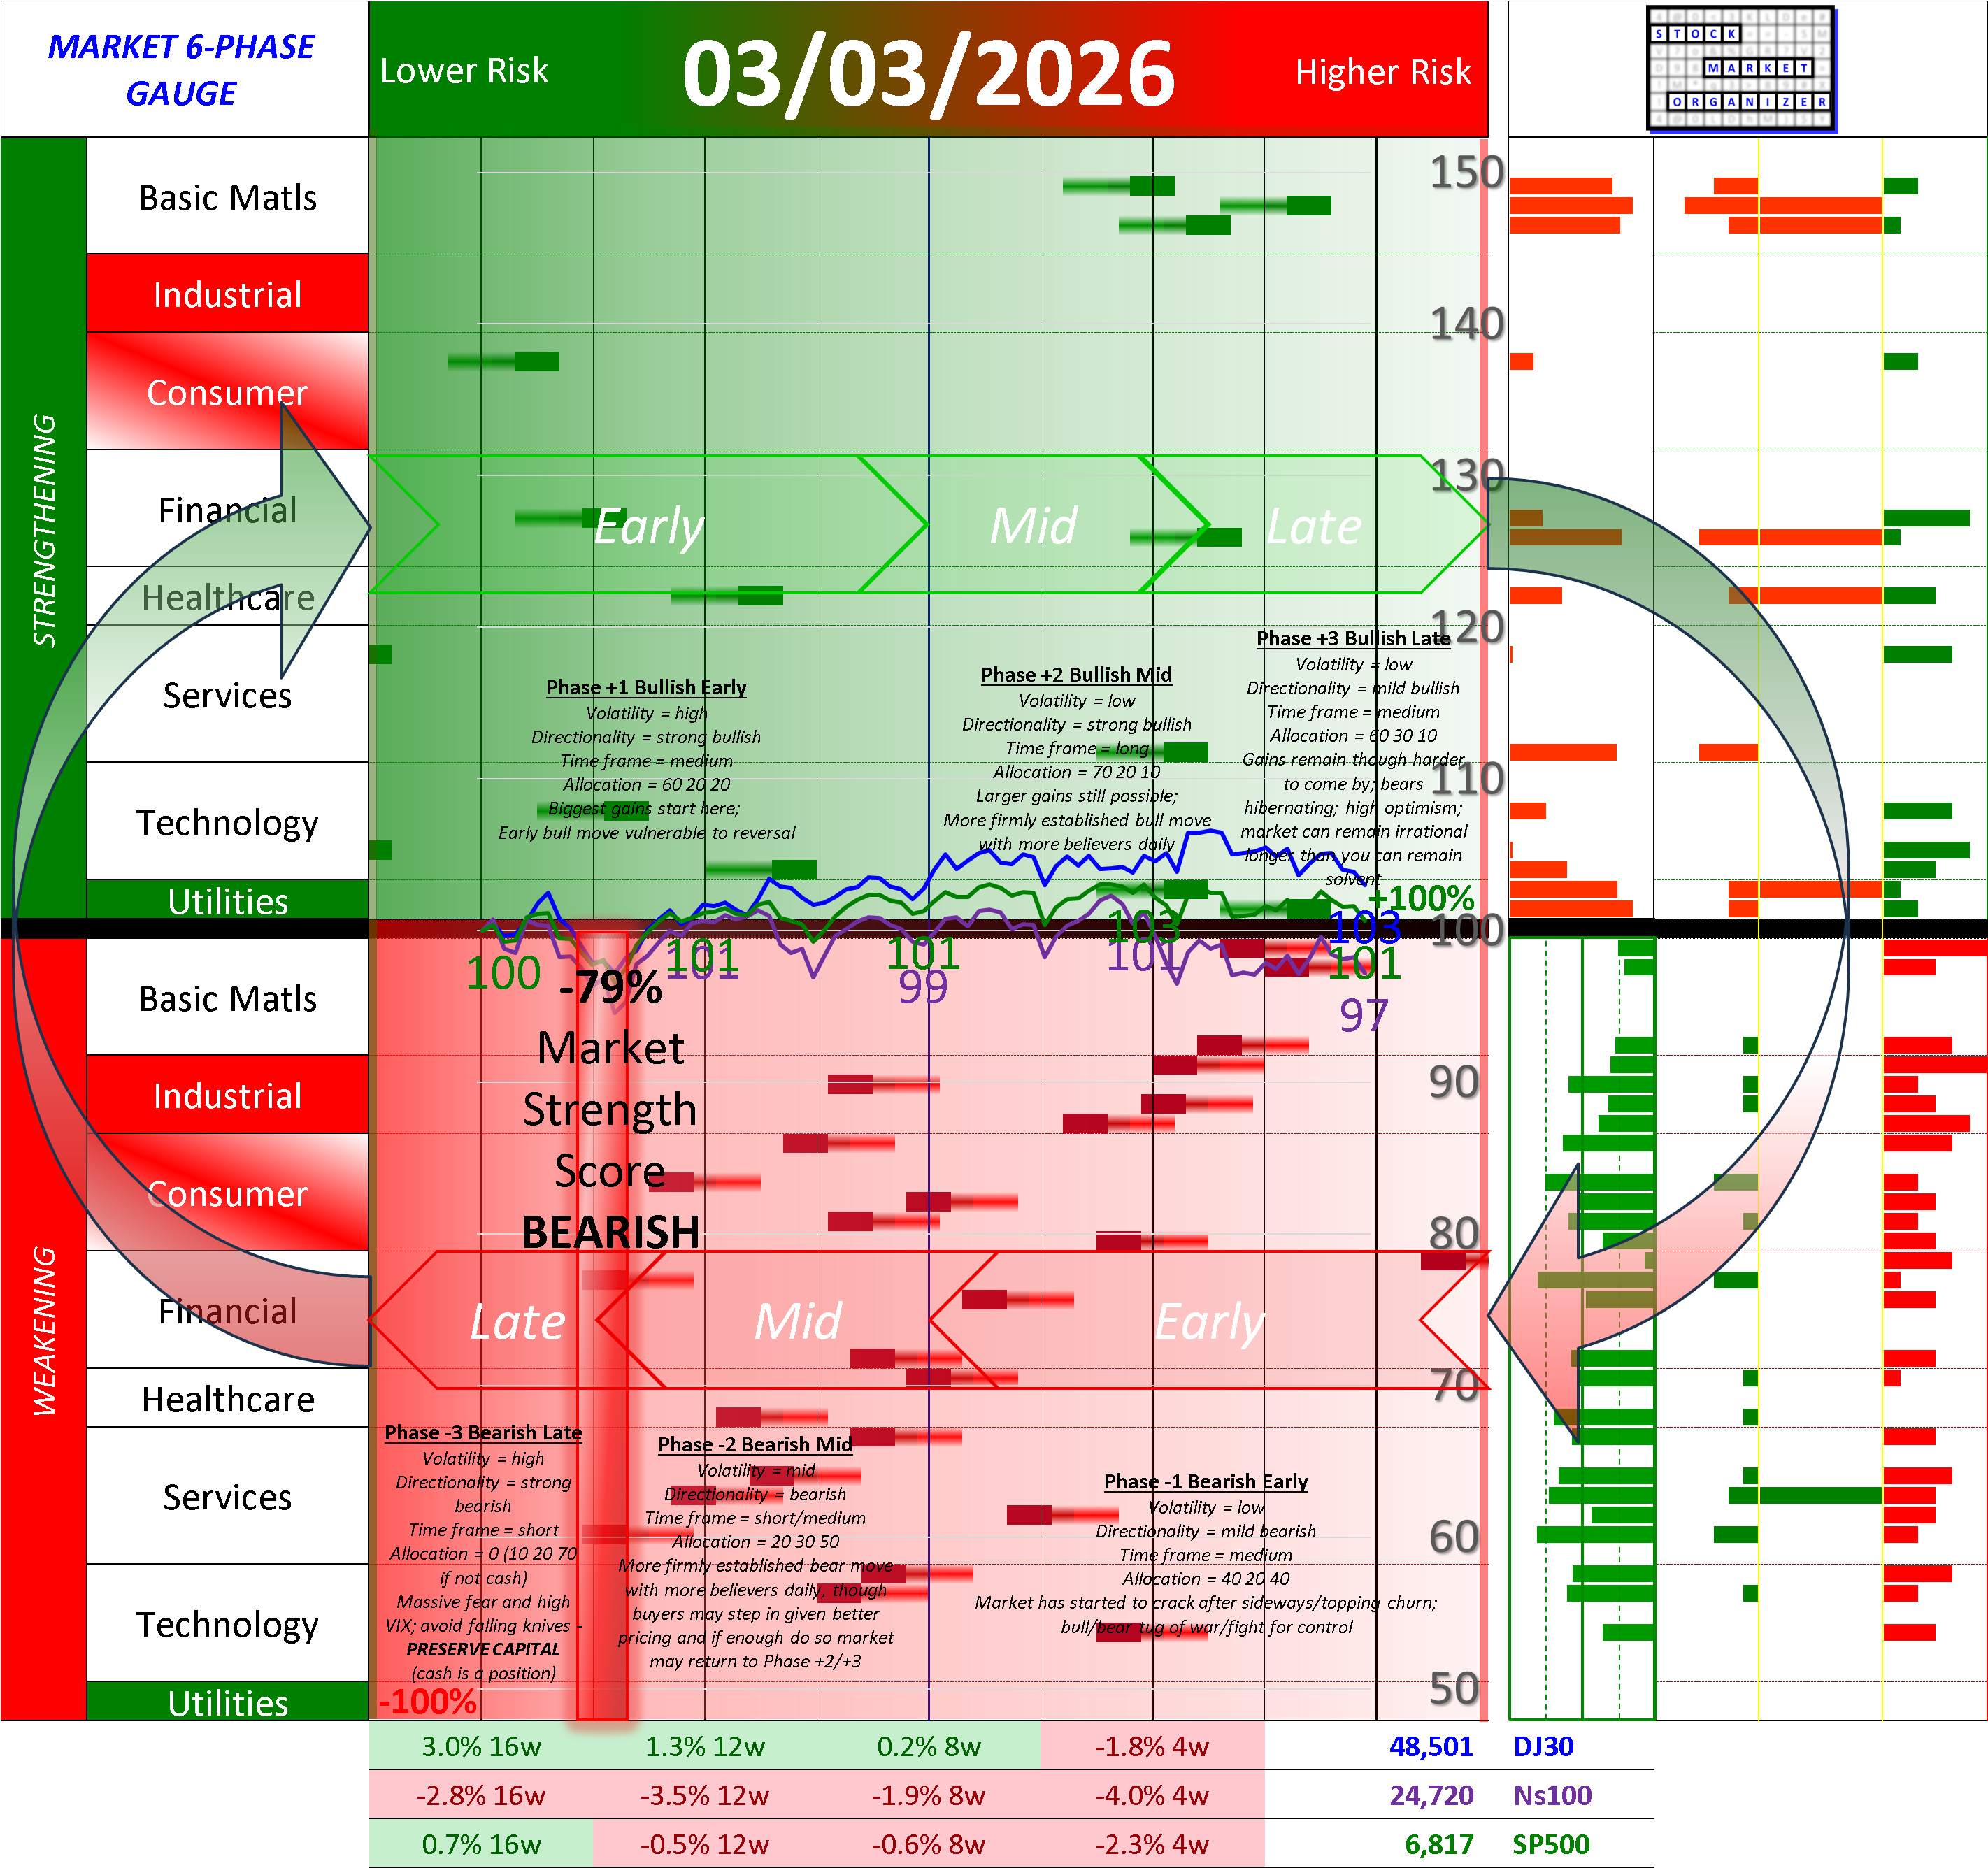
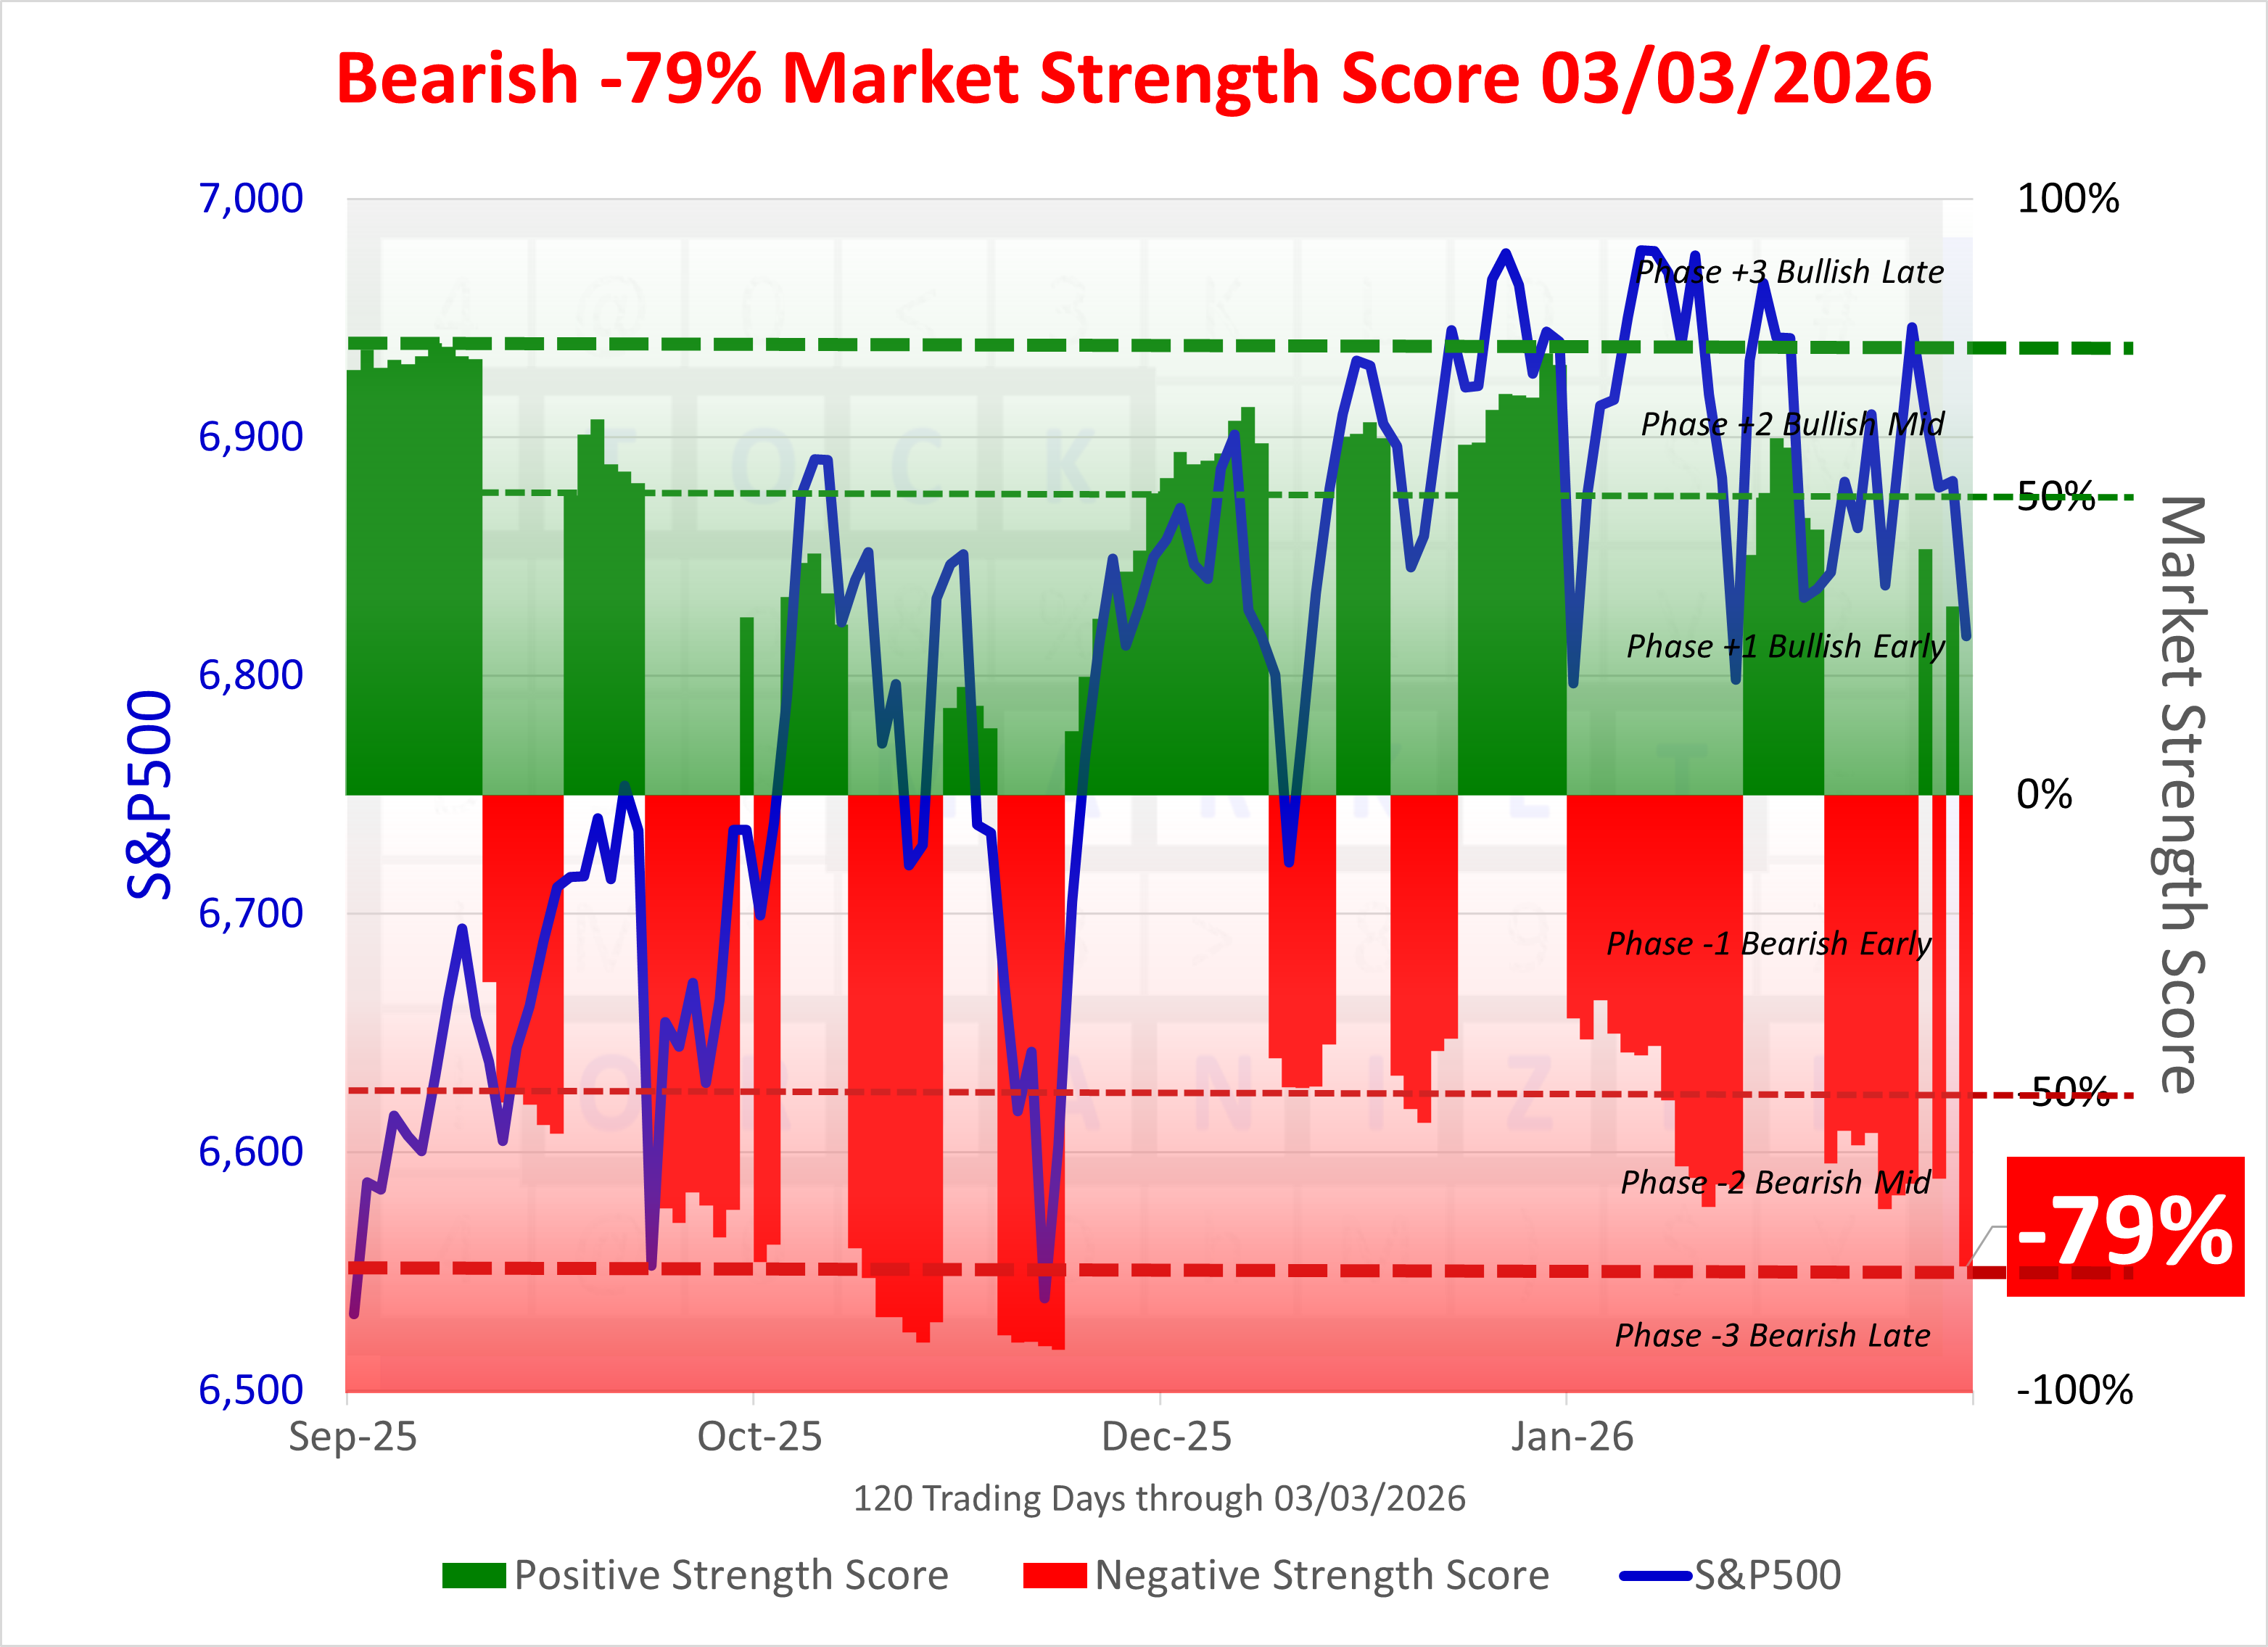
The Market Strength Score turned negative today. Be cautious.
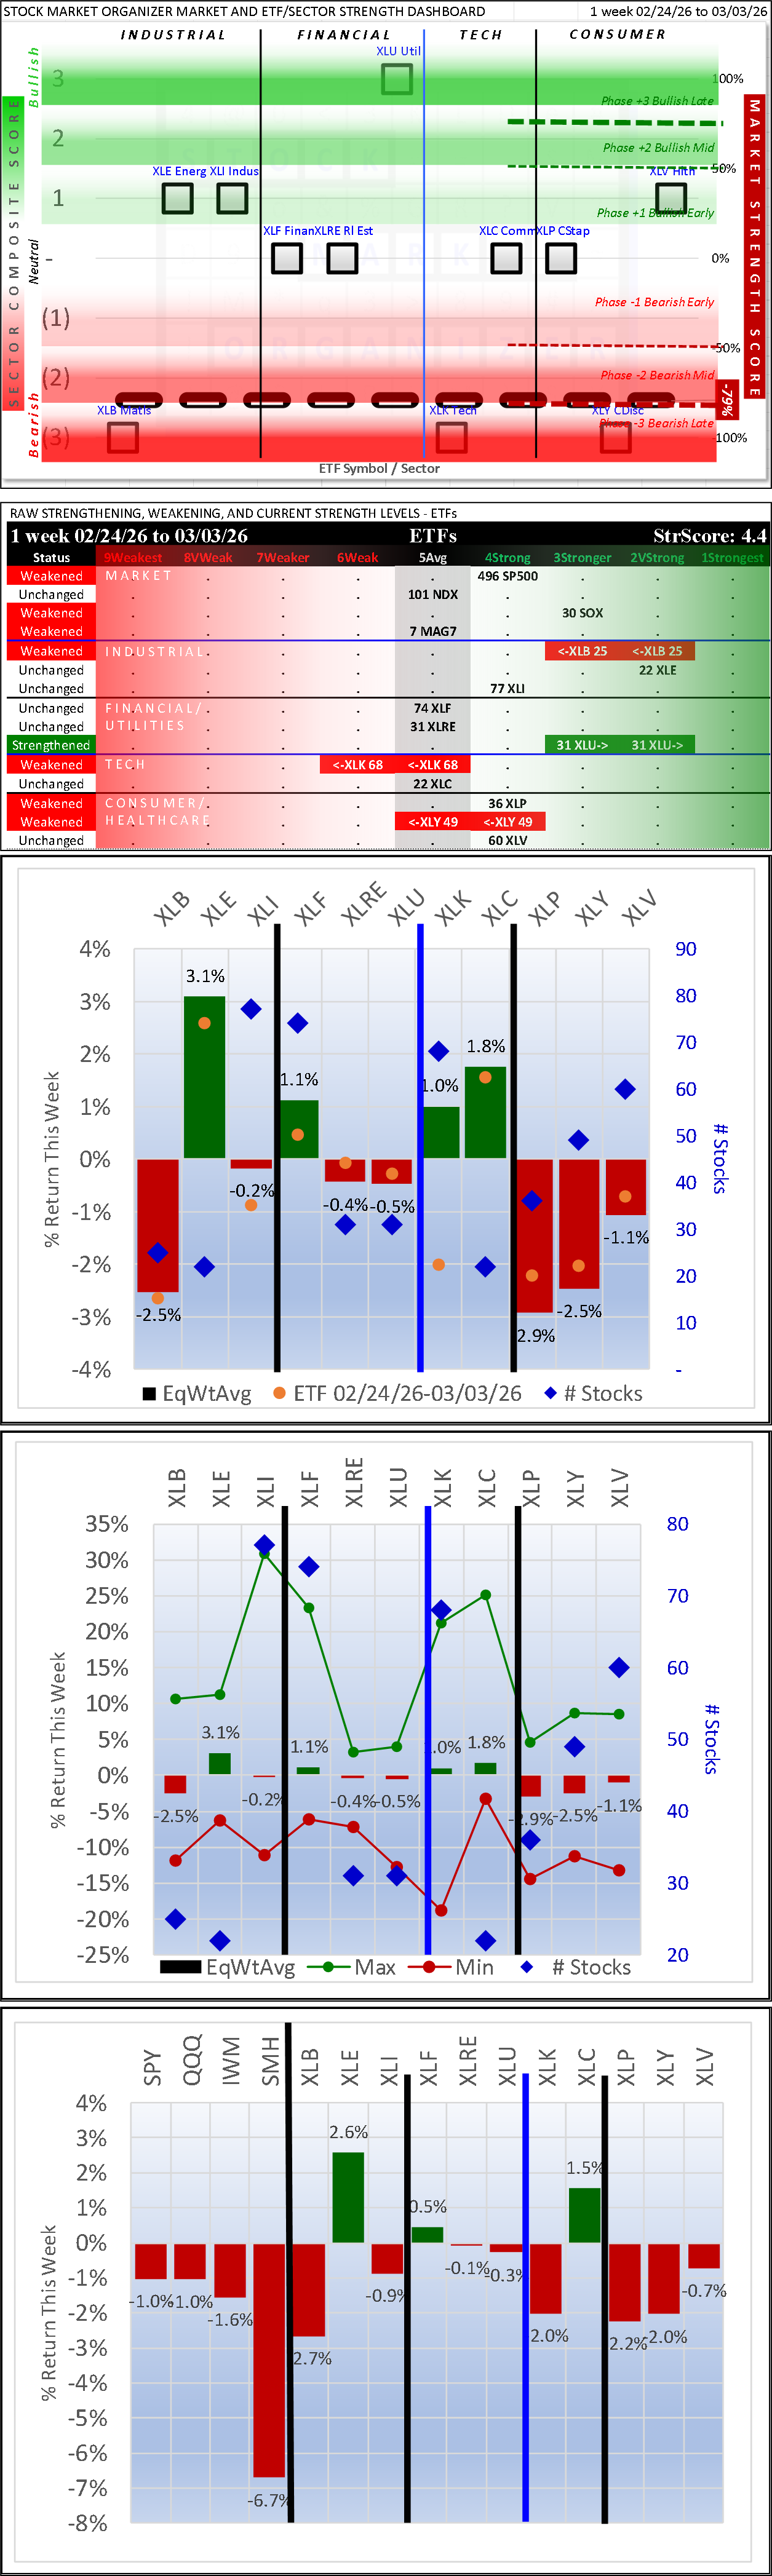
Tech is mixed. Financials have taken a turn for the worse. Utilities remain strong. Materials are mixed.
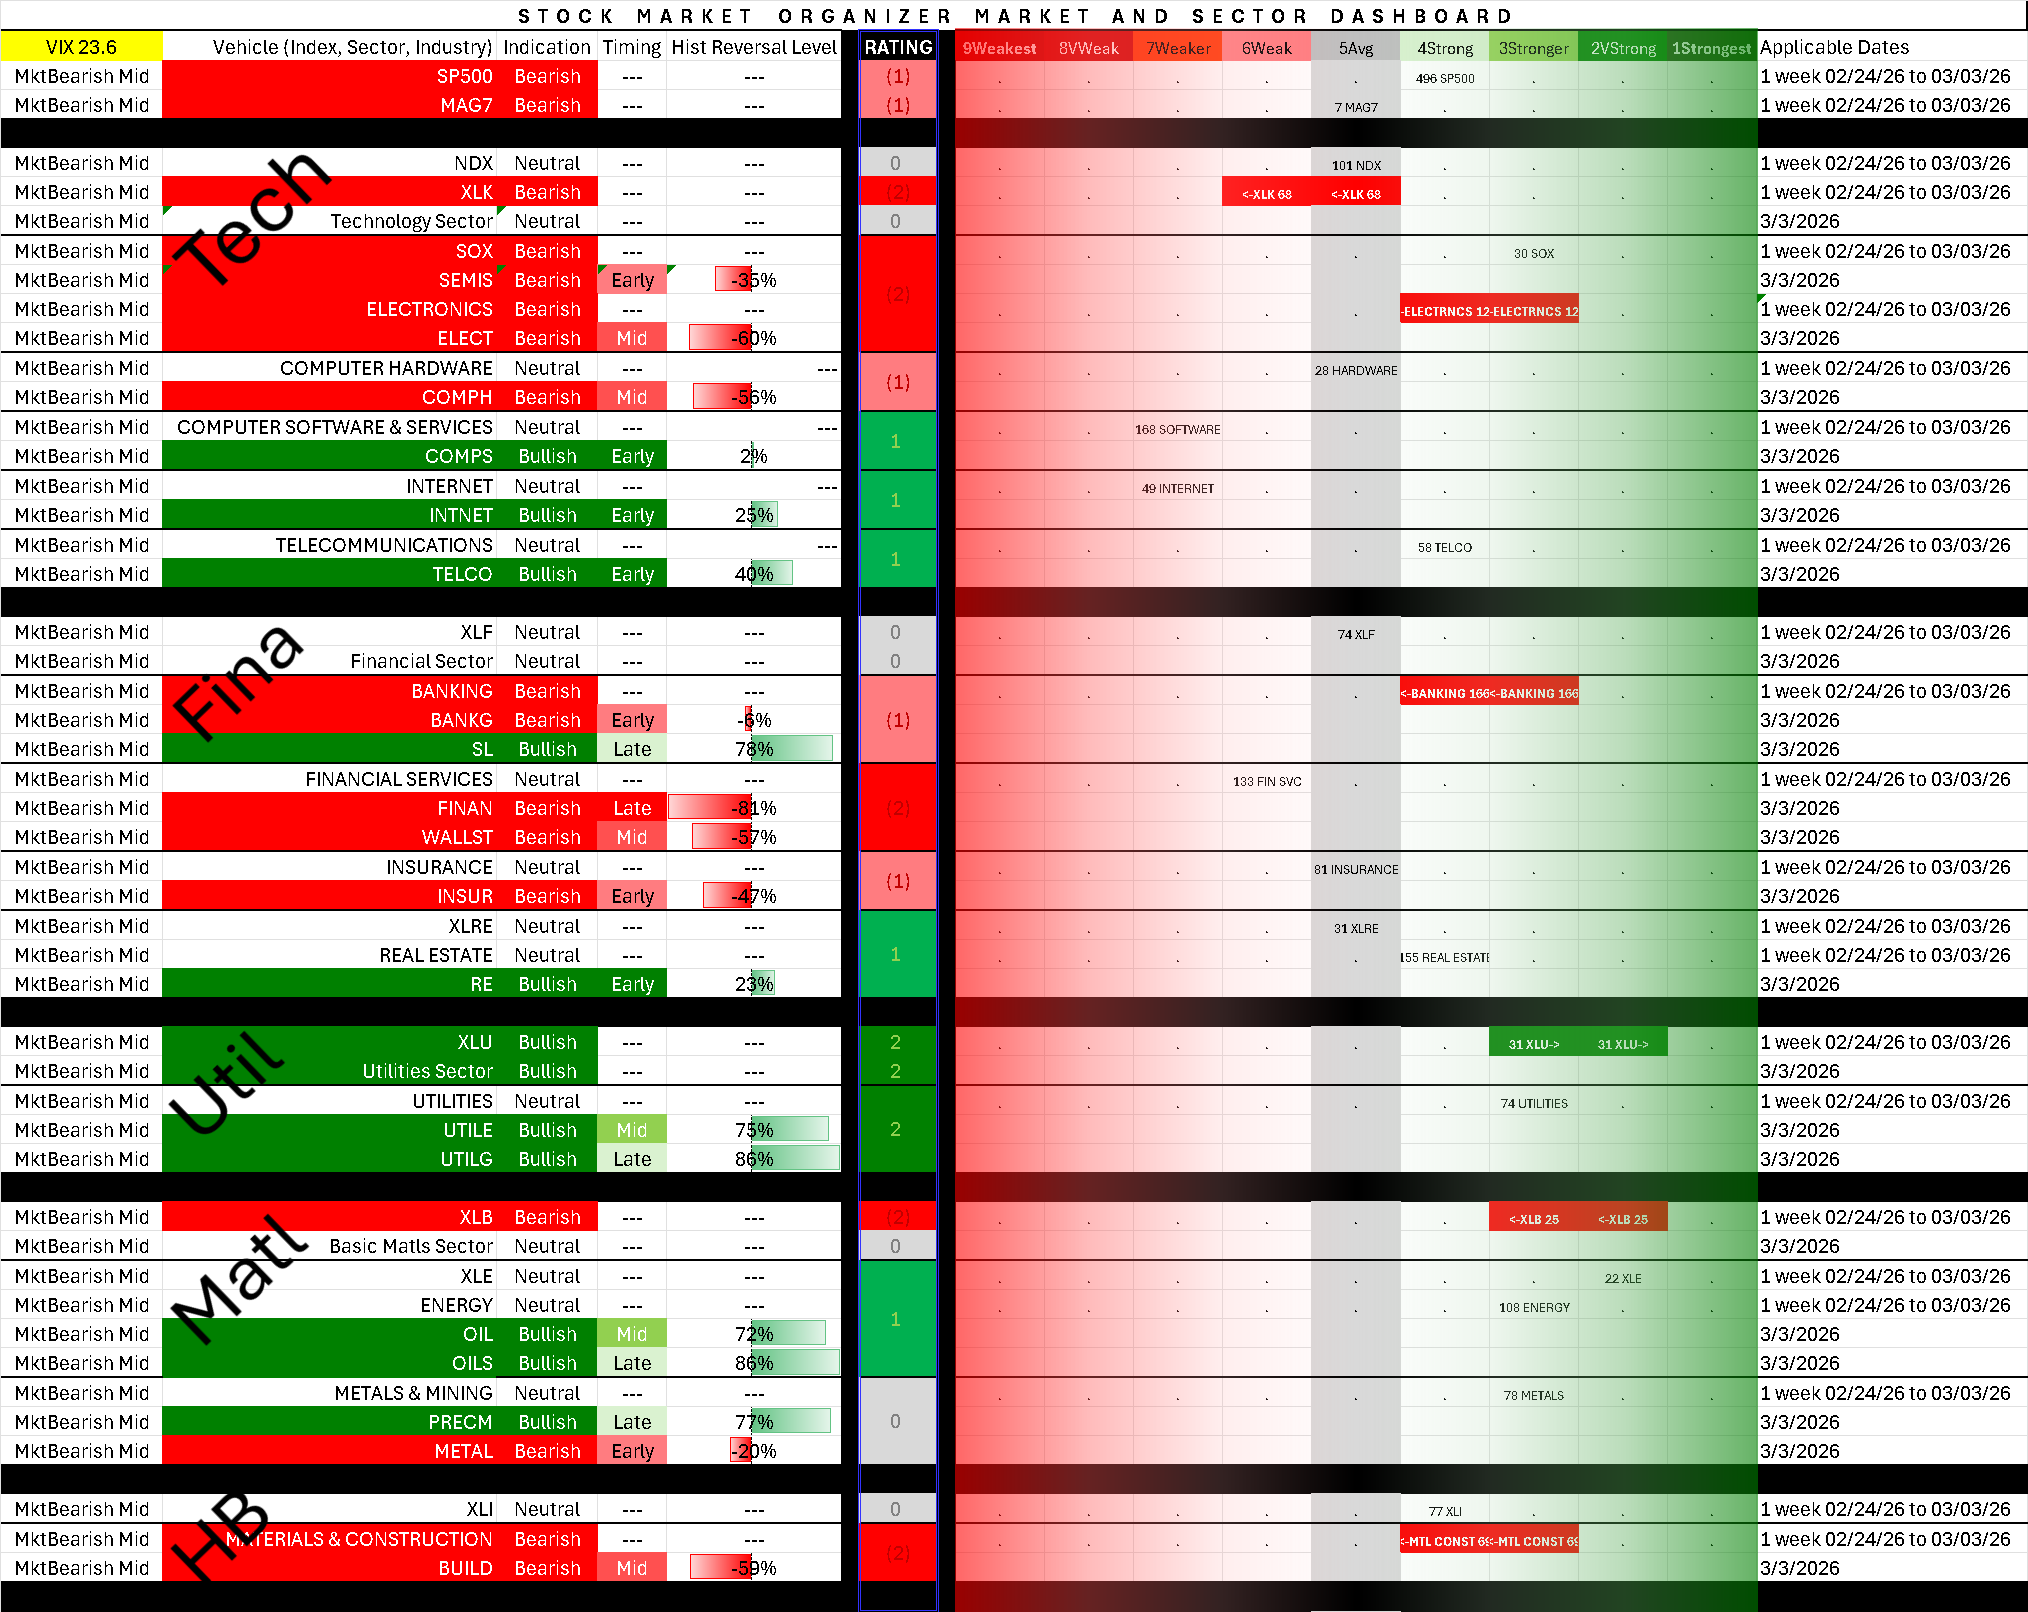
The column labeled "Rating" reflects the strength (based on this system's criteria) of the individual vehicle (index, sector, or industry).
Market Strength Score
Changed to negative after today's action, currently -79% which is mid-level (right on the verge of late) Bearish. This has flipped for the past four days, which is extremely unusual.
SPDR Sector ETFs Detail
XLU Utilities led this week while XLB Materials, XLK Technology, and XLY Consumer Discretionary lagged.
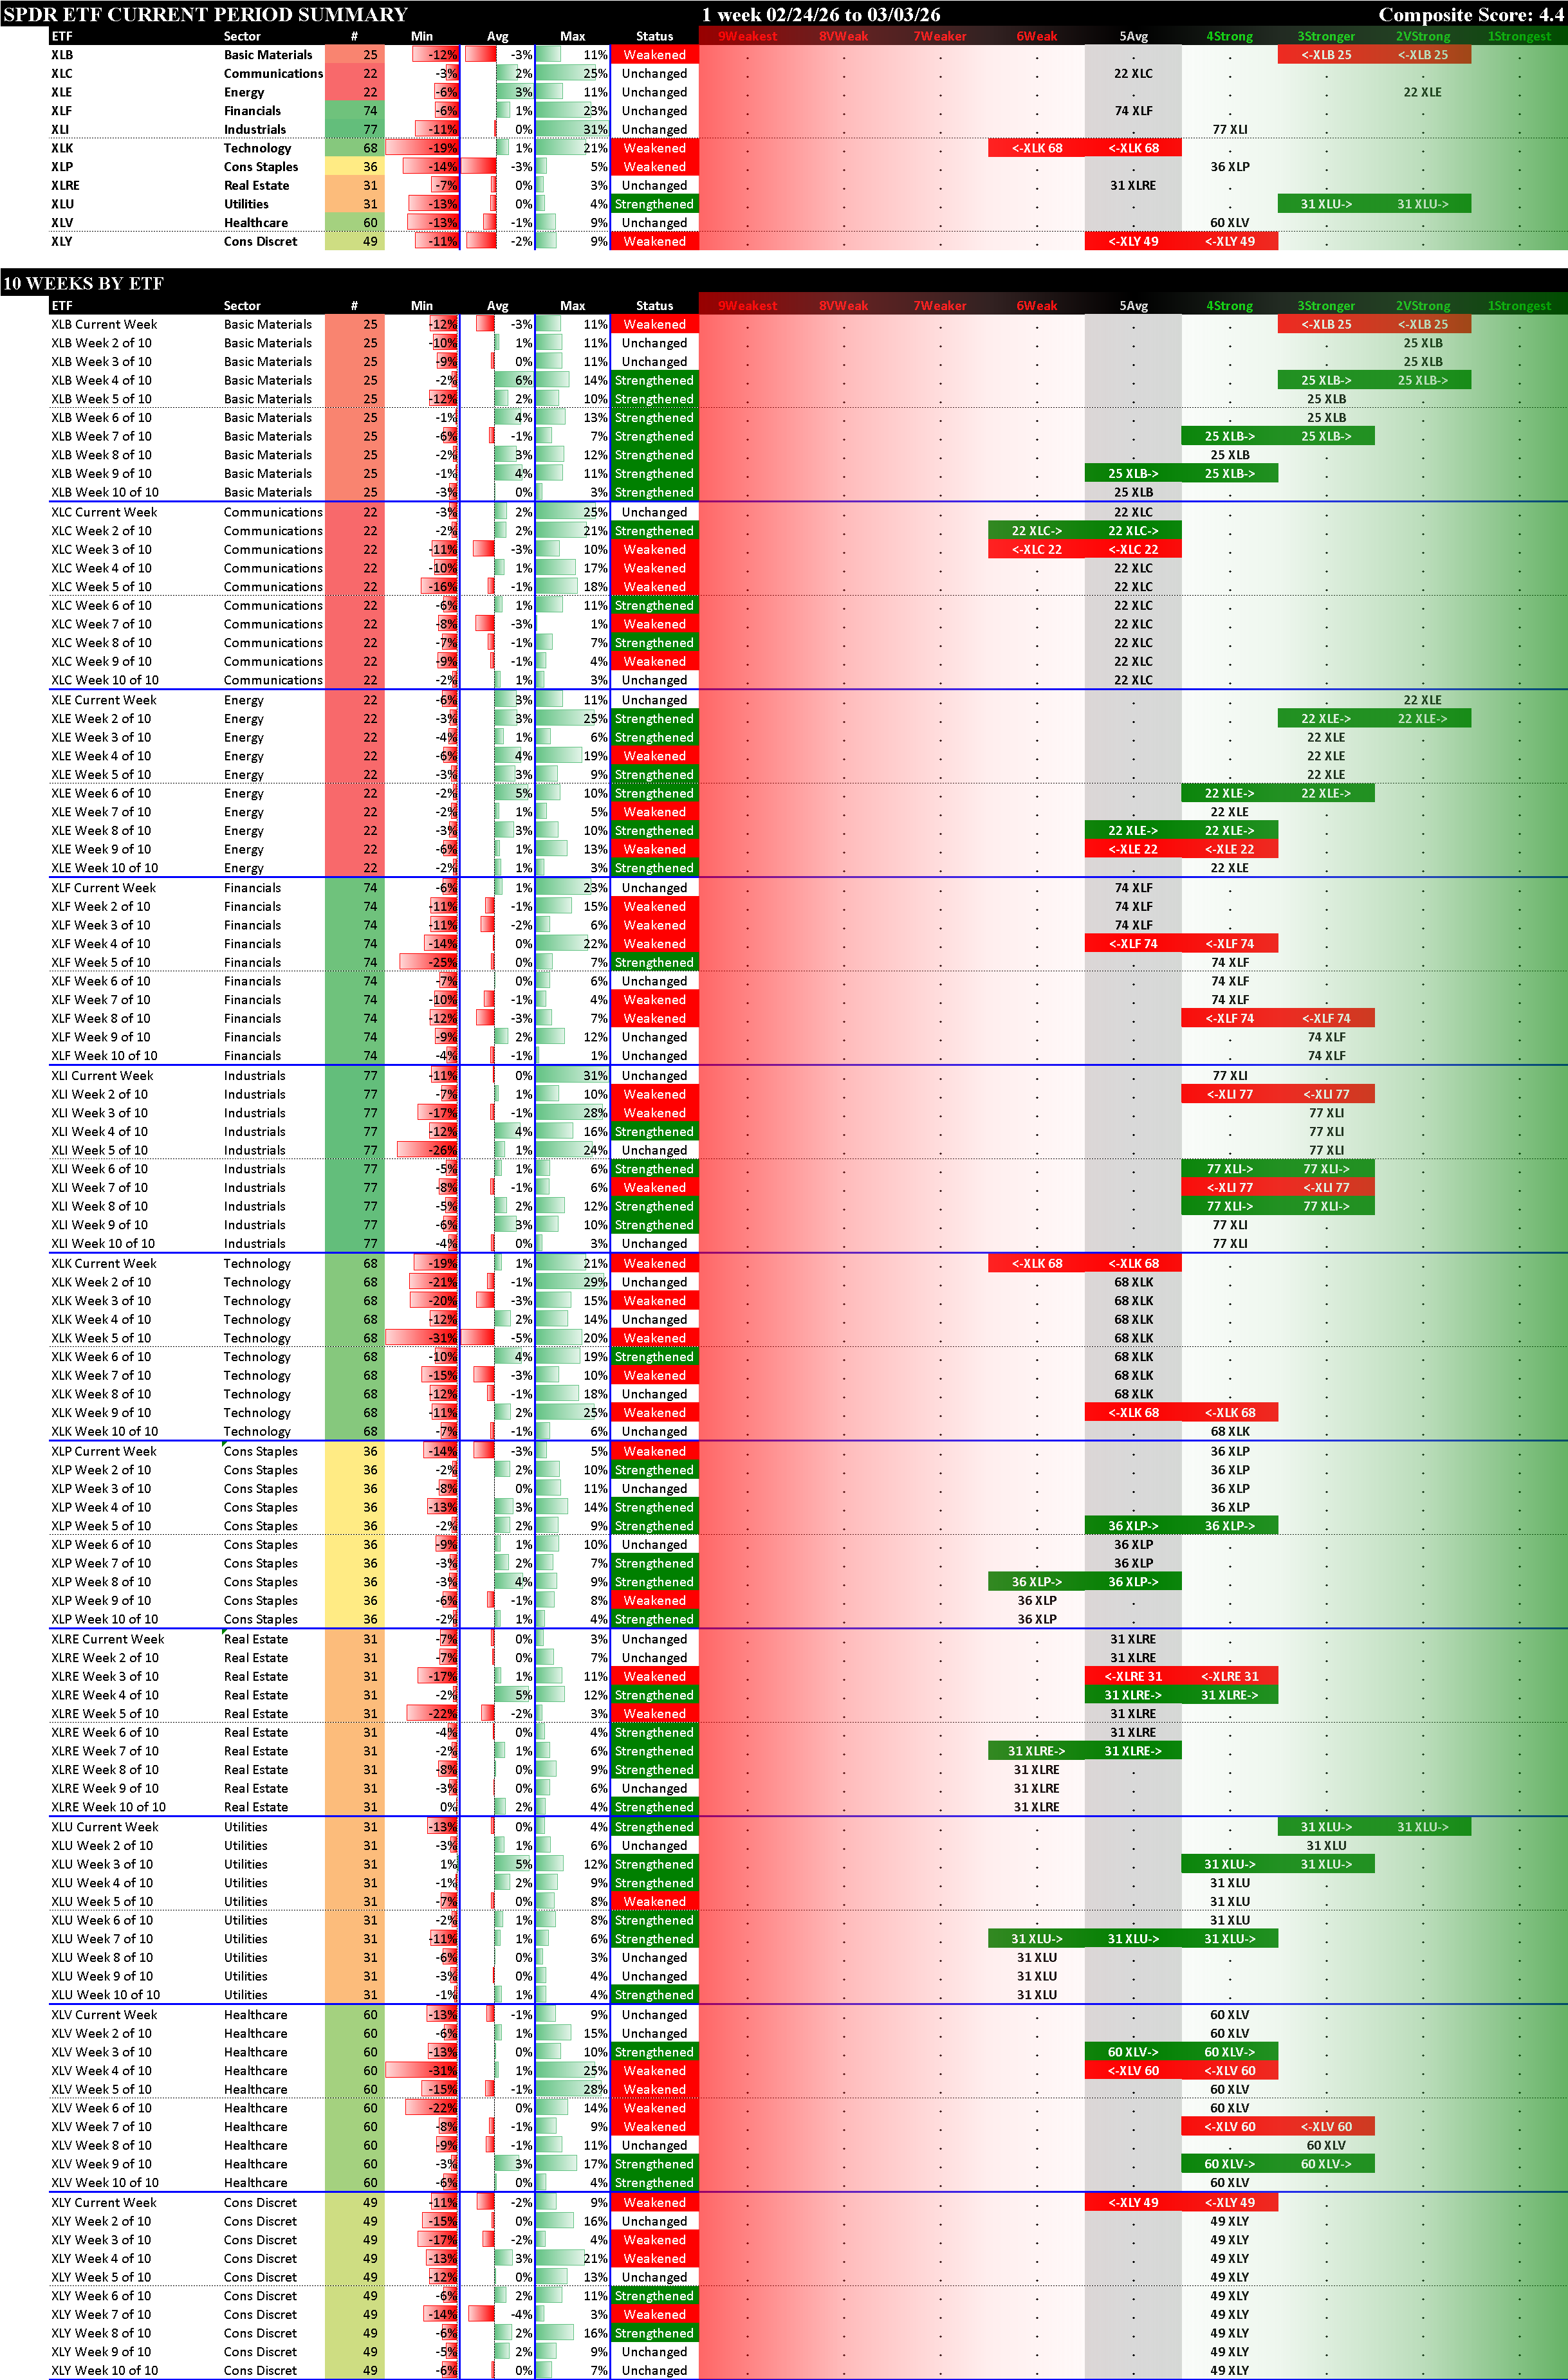
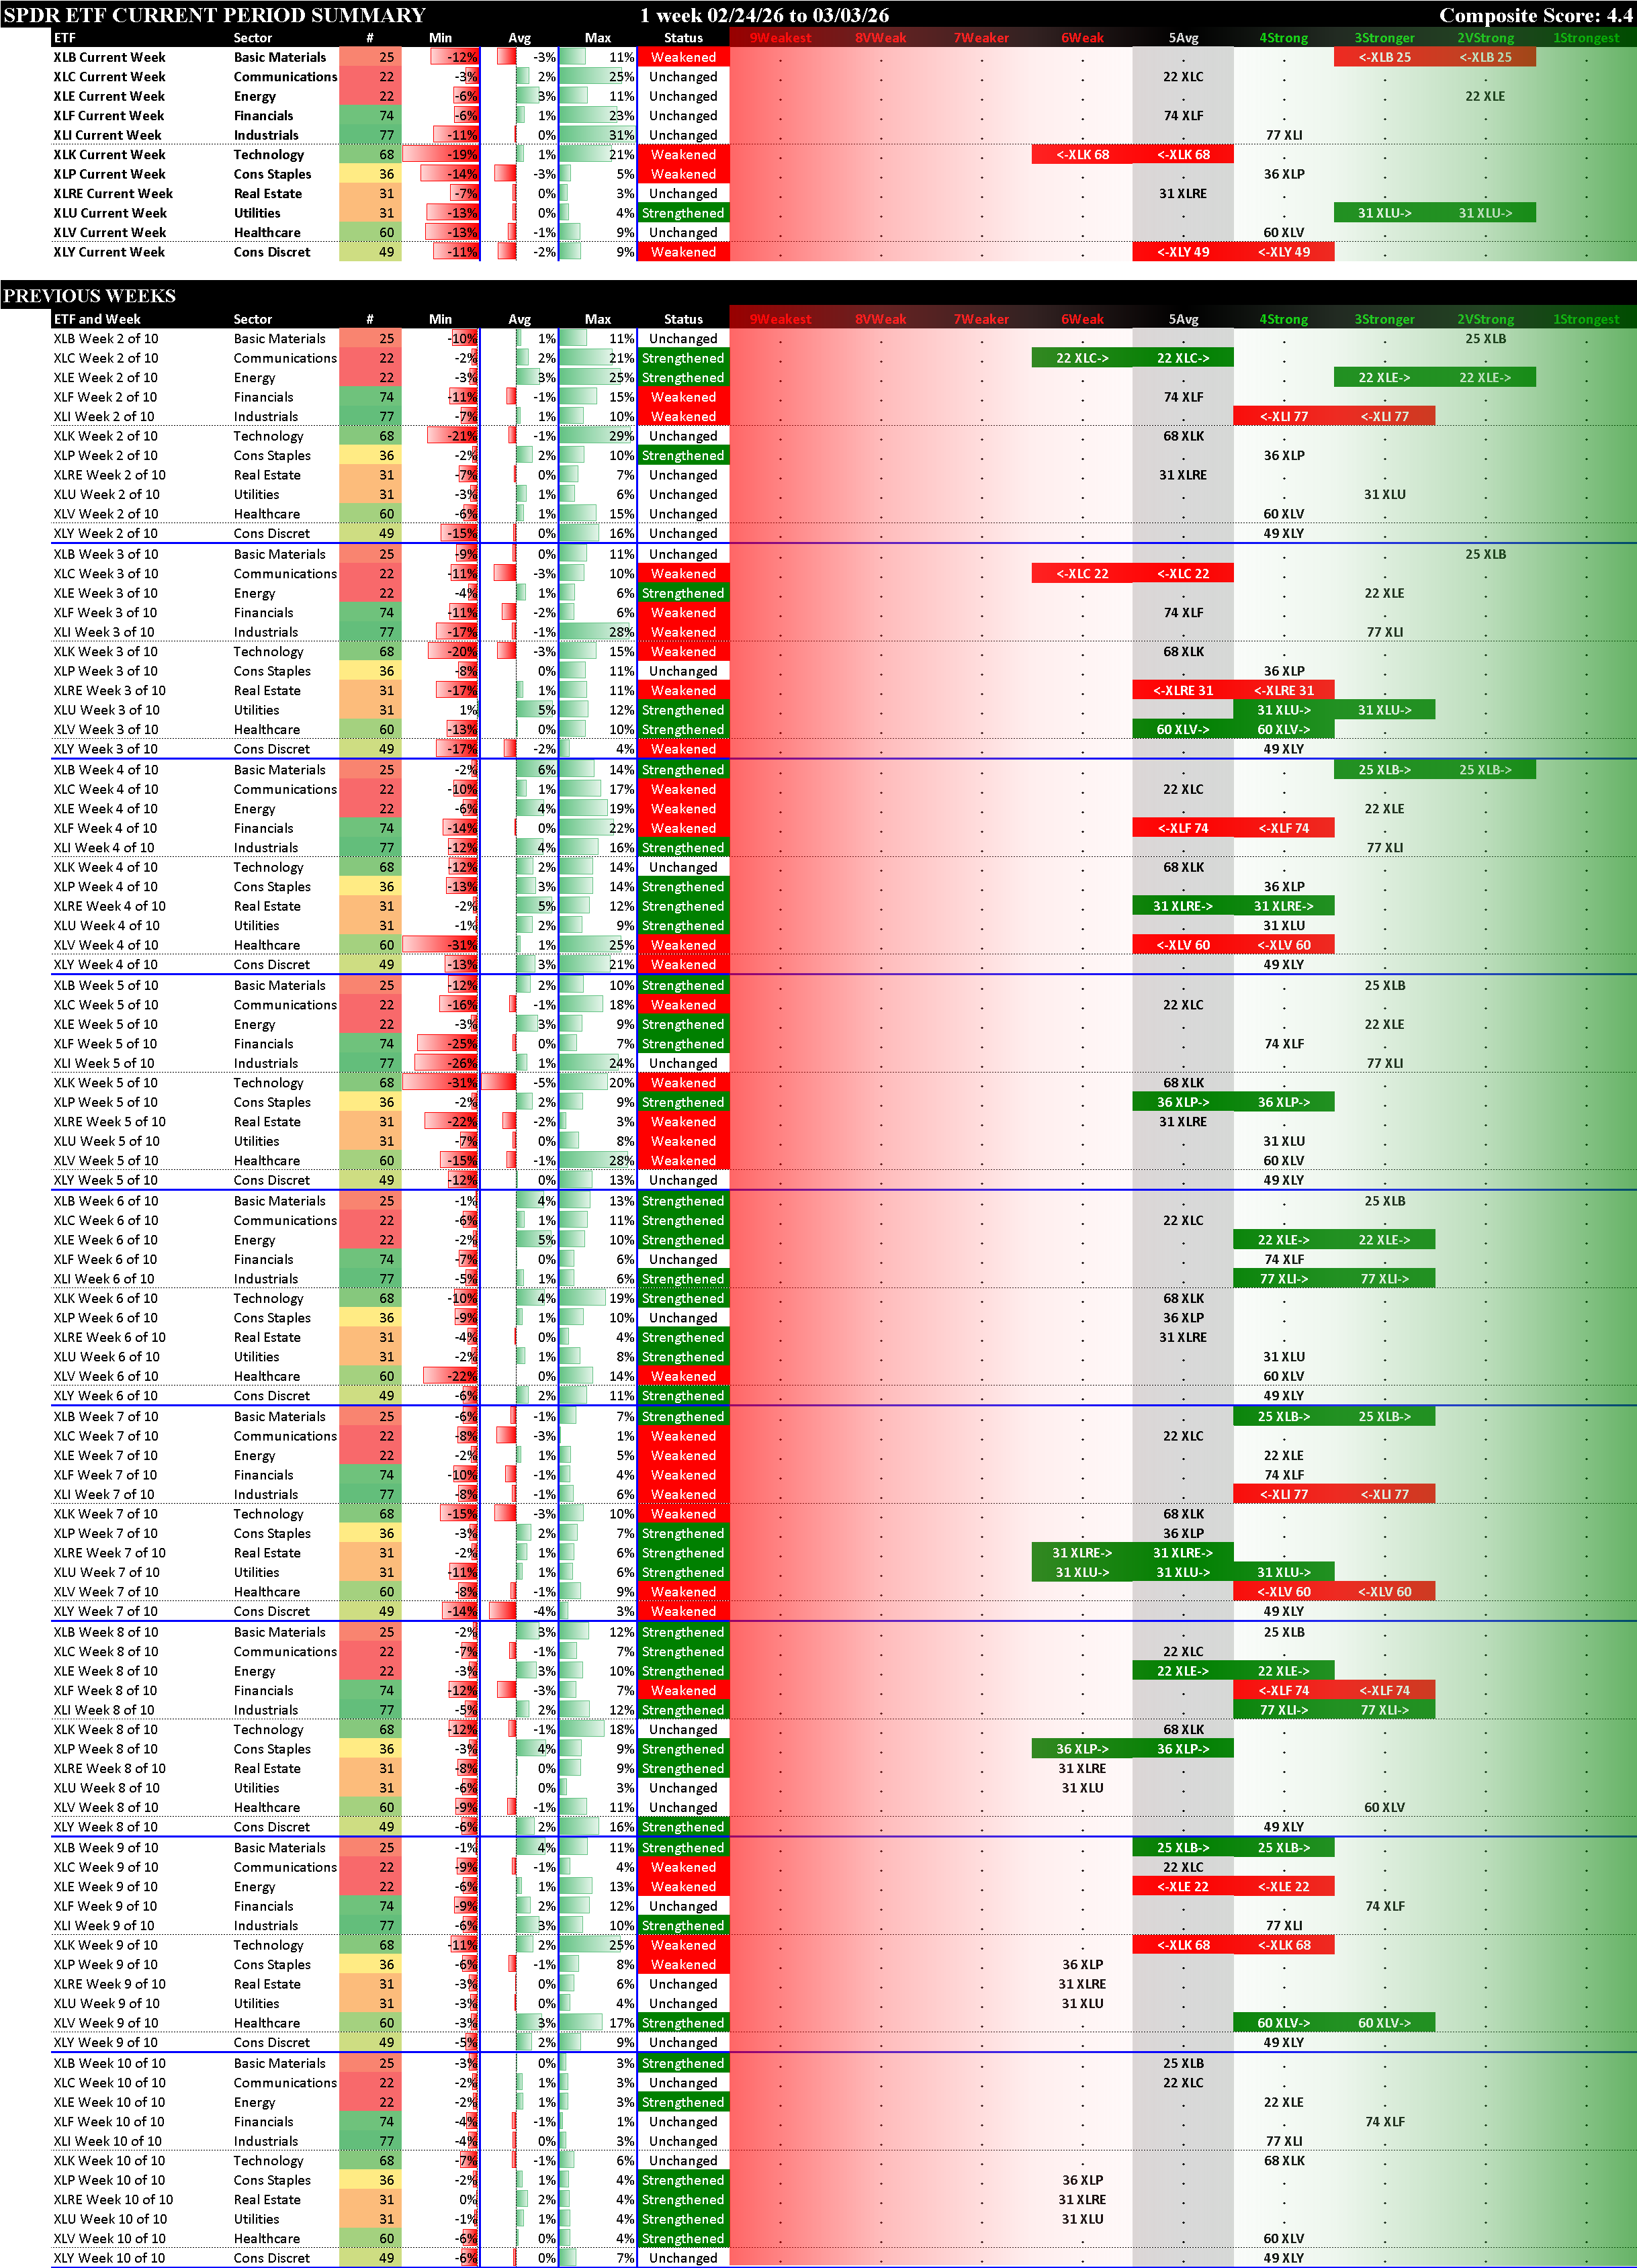
Context - 10 Week Lookbacks, by ETF and by Week
XLU Utilities strengthened and now lead with XLE Energy at 2VeryStrong. XLB Materials fell to 3Stronger. XLK Technology weakened to 6Weak and is the weakest of the sectors.
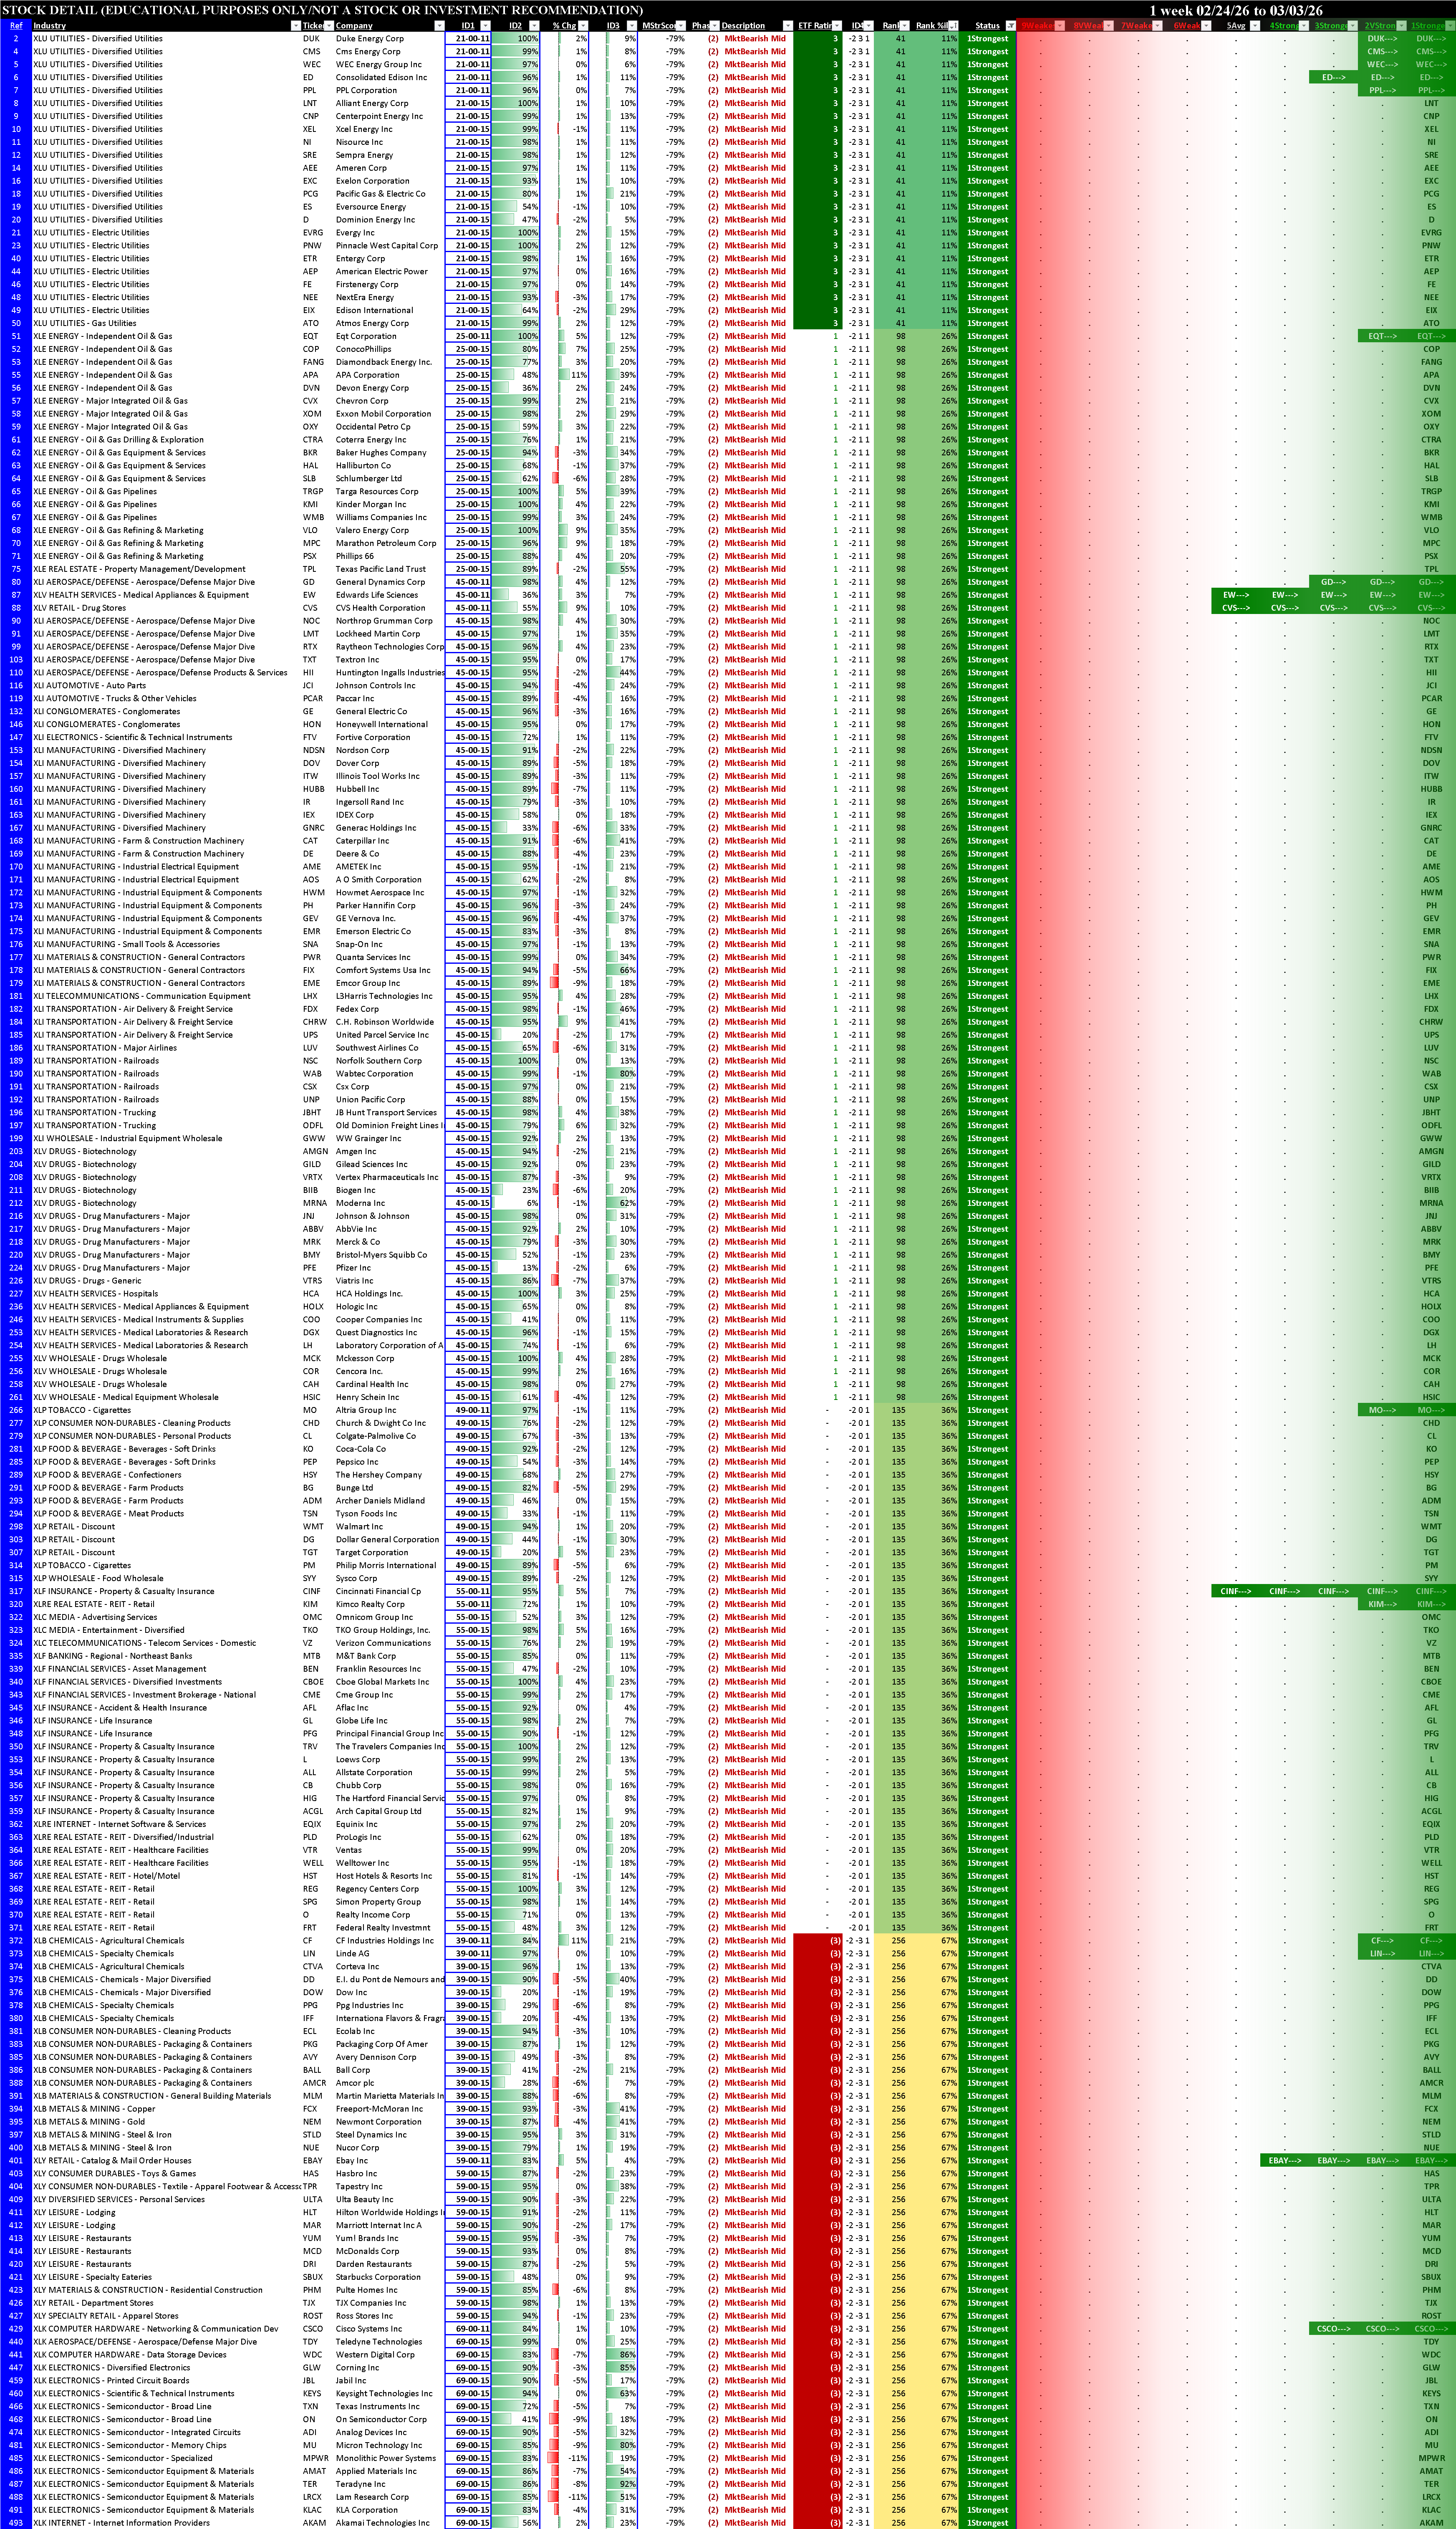
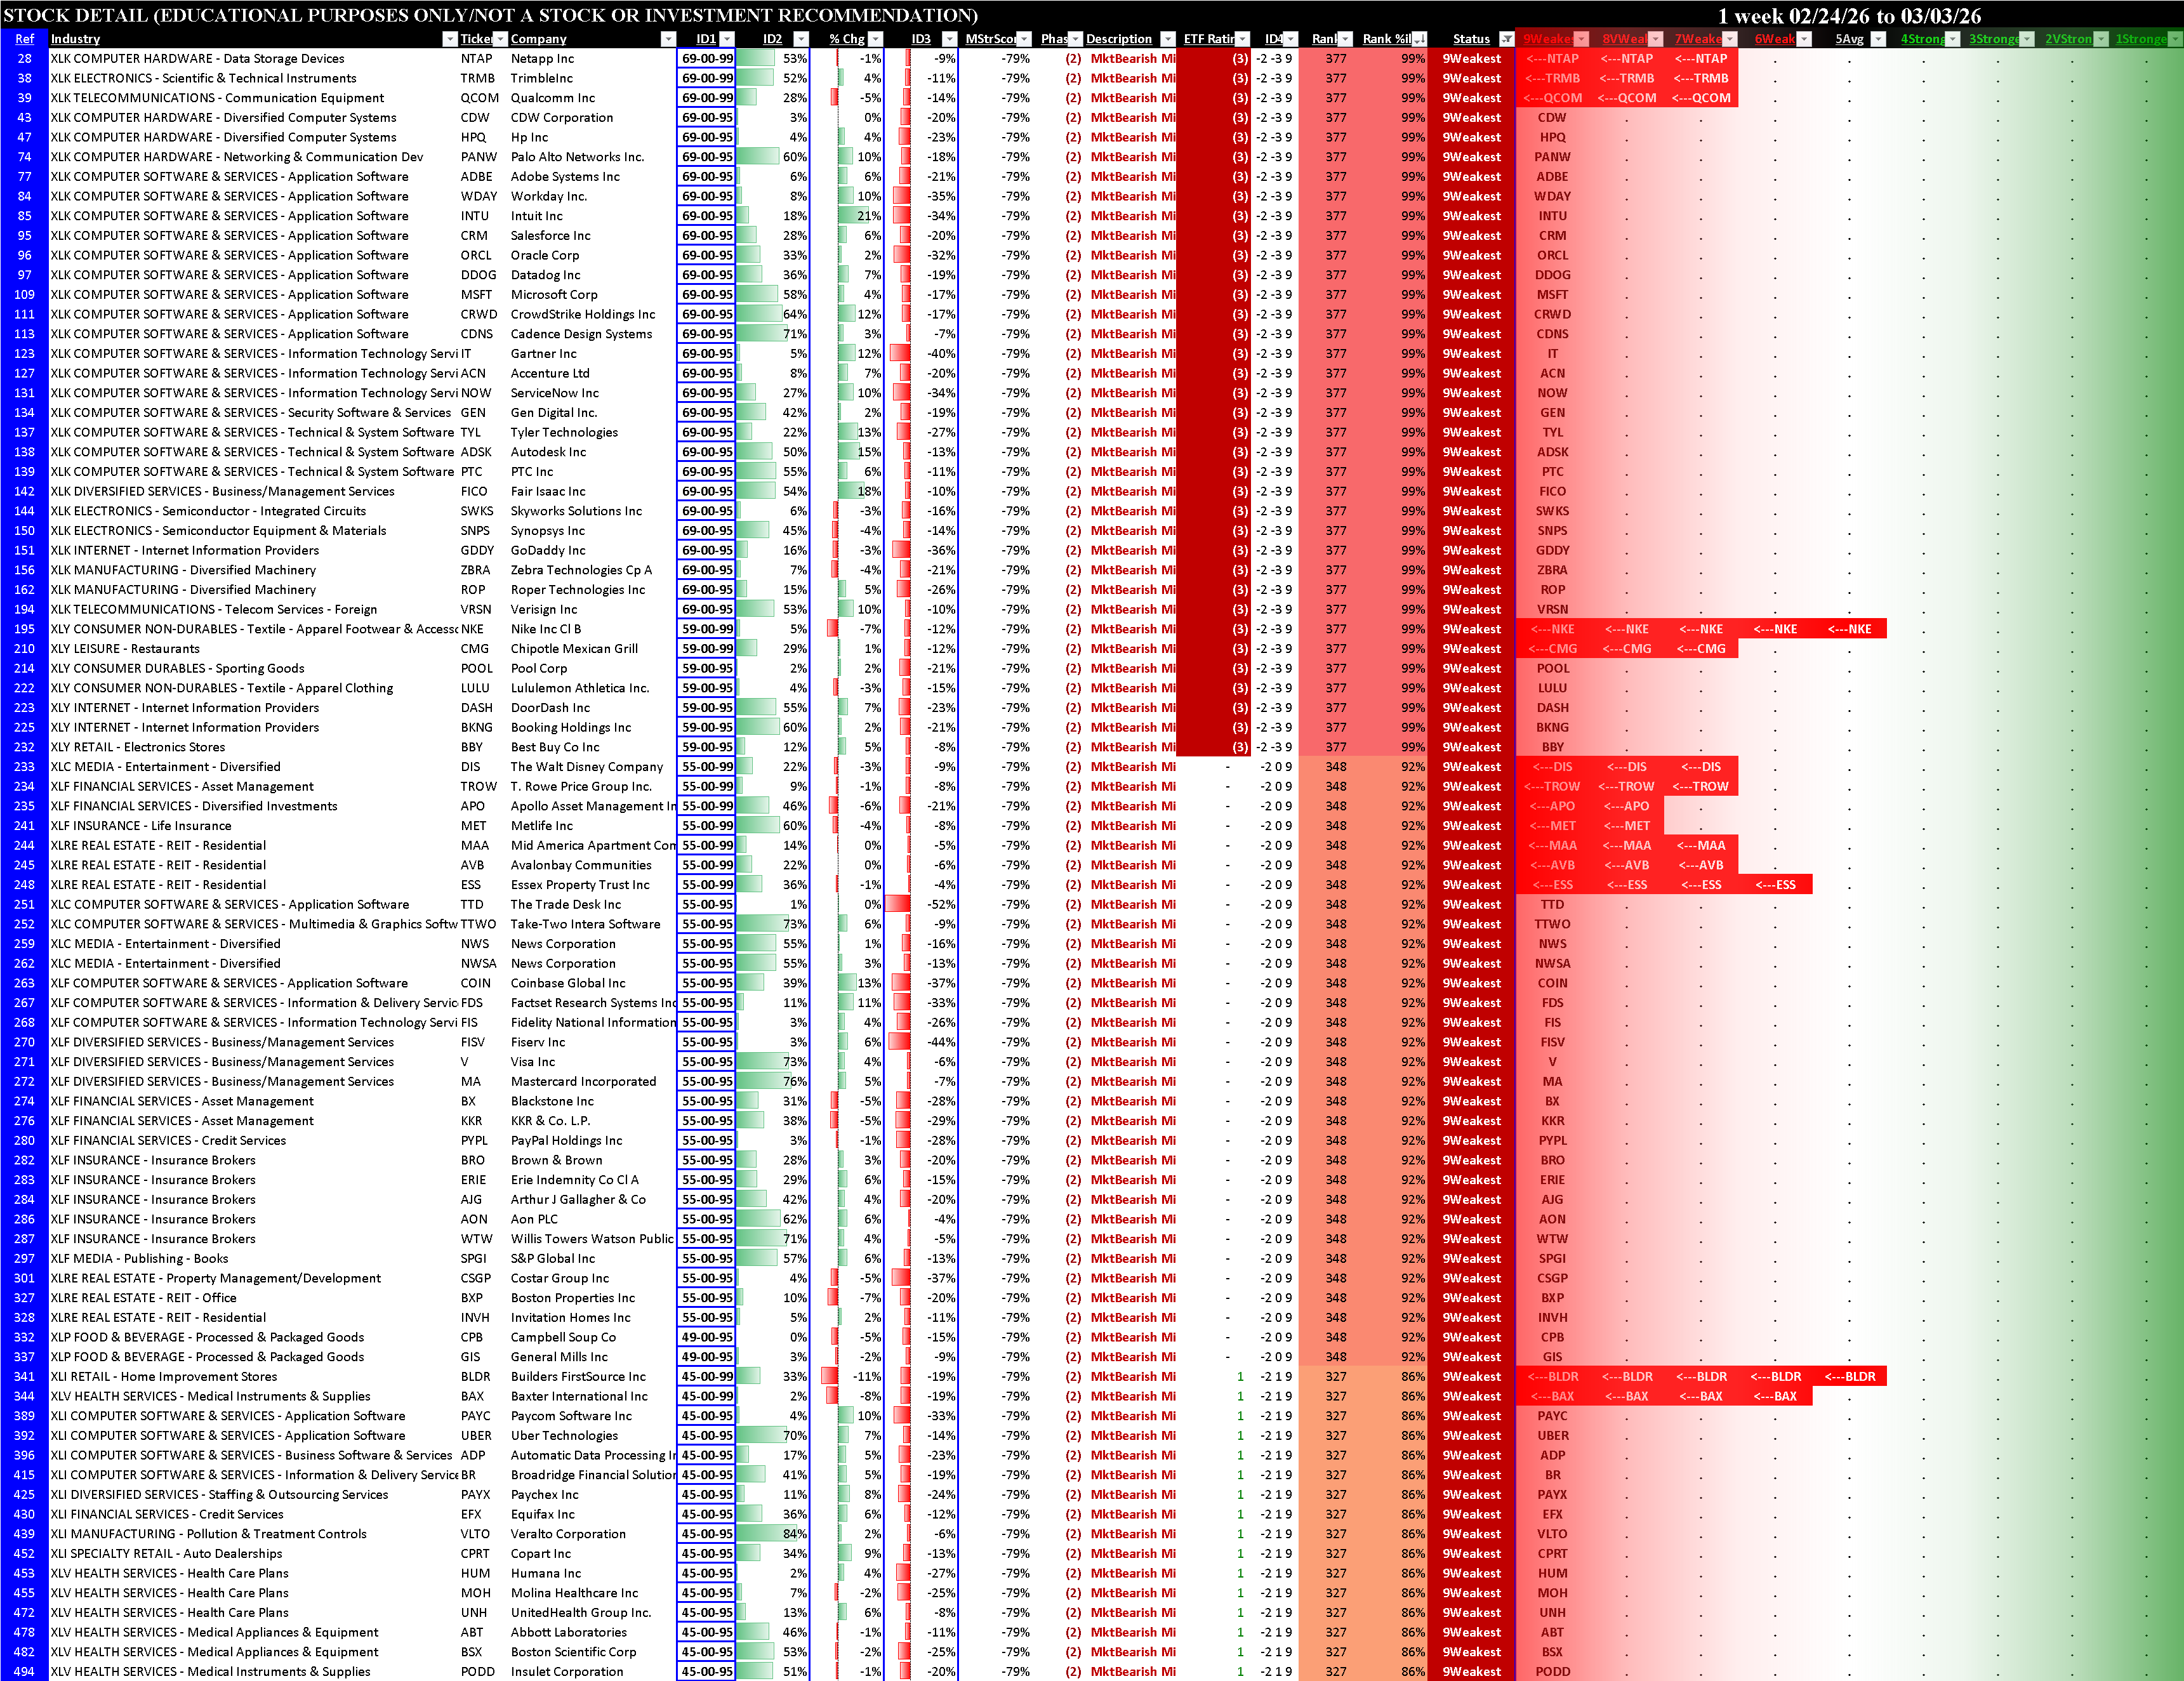
Sector ETFs Stocks Rated 1Strongest and 9Weakest
Long and short candidates are listed below, ranked based on market, sector, and stock strength characteristics.