SMO Dashboard Fri 2026-03-20 (Market = Bearish Advanced Phase)

TLDR:
This dashboard uncovers strength and weakness at the market, sector, industry, sub-industry, and stock levels to aid decision-making in the prevailing market environment.
Commentary
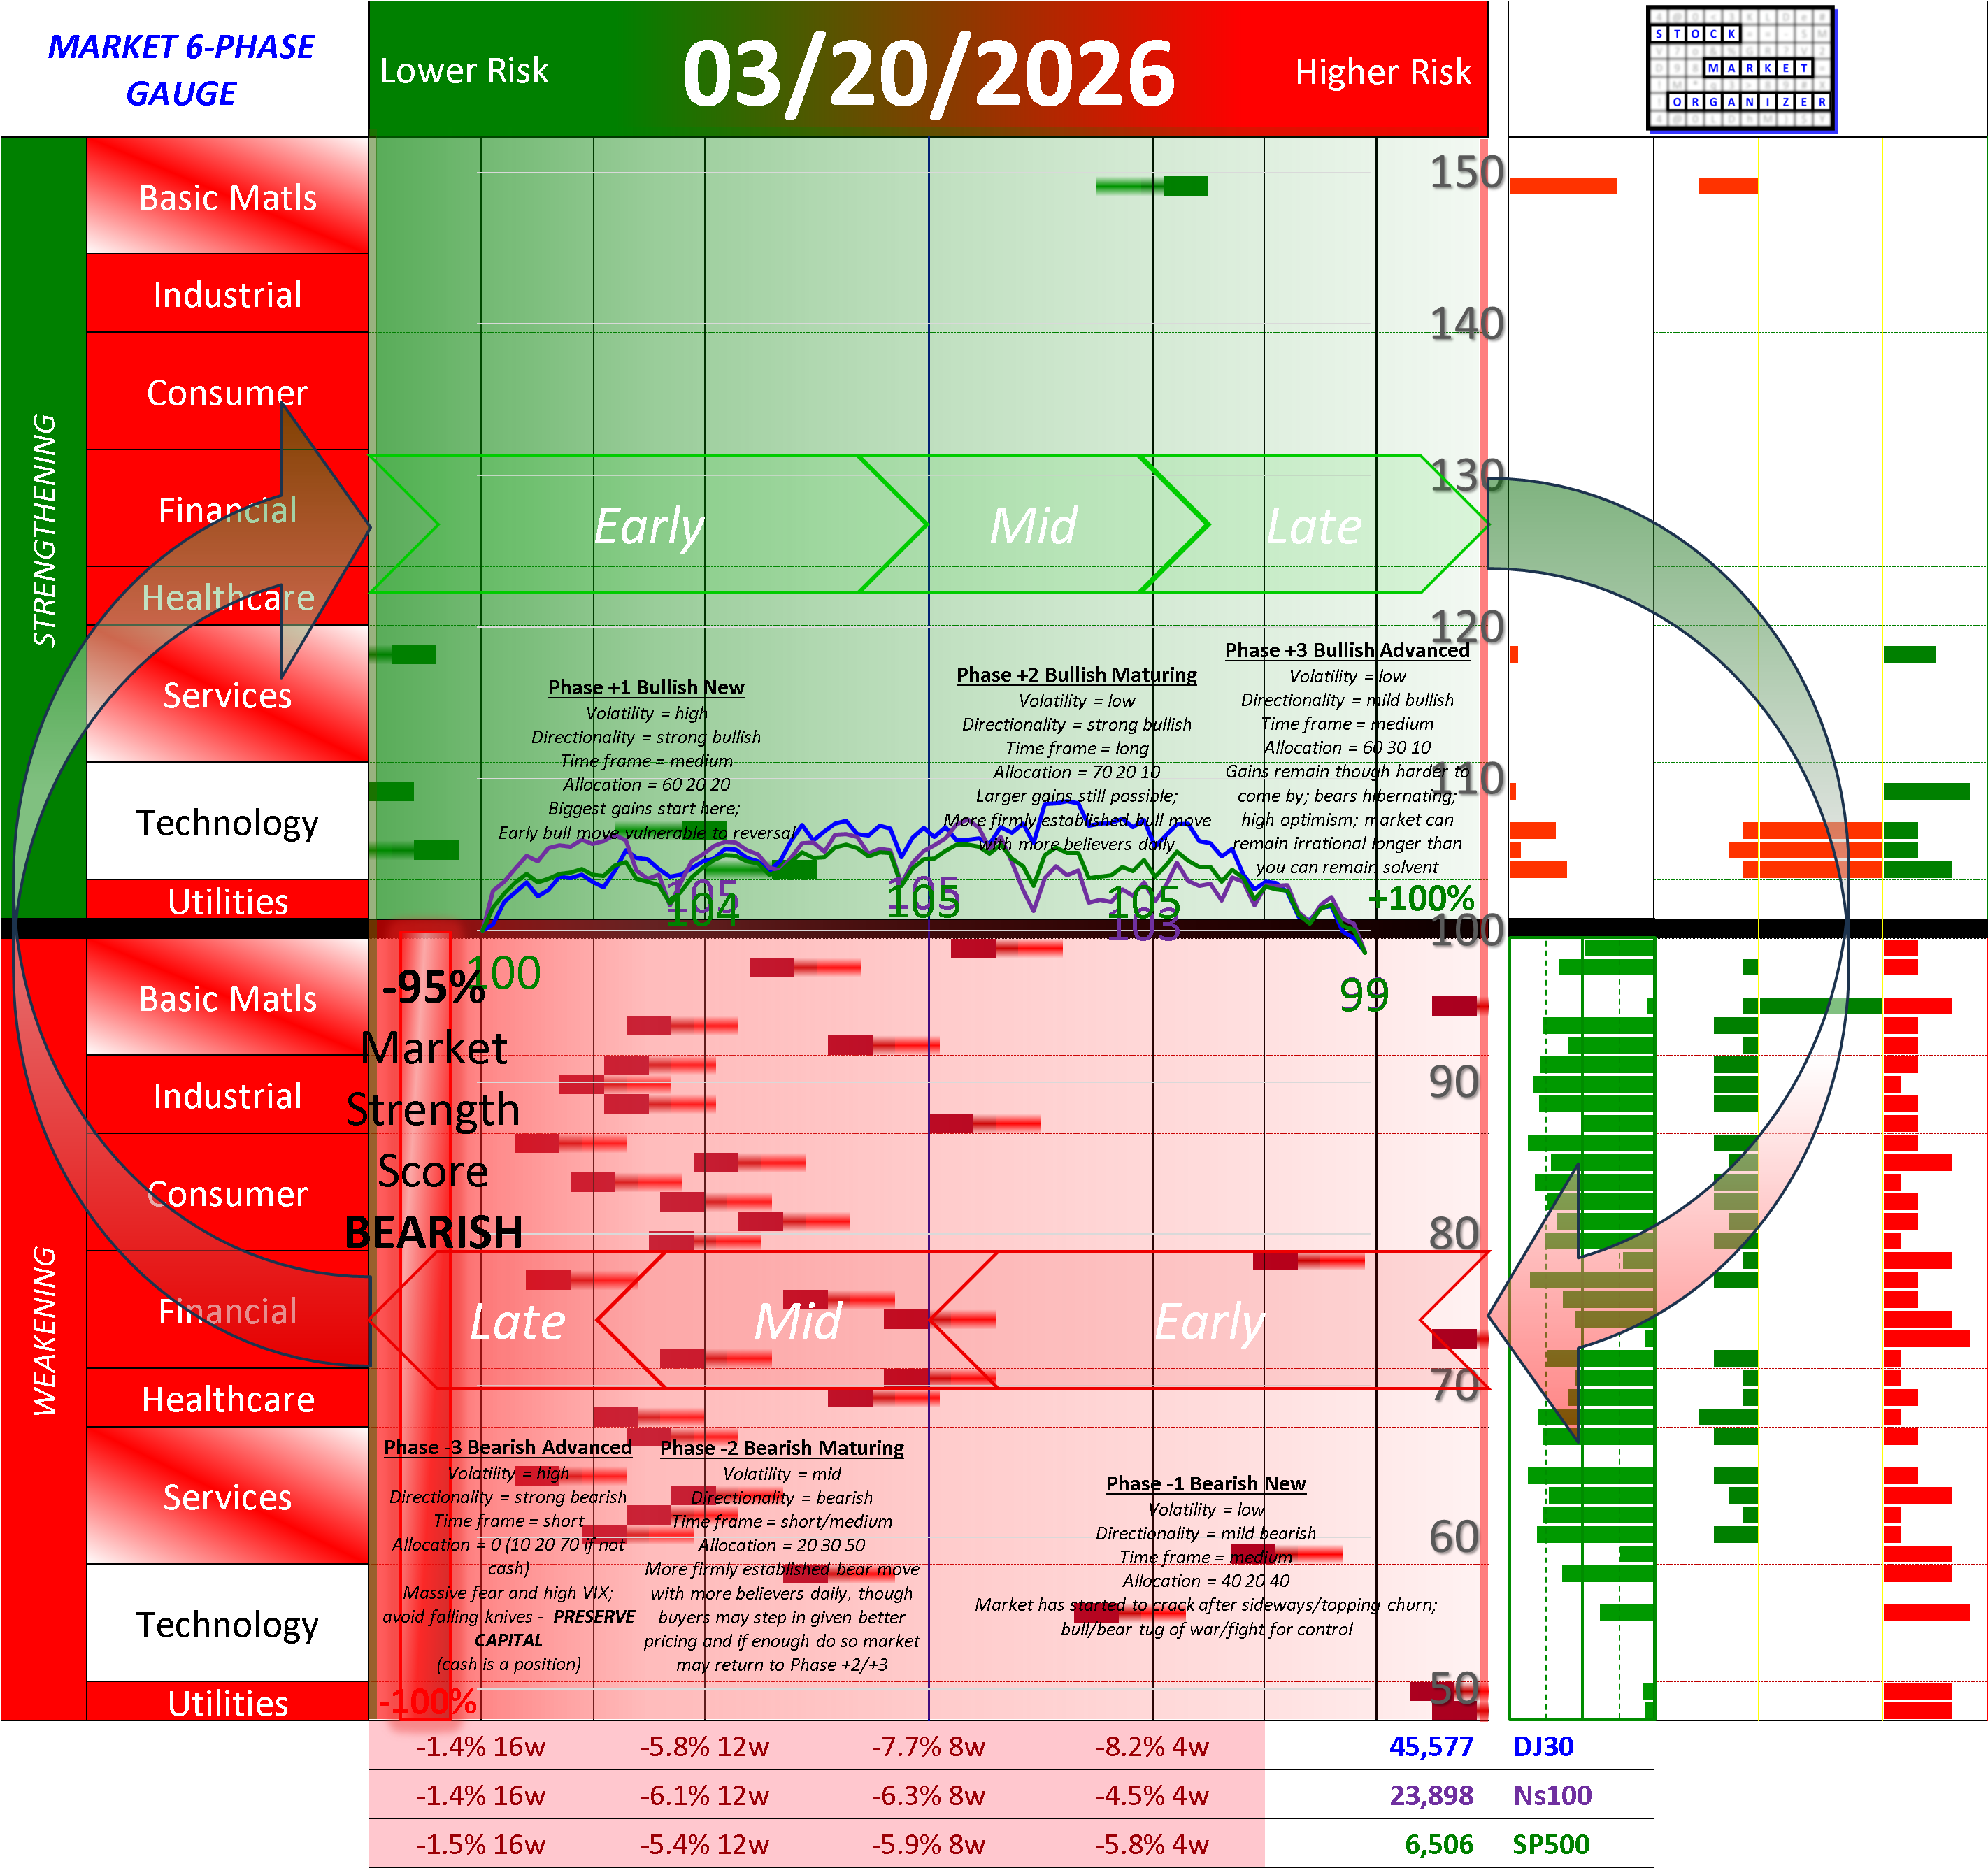
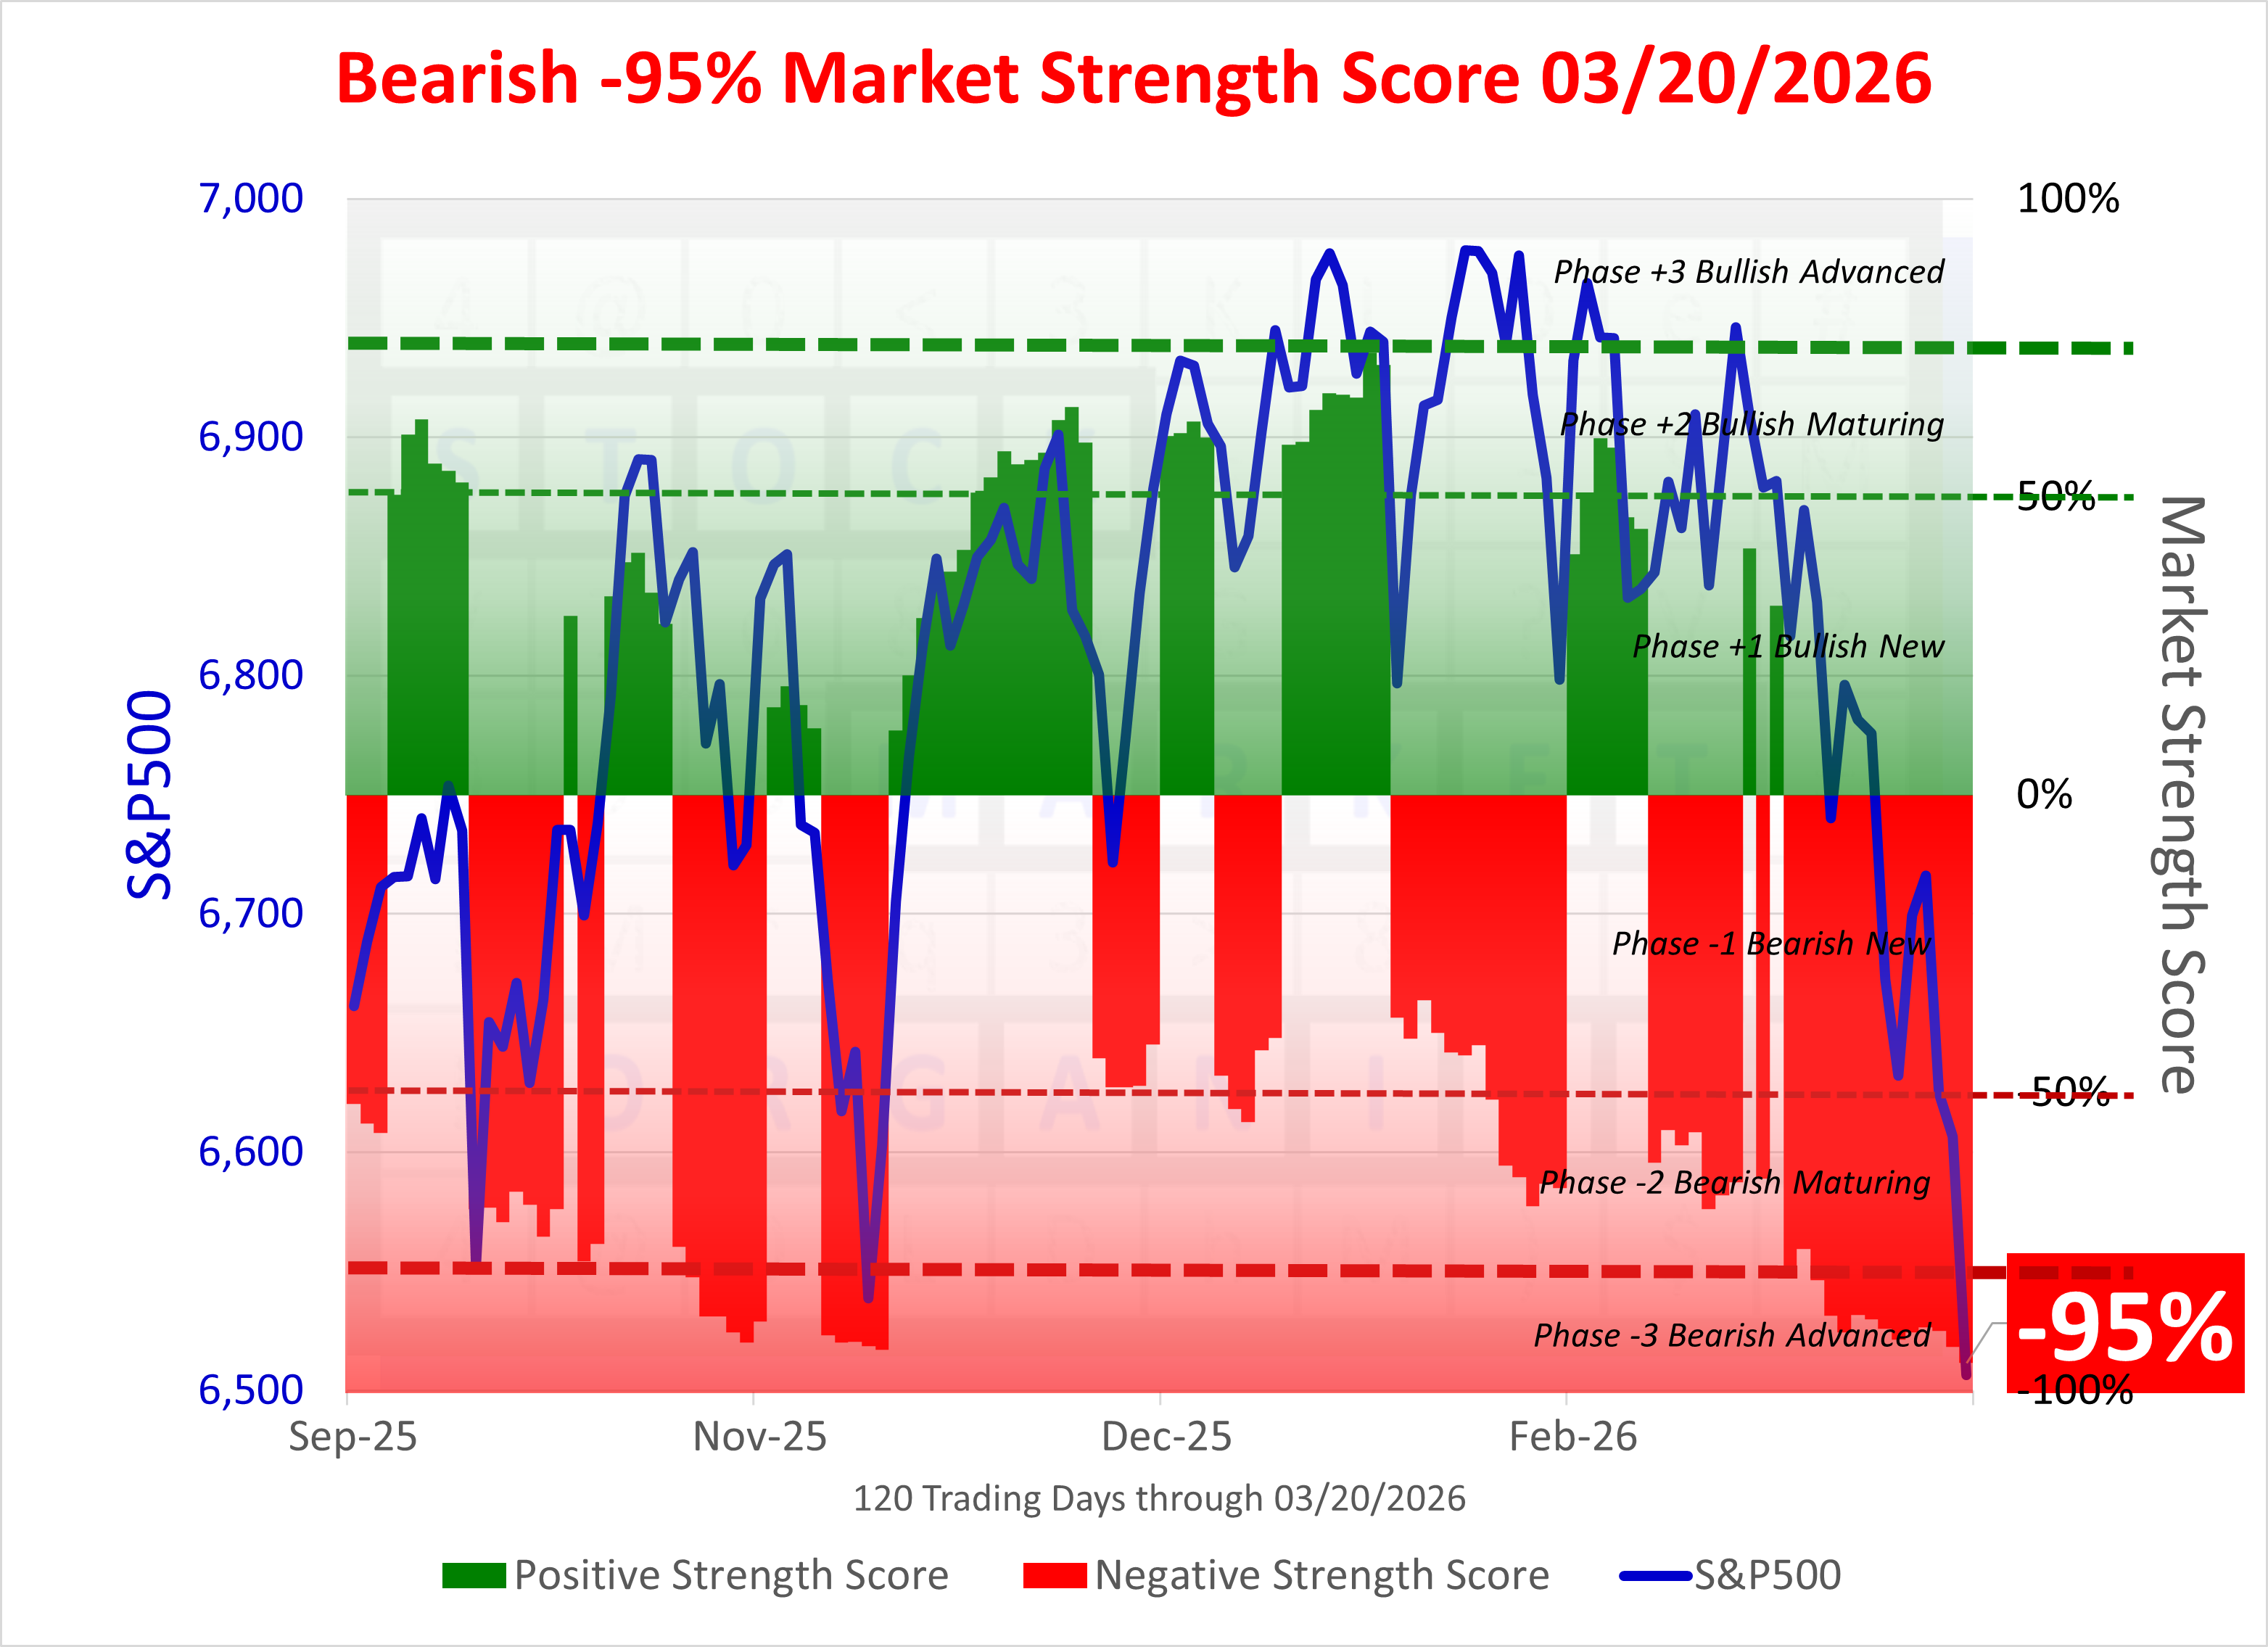
The Market Strength Score is currently advanced stage Bearish. Be cautious - this is high risk territory.
Tracked indexes performance this week:
- Strengthened/+1: None
- Strengthened/0: None
- Unchanged: None
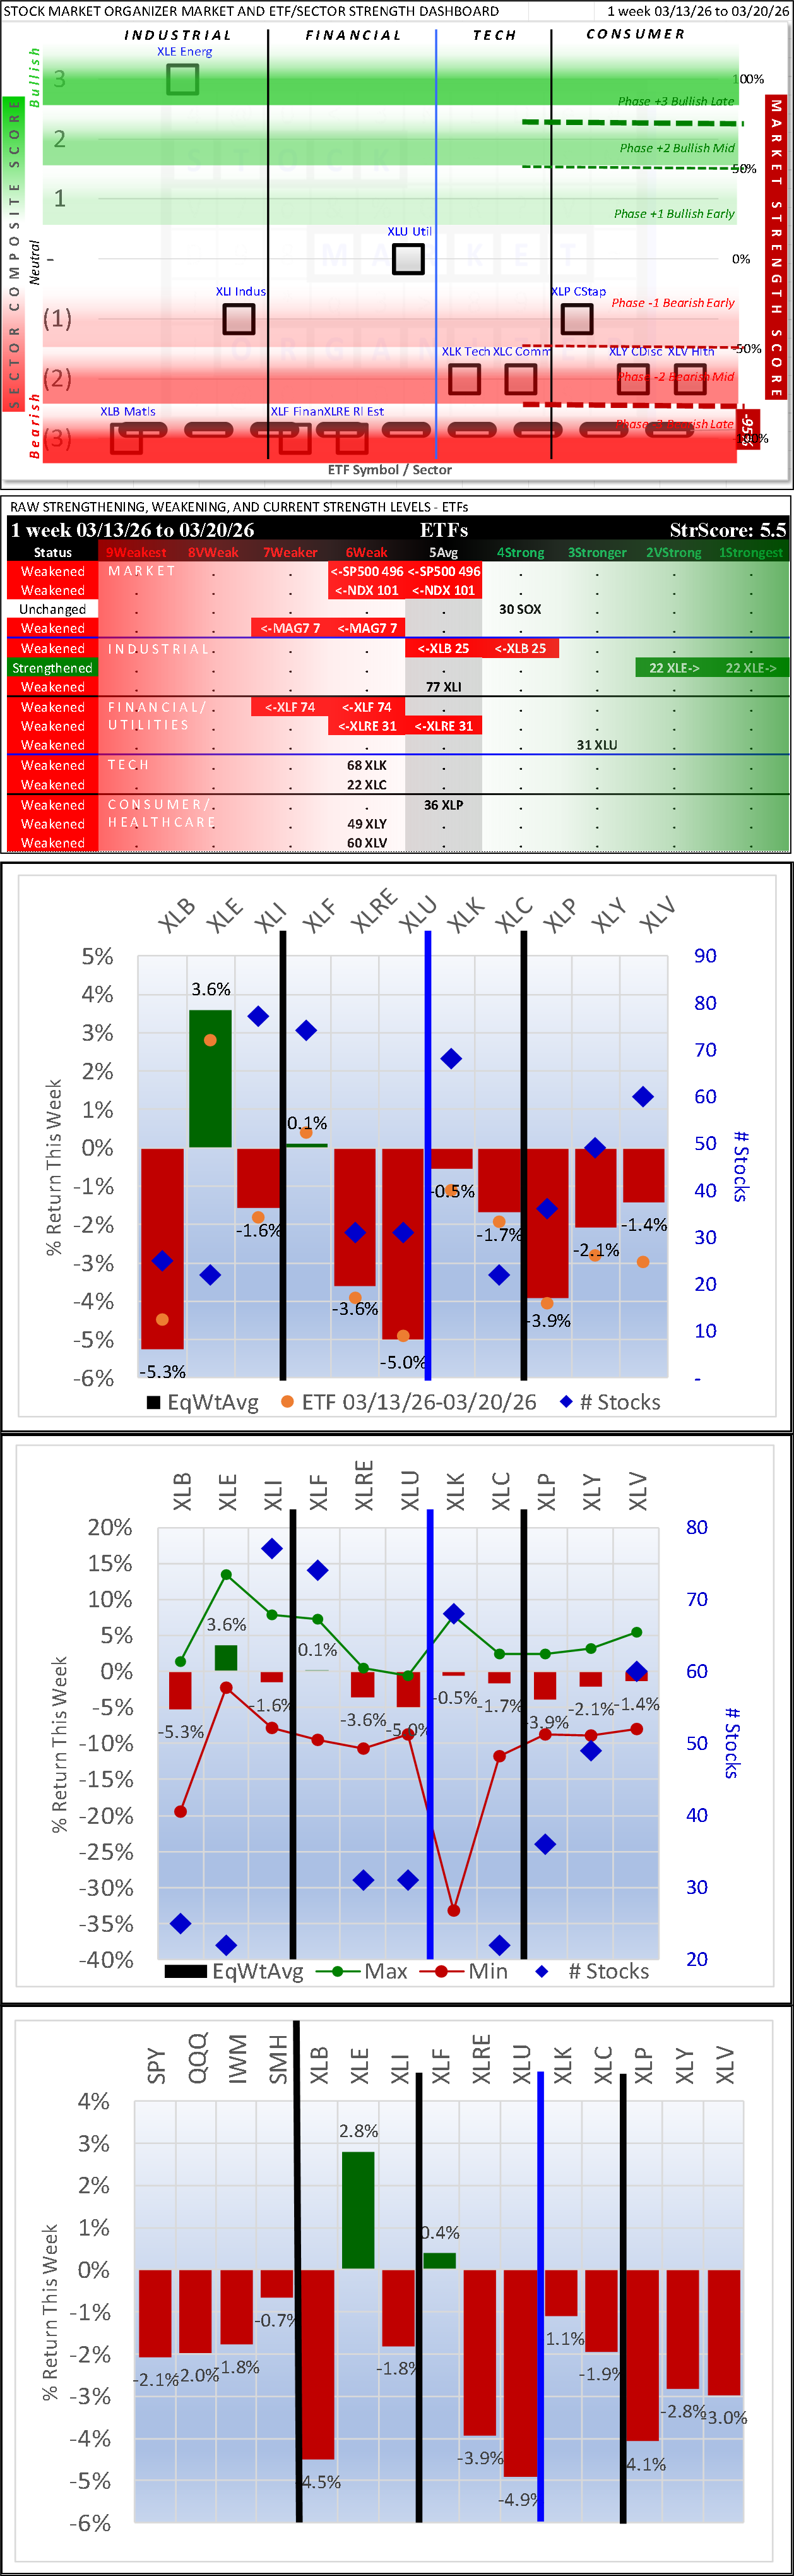
- Weakened/0 SOX (4Strong)
- Weakened/-1: SP500 (6Weak), NDX (6Weak), MAG7 (7Weaker)
The dashboard is widespread red through Technology shows relative strength. The red in Financials finally started to take down Real Estate. Utilities are weak. Energy/Oil is strong. Metals are weak.
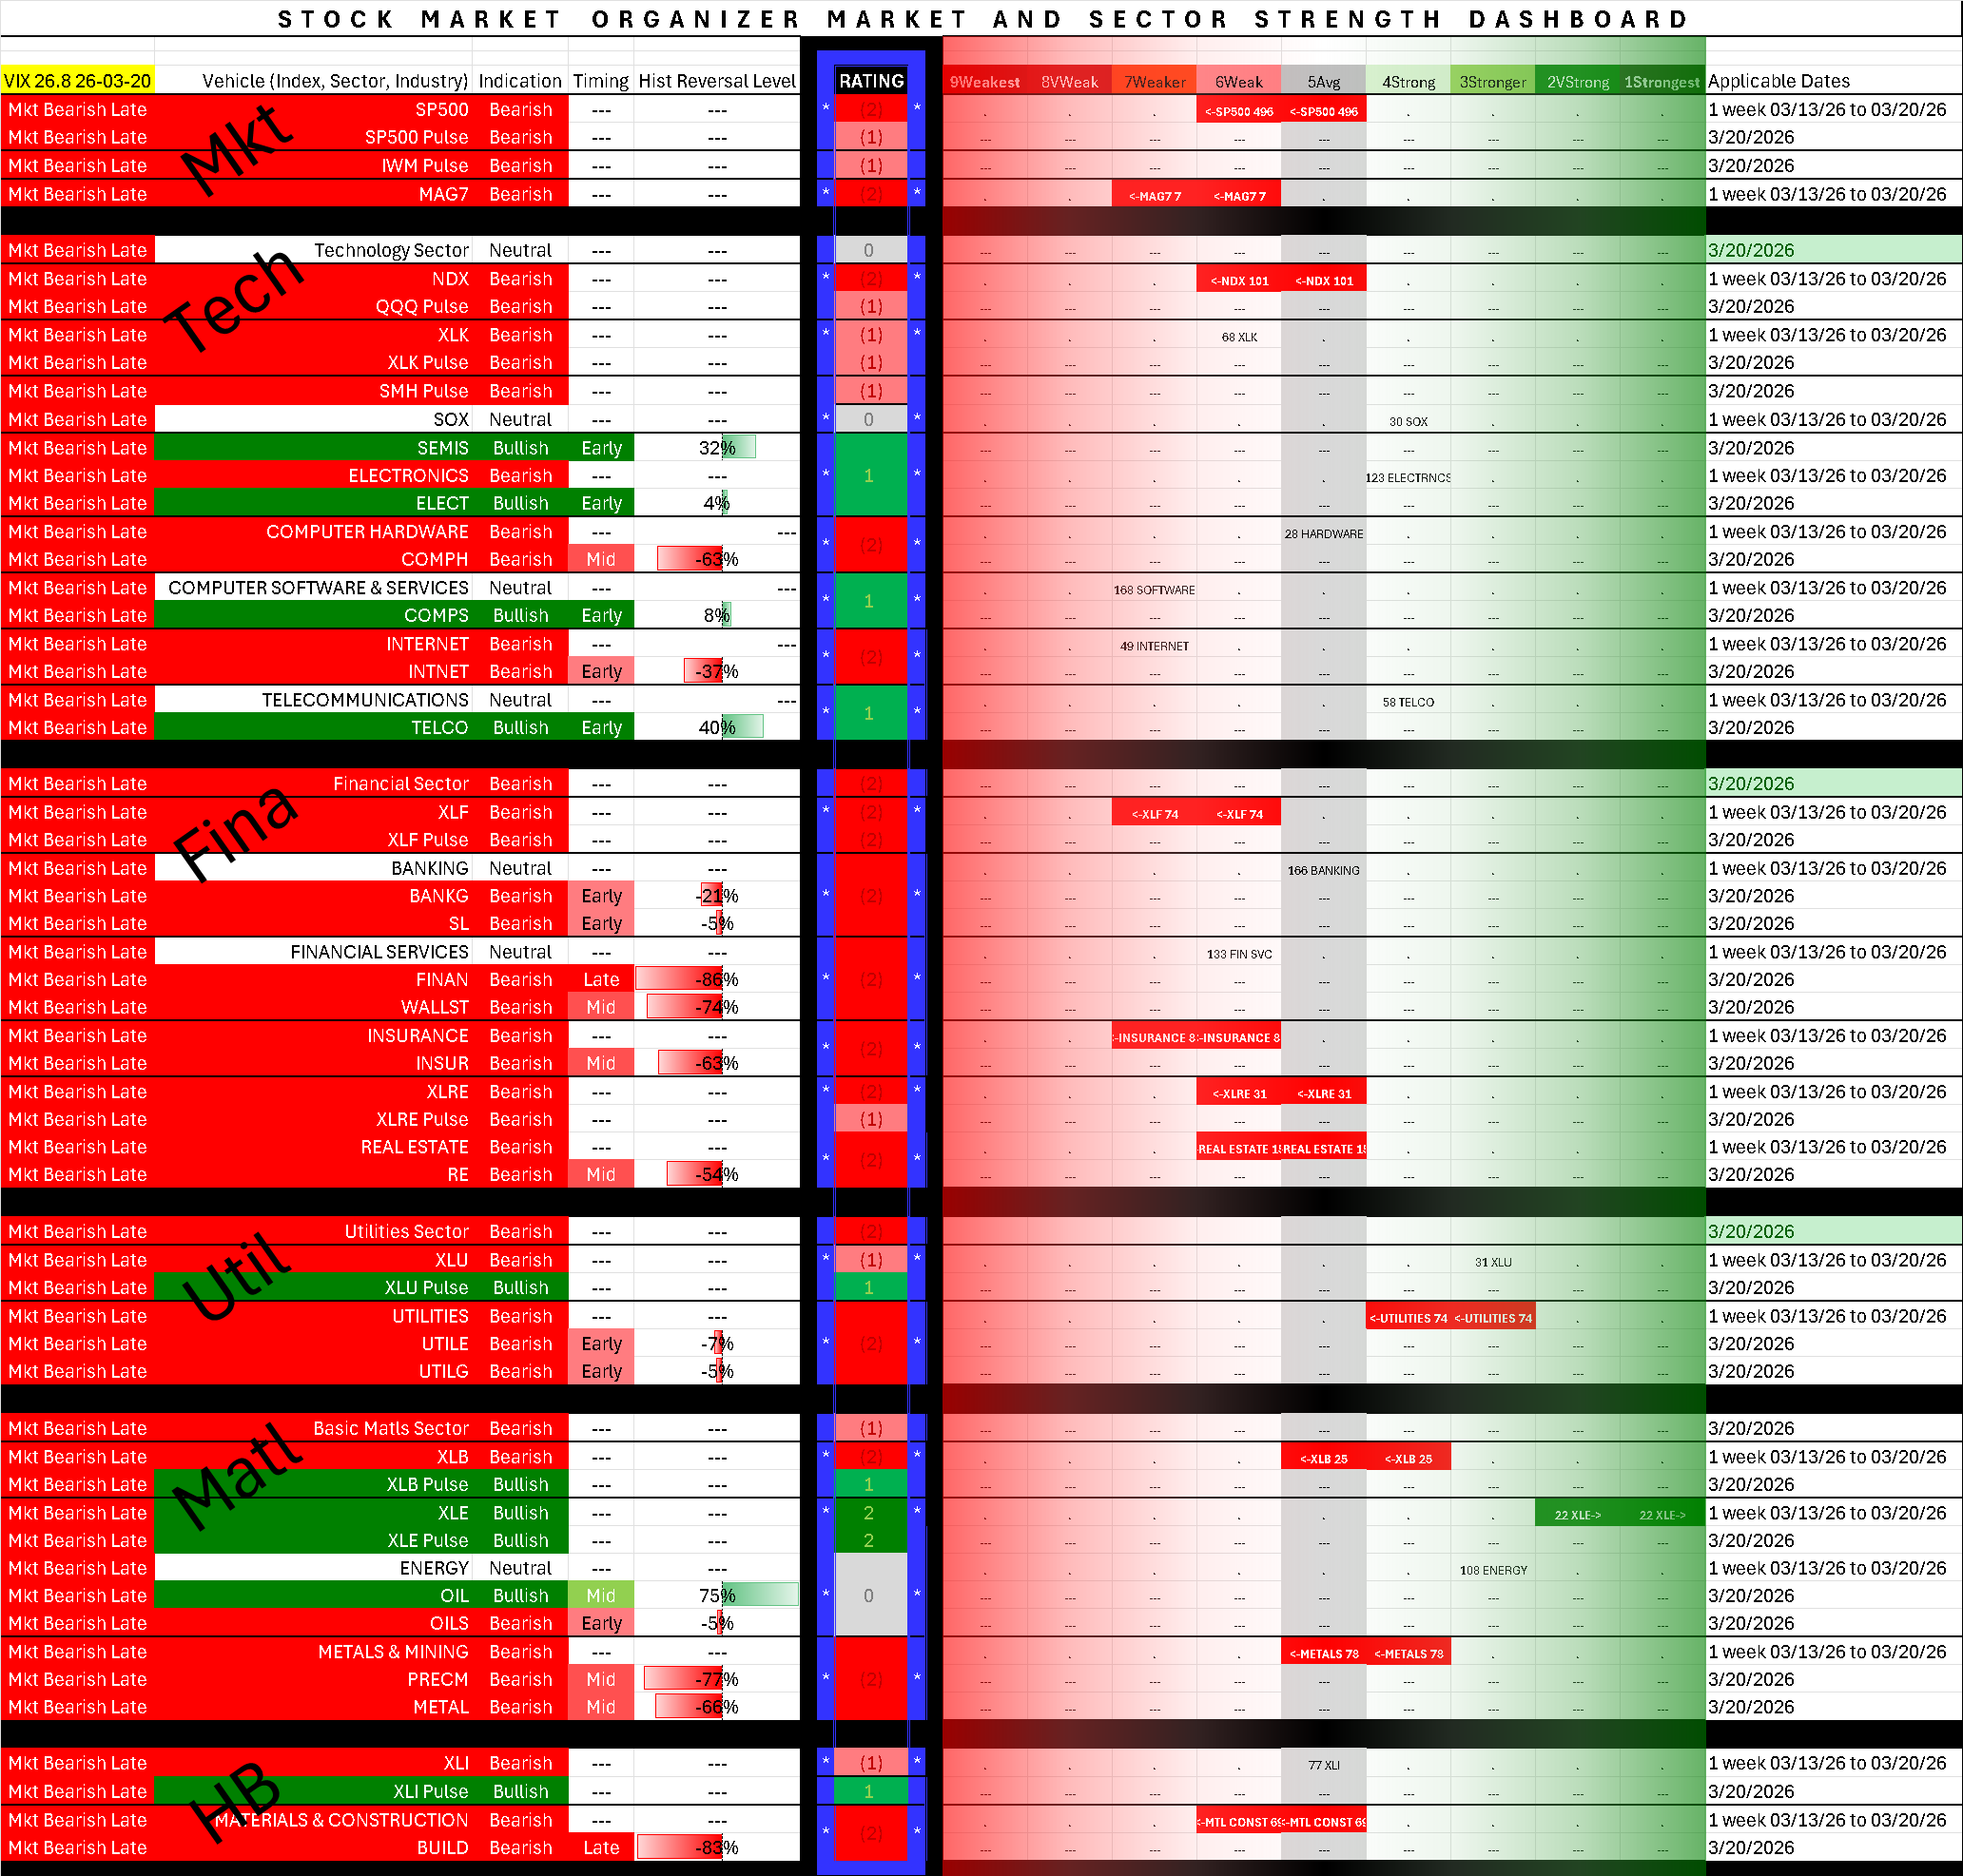
The column labeled "Rating" reflects the strength (based on this system's criteria) of the individual vehicle (index, sector, or industry).
Market Strength Score
Currently -95%, Phase -3 Bearish Advanced. Very low yet not at full extreme. Expect volatility with the possibility of a cascading decline, though be ready to turn positive even if the headlines seem dismal (see this post for an example of this concept).
SPDR Sector ETFs Detail
XLE Energy is the lone wolf on the green side this week as XLB Materials, XLF Financial, and XLRE Real Estate were the laggards.
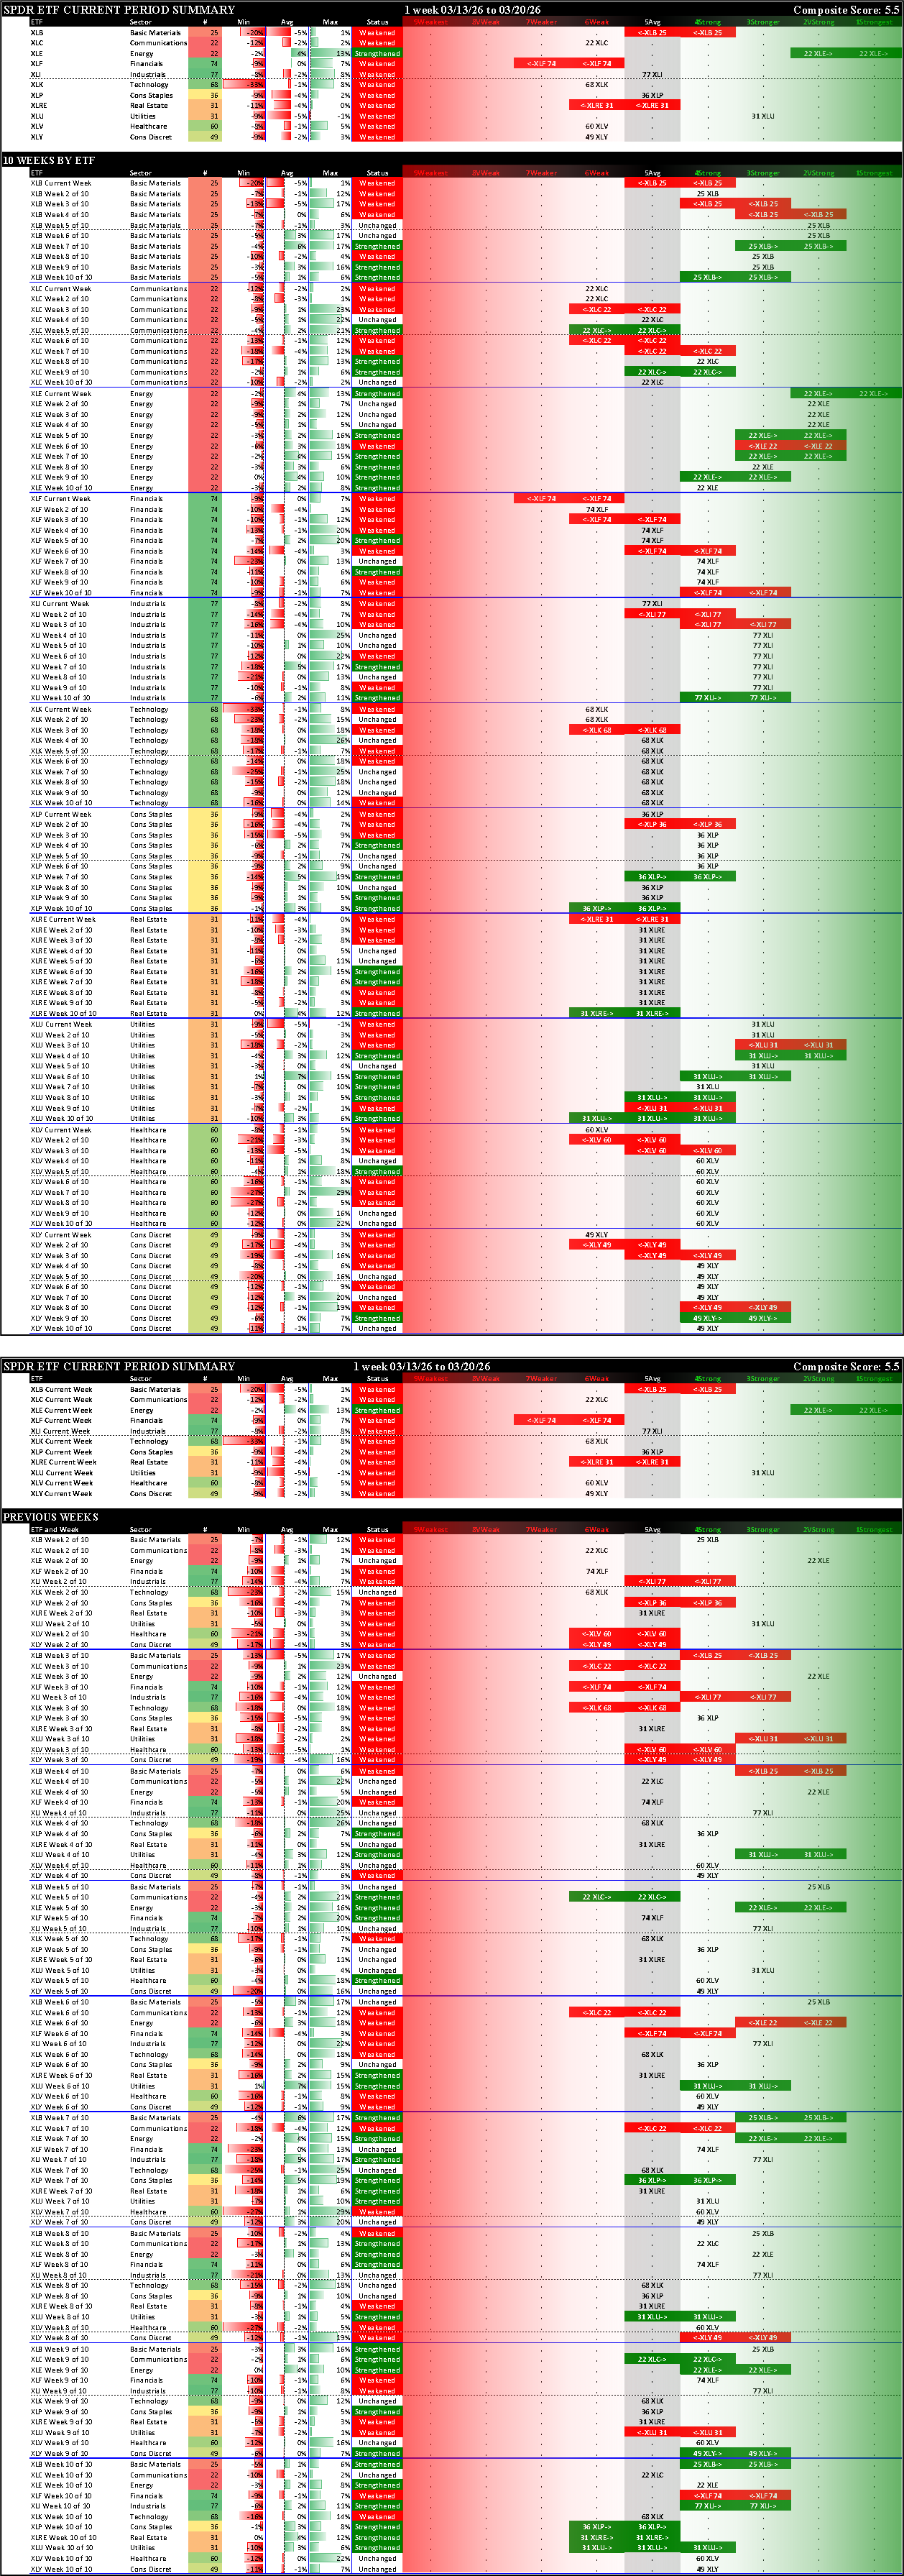
Context - 10 Week Lookbacks, by ETF and by Week
Other than XLE Energy which strengthened to 1Strongest, every other ETF weakened, three enough to change rating (XLB Materials, XLF Financials, XLRE Real Estate).
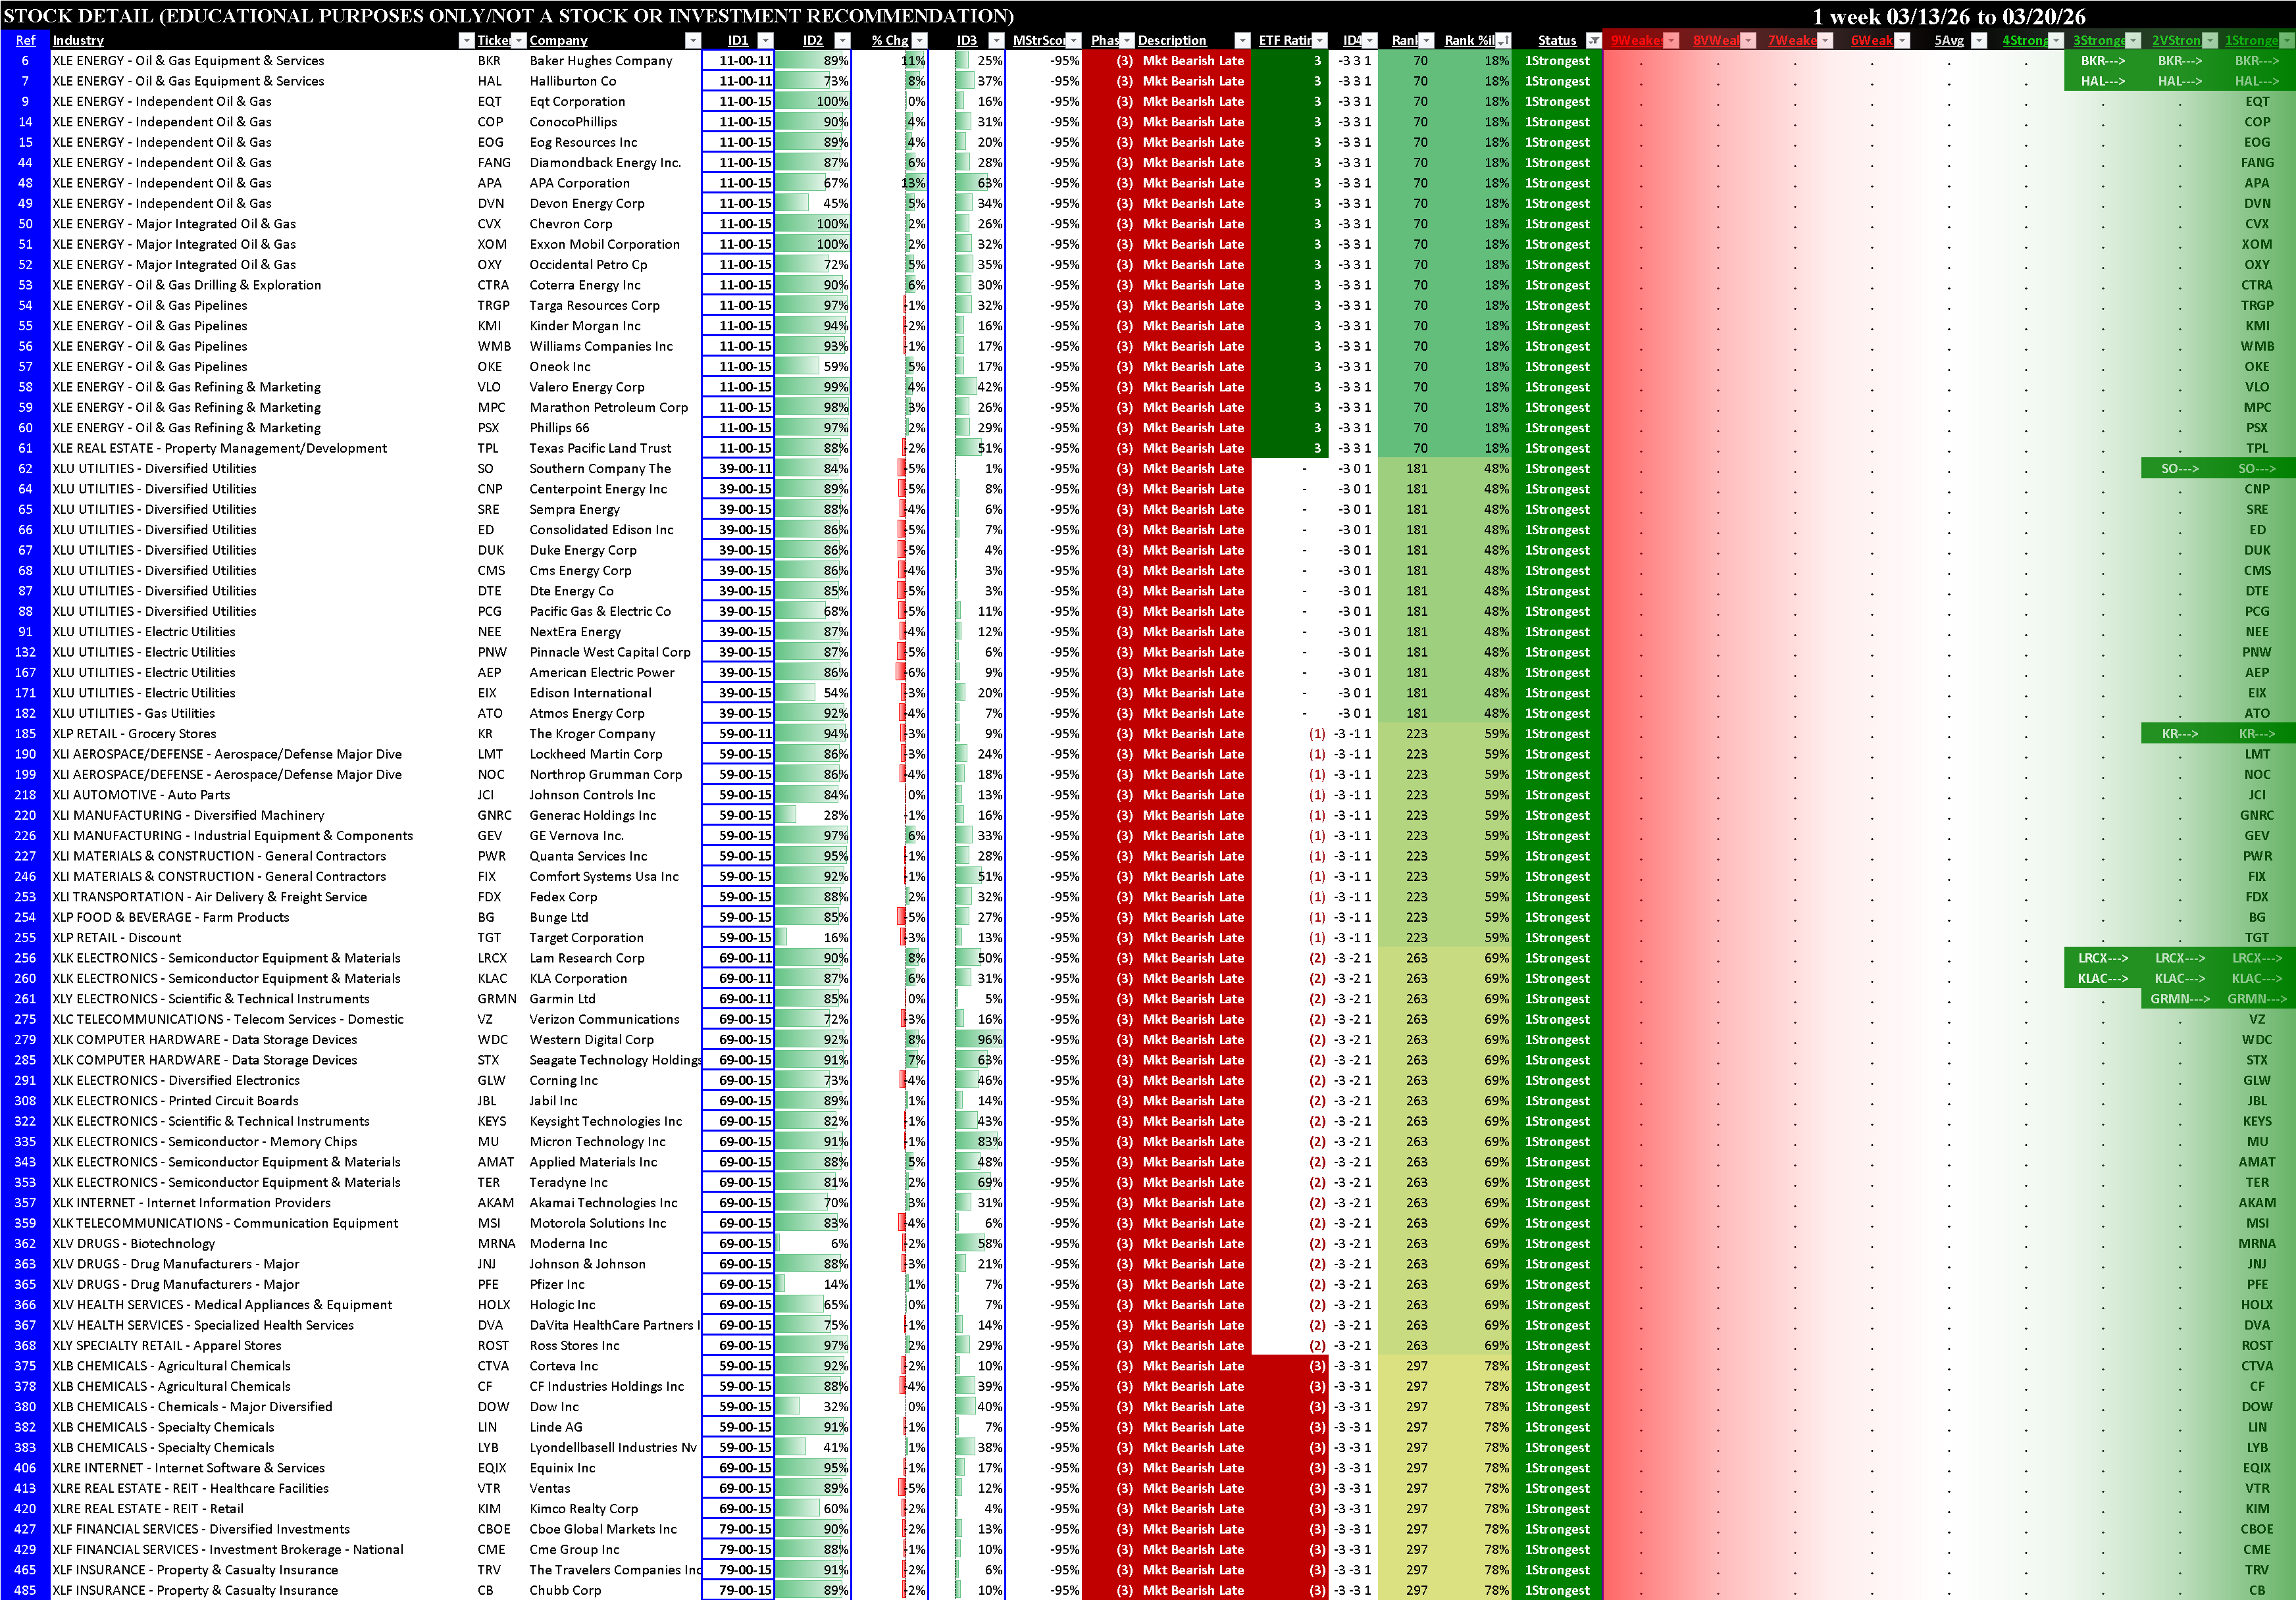
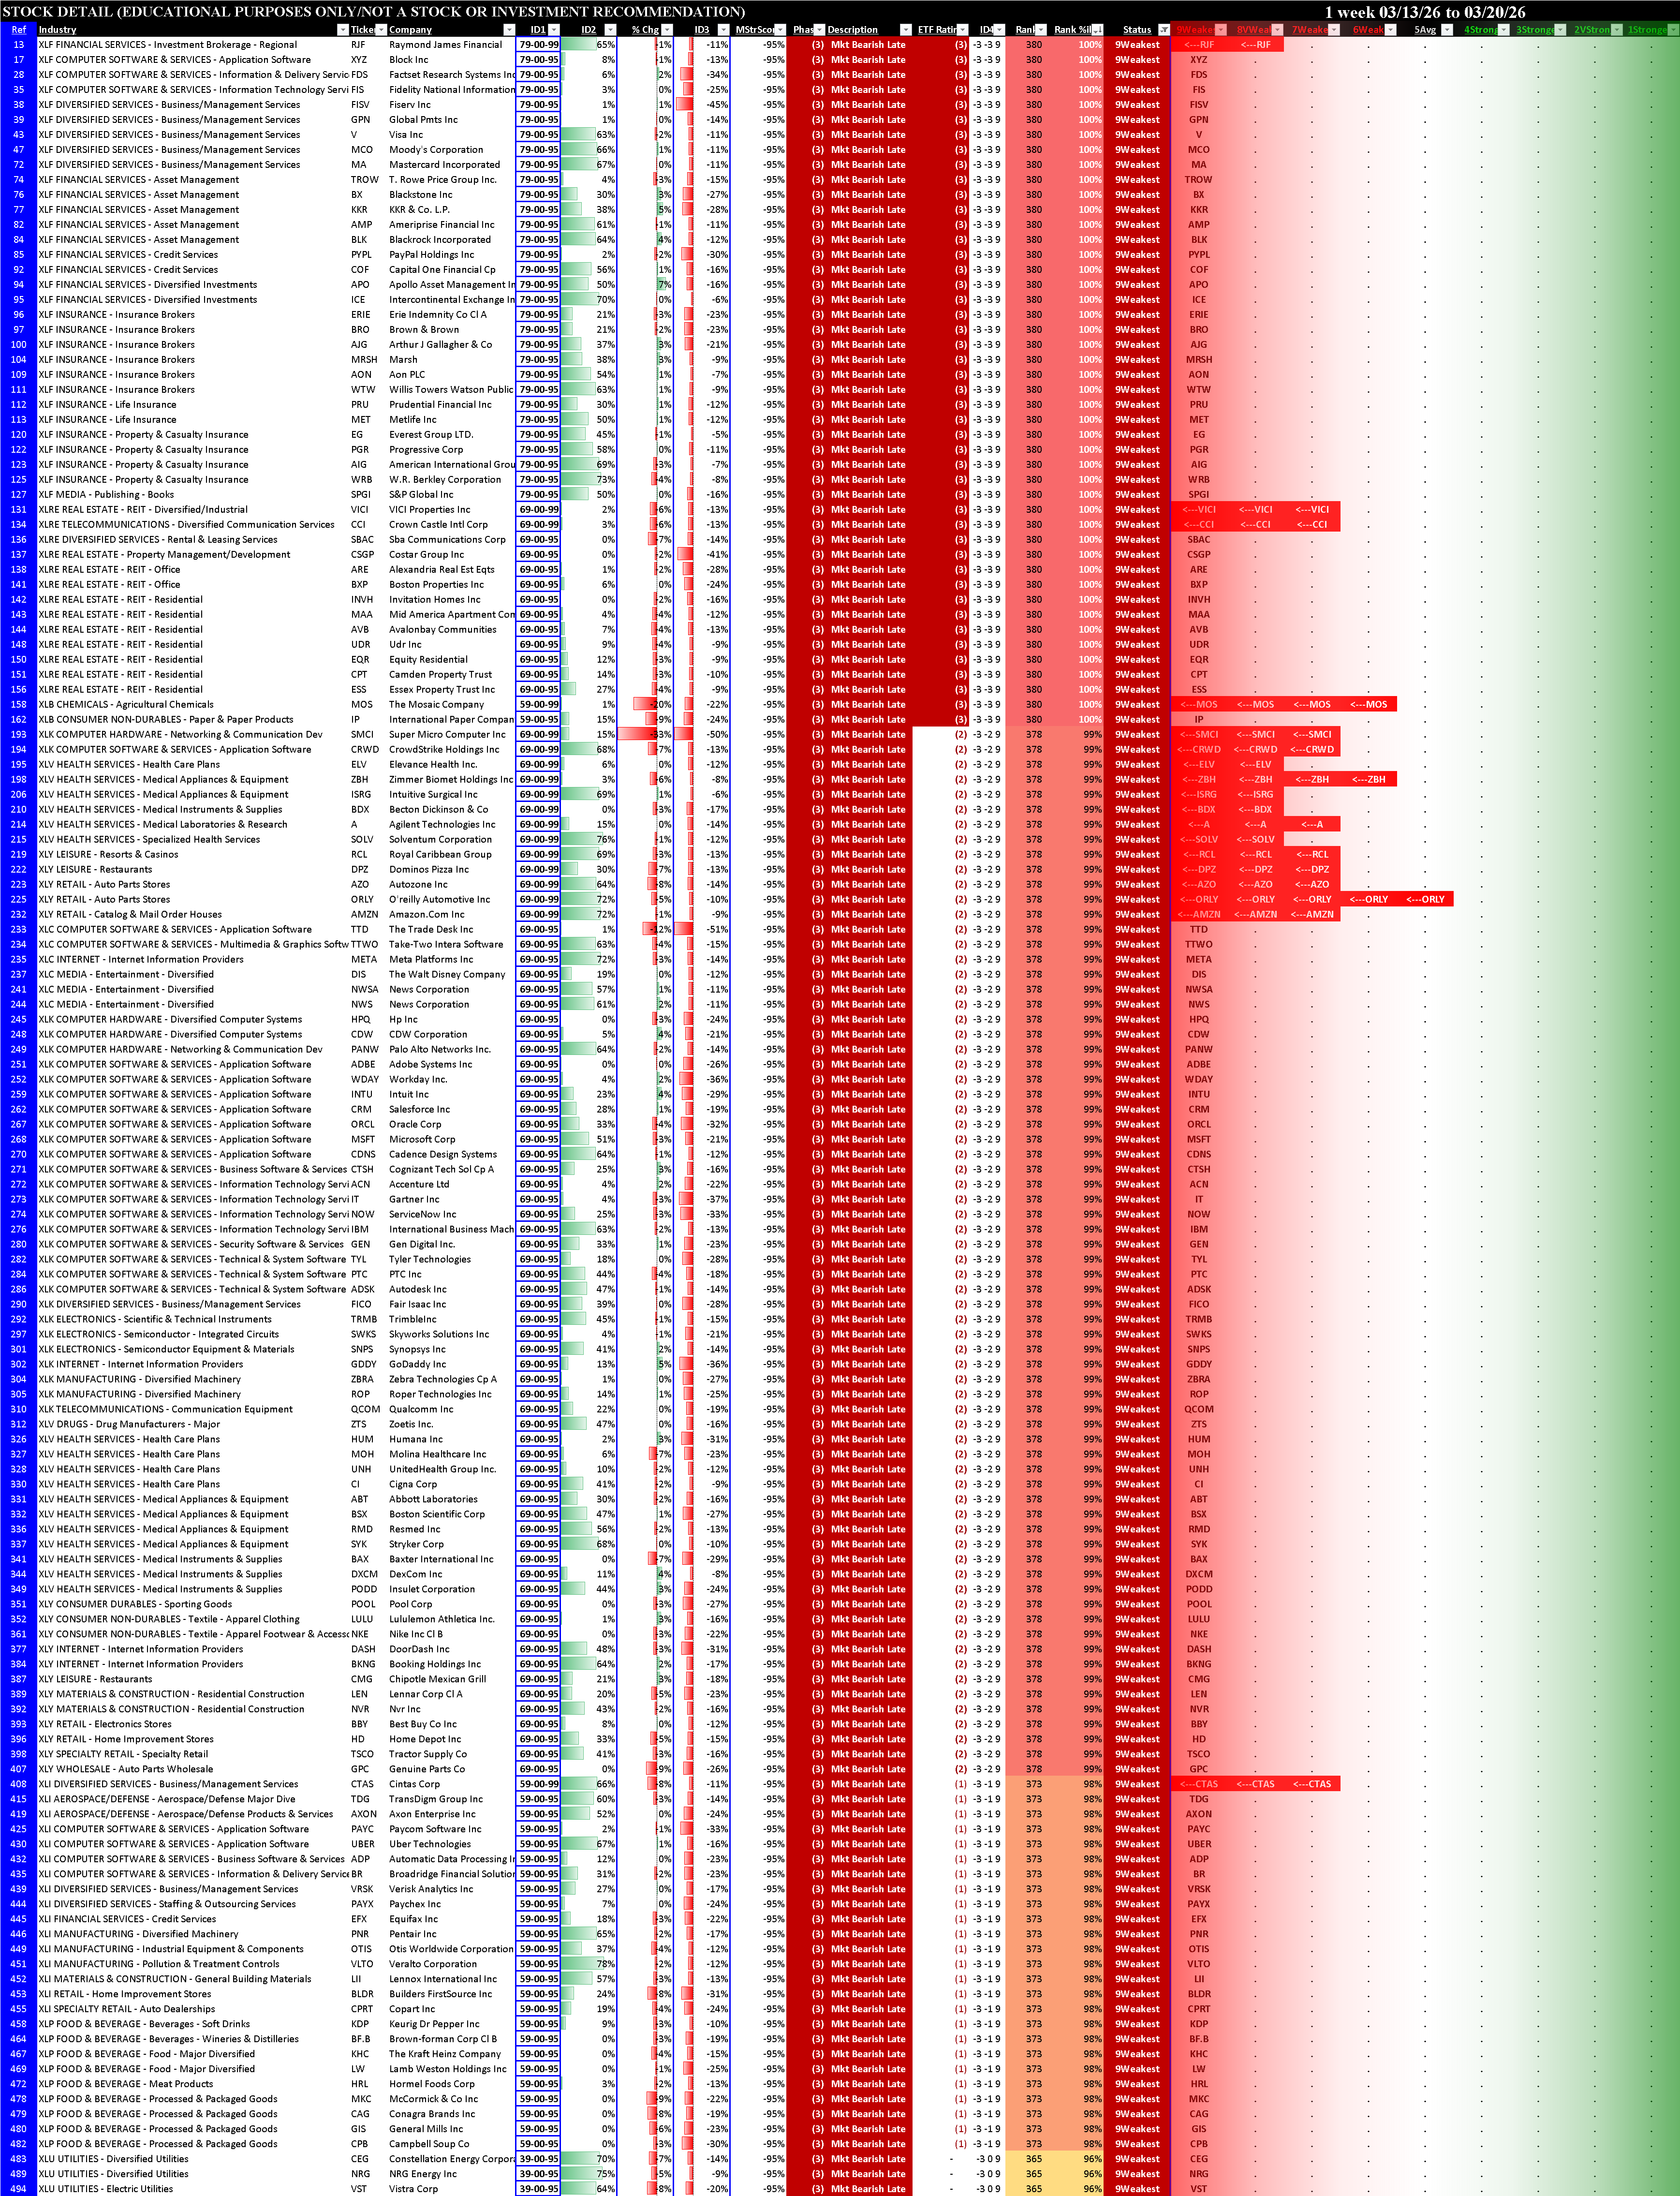
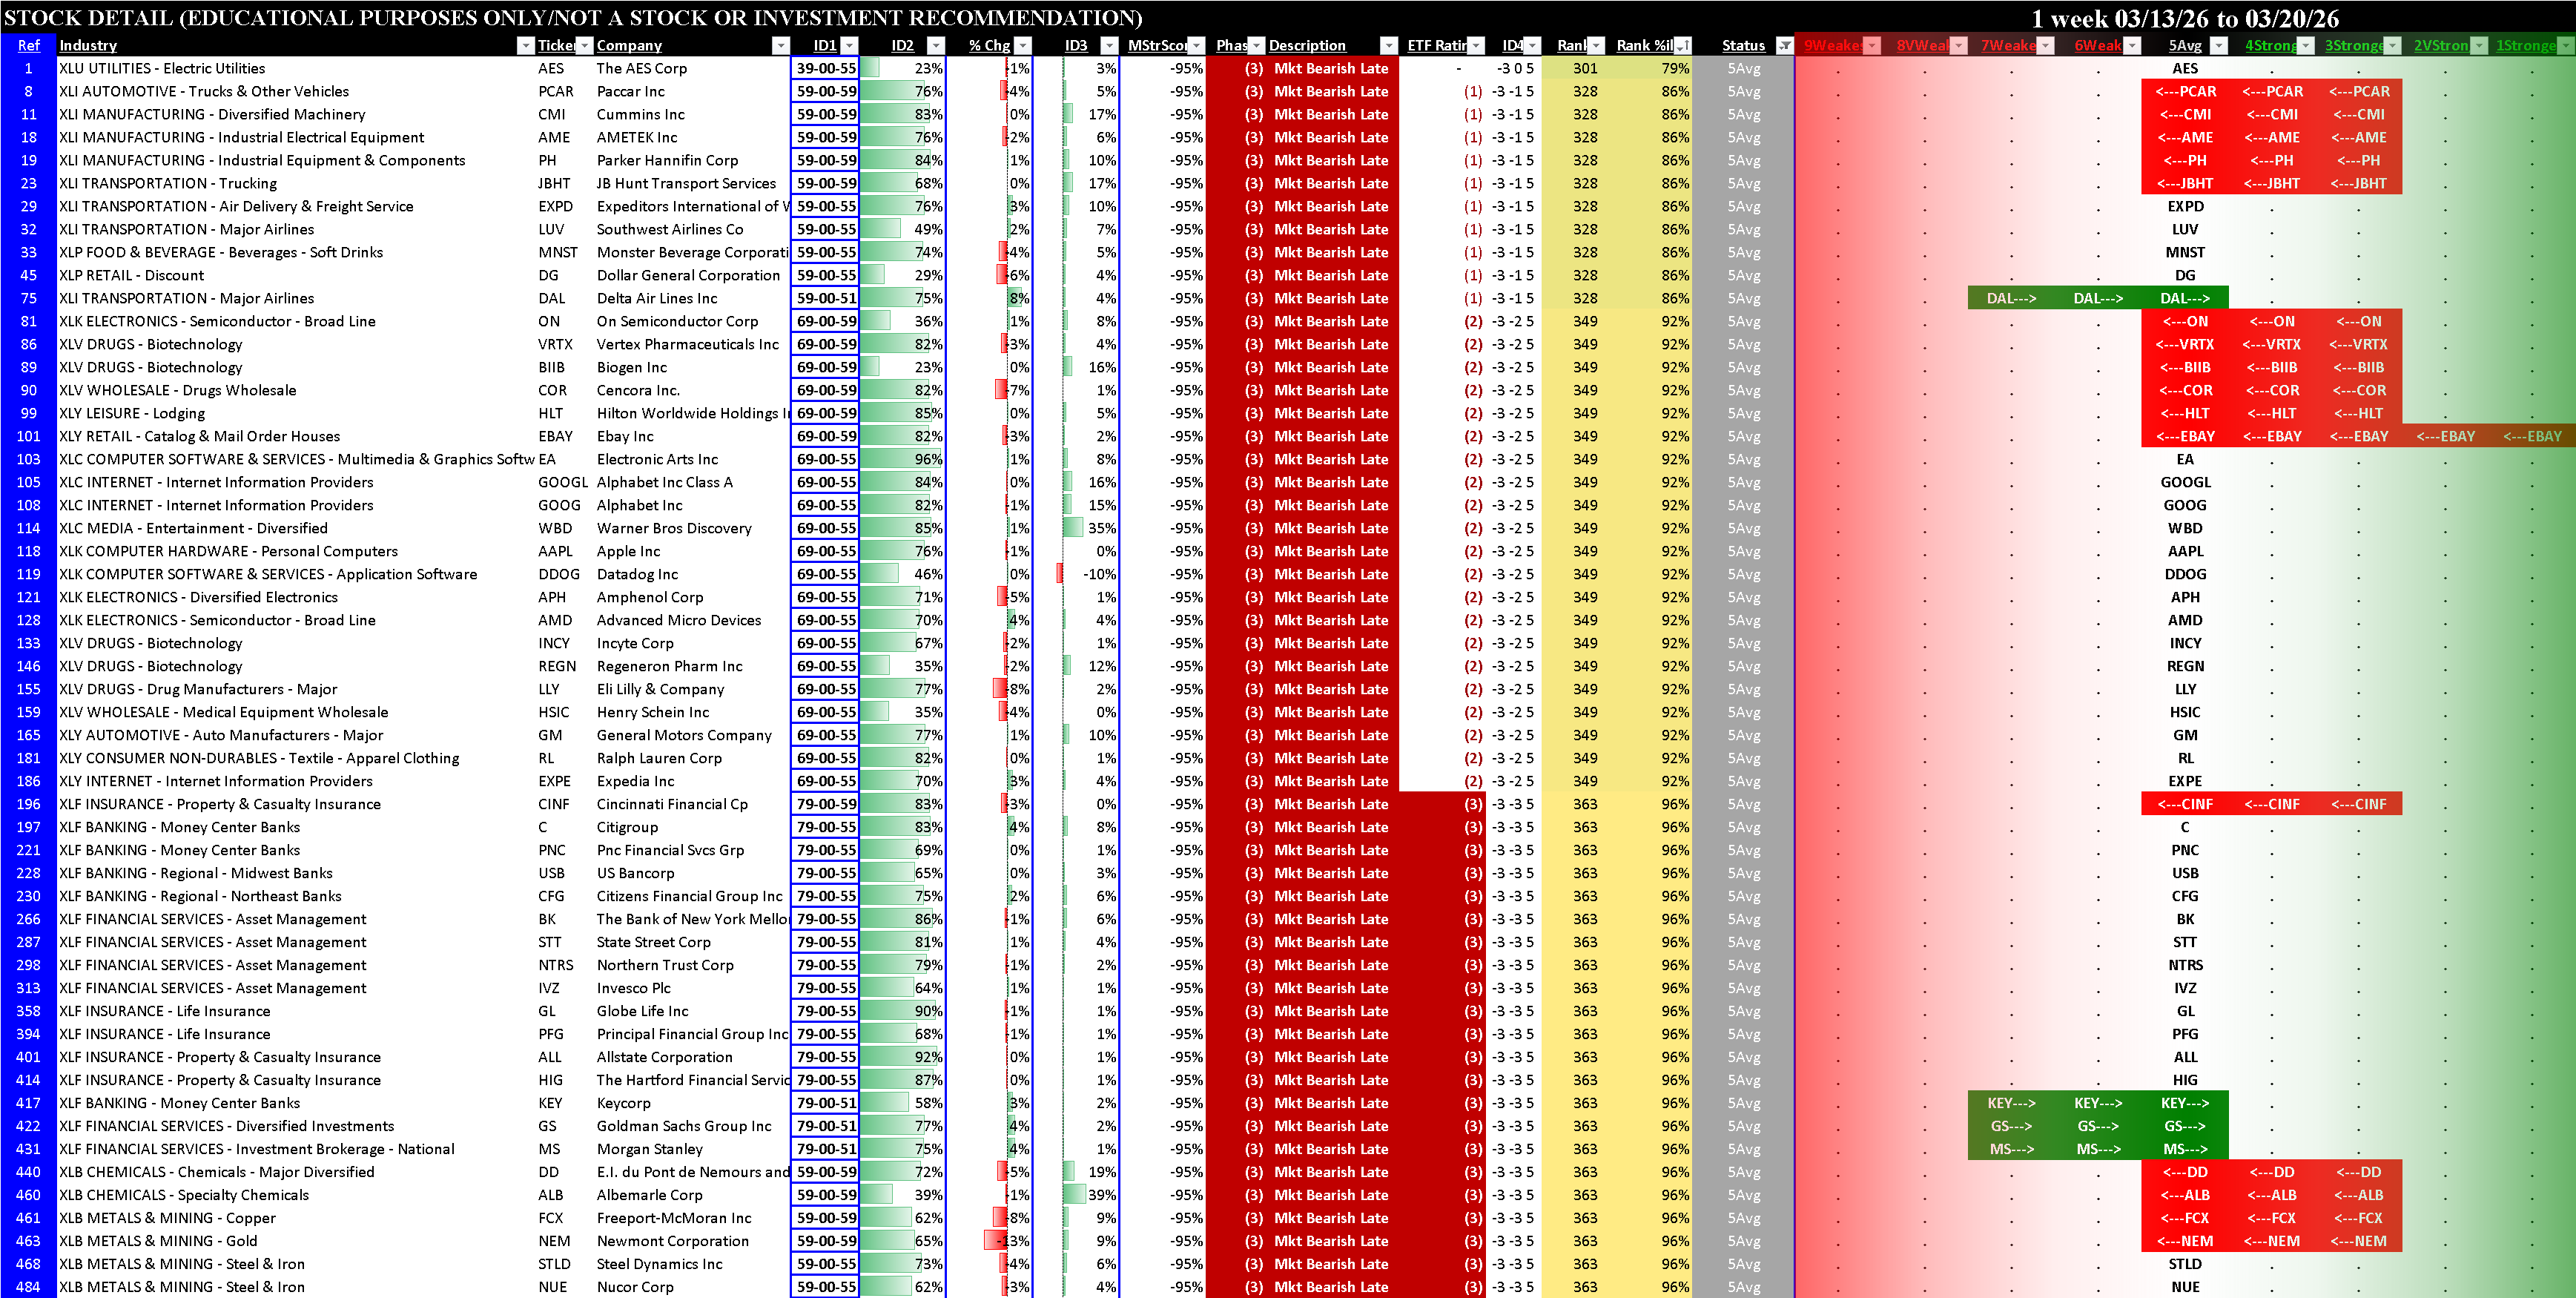
Sector ETFs Stocks Rated 1Strongest and 9Weakest
Long and short candidates are listed below, ranked based on market, sector, and stock strength characteristics. As a bonus, the bottom table shows 5Average stocks, for possible volatility-related strategies.