SMO Dashboard Fri 2026-03-13 (Market = Bearish Advanced Phase)

TLDR:
This dashboard uncovers strength and weakness at the market, sector, industry, sub-industry, and stock levels to aid decision-making in the prevailing market environment.
Commentary
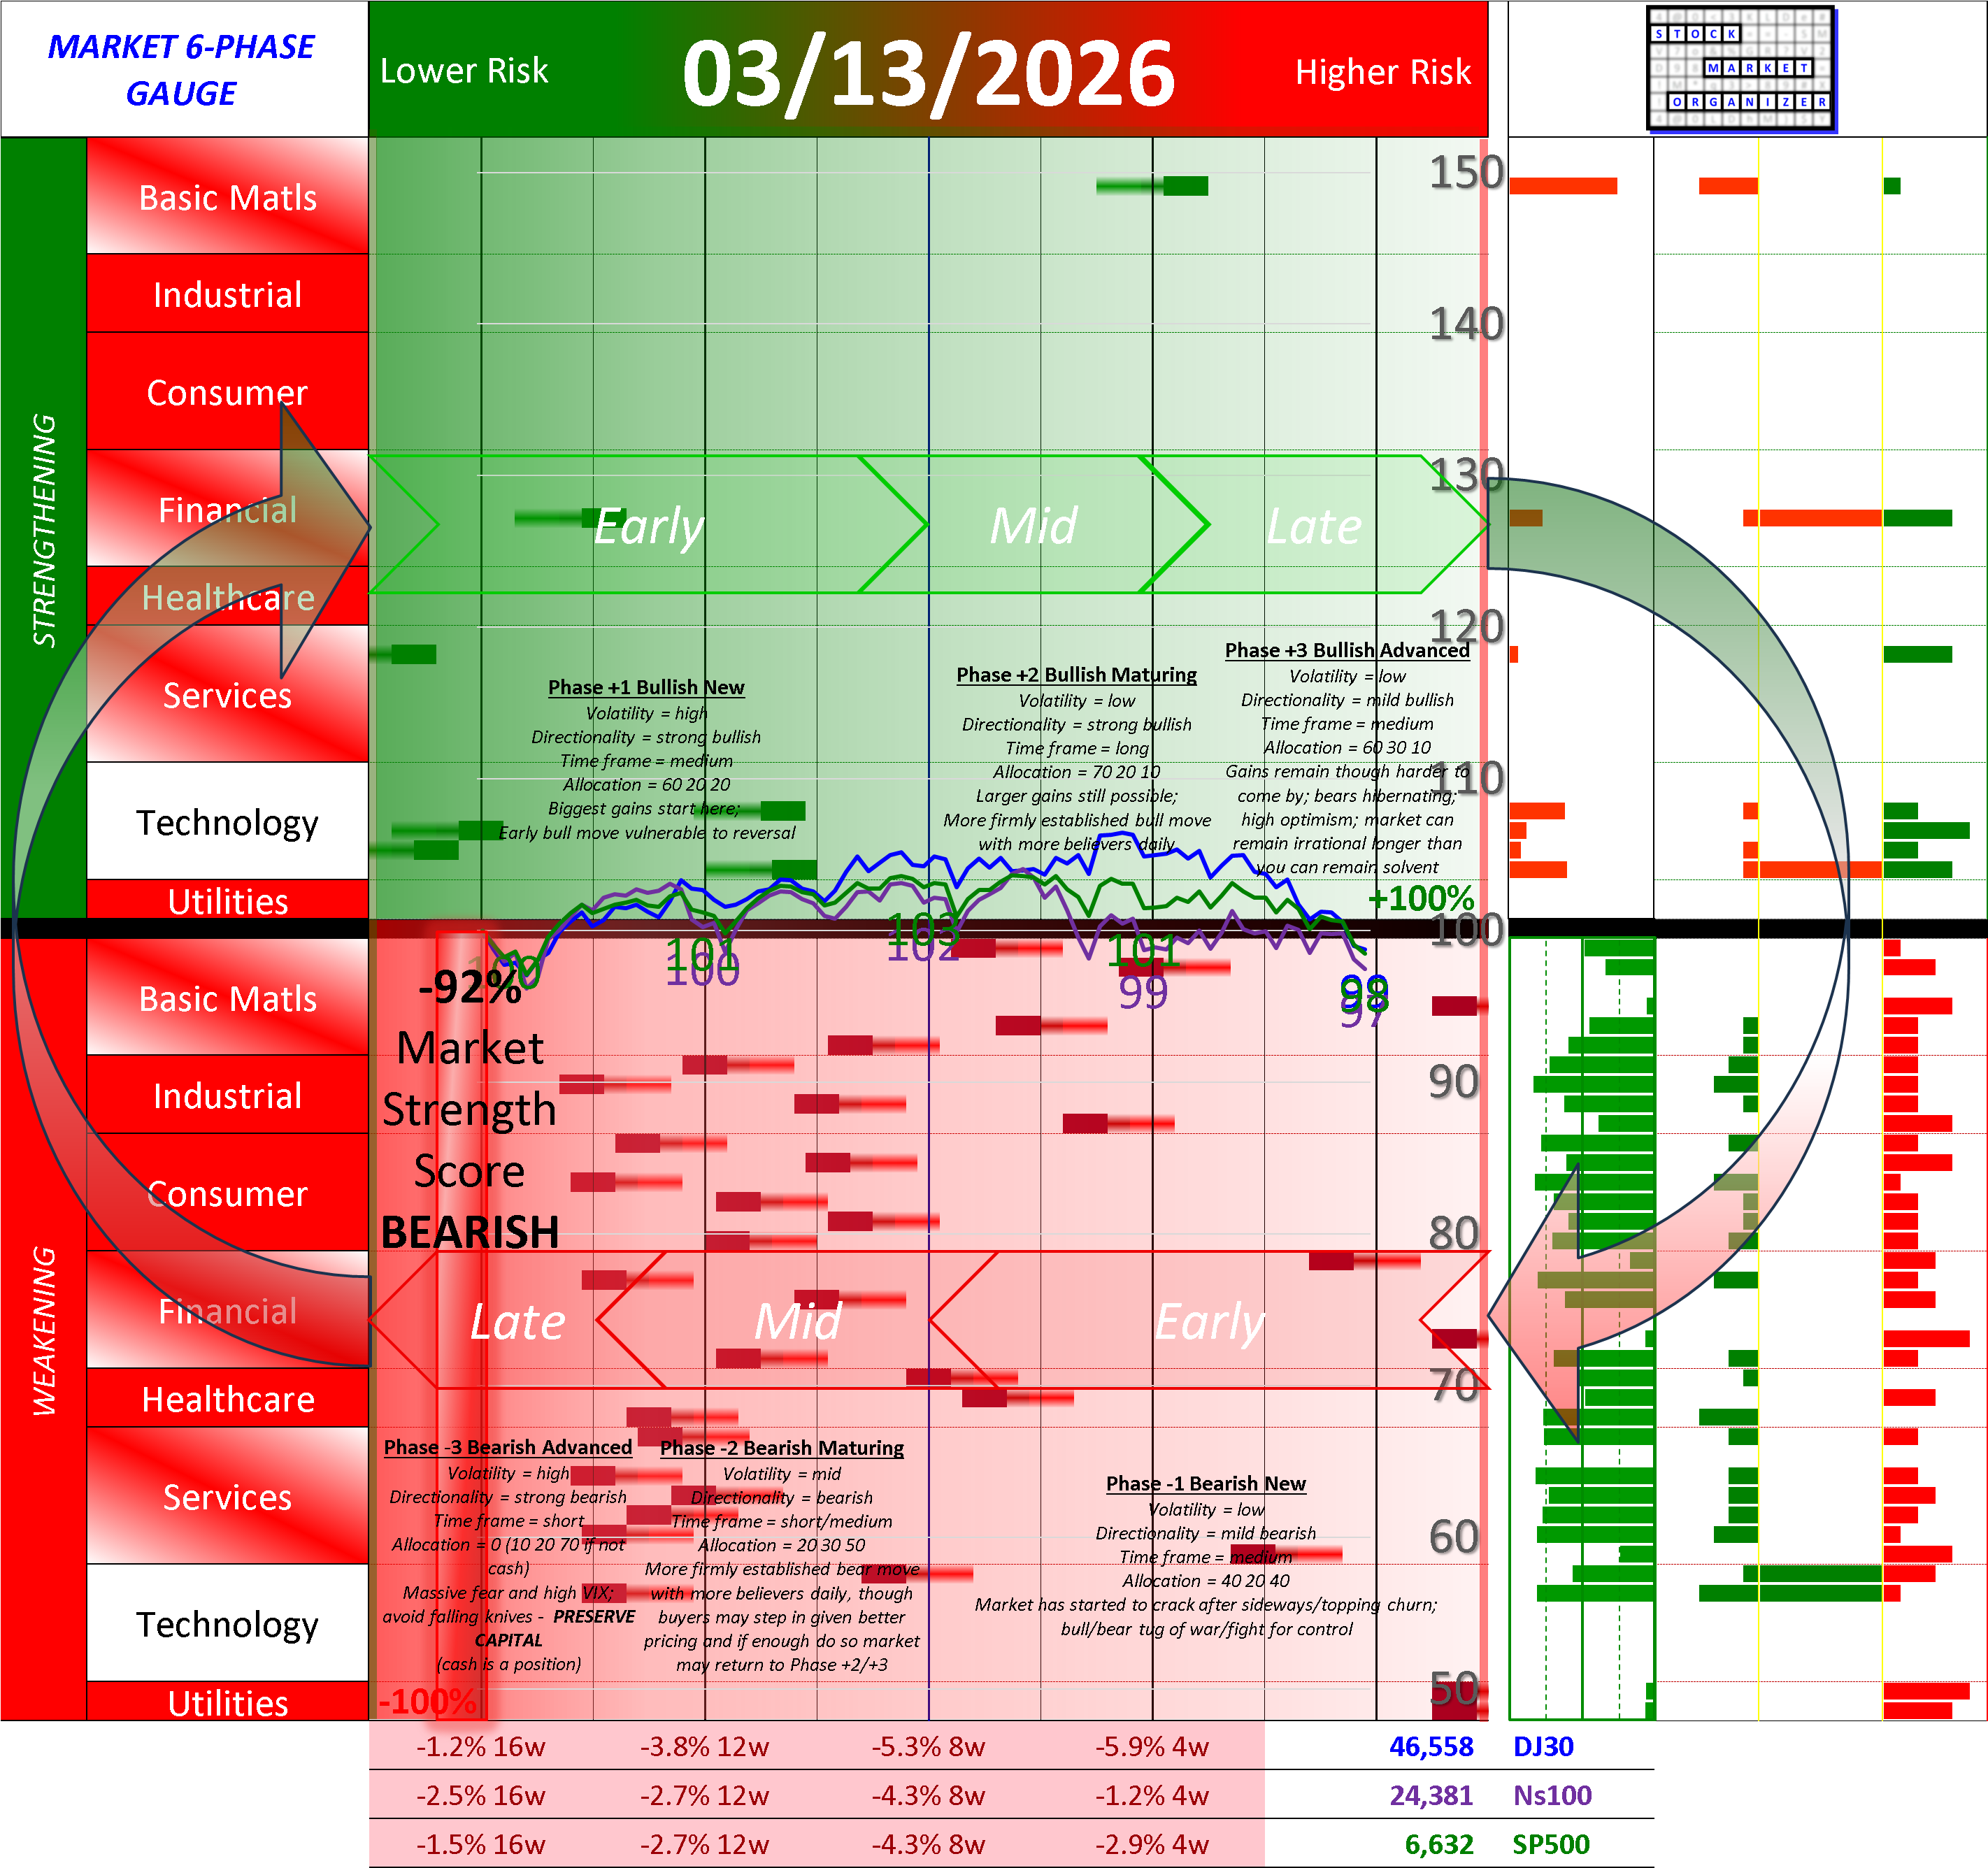
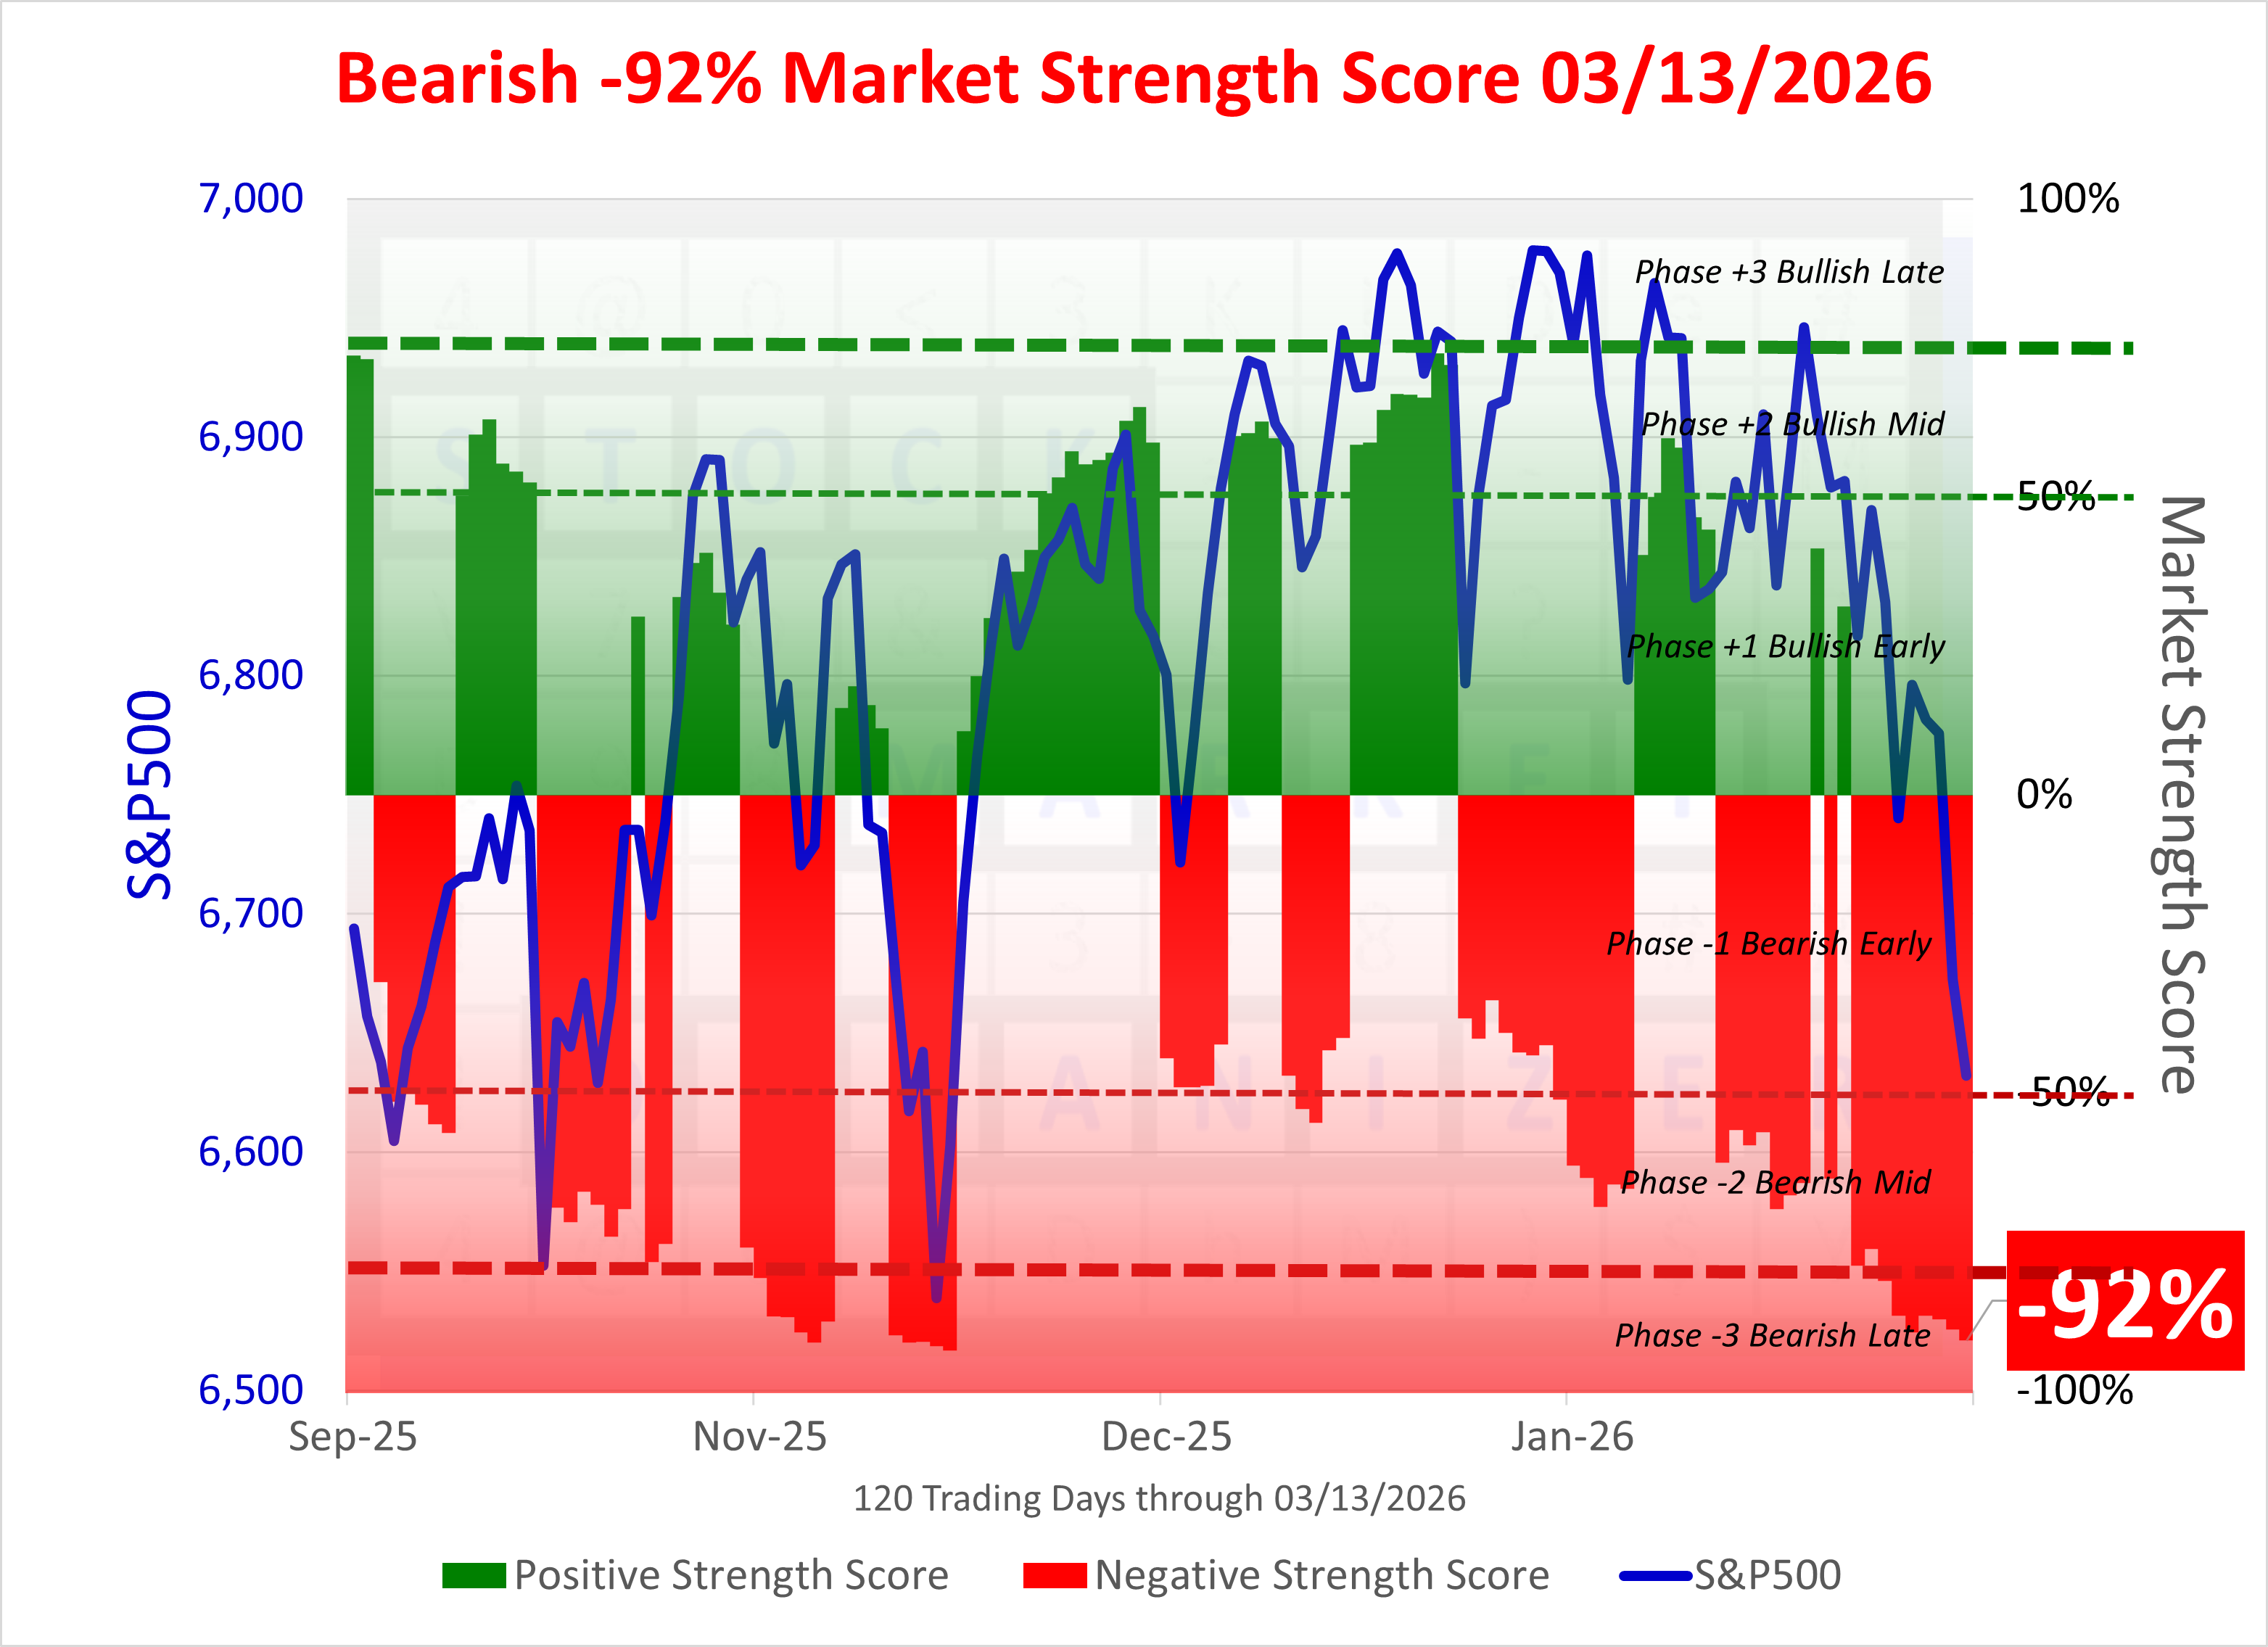
The Market Strength Score is currently advanced stage Bearish. Be cautious - this is high risk territory.
Tracked indexes performance this week:
- Strengthened/+1: None
- Strengthened/0: None
- Unchanged: None
- Weakened/0 SP500 (5Average), NDX (5Average), SOX (4Strong), MAG7 (6Weak)
- Weakened/-1: None
The dashboard is widespread red. Technology showing life, far from "all clear" but compared to the red elsewhere on this grid this area is looking relatively less dismal. As before, Financials are red while Real Estate is showing signs of life. Utilities have been strong and have now turned sour. Energy/Oil is mixed. Metals are weak.
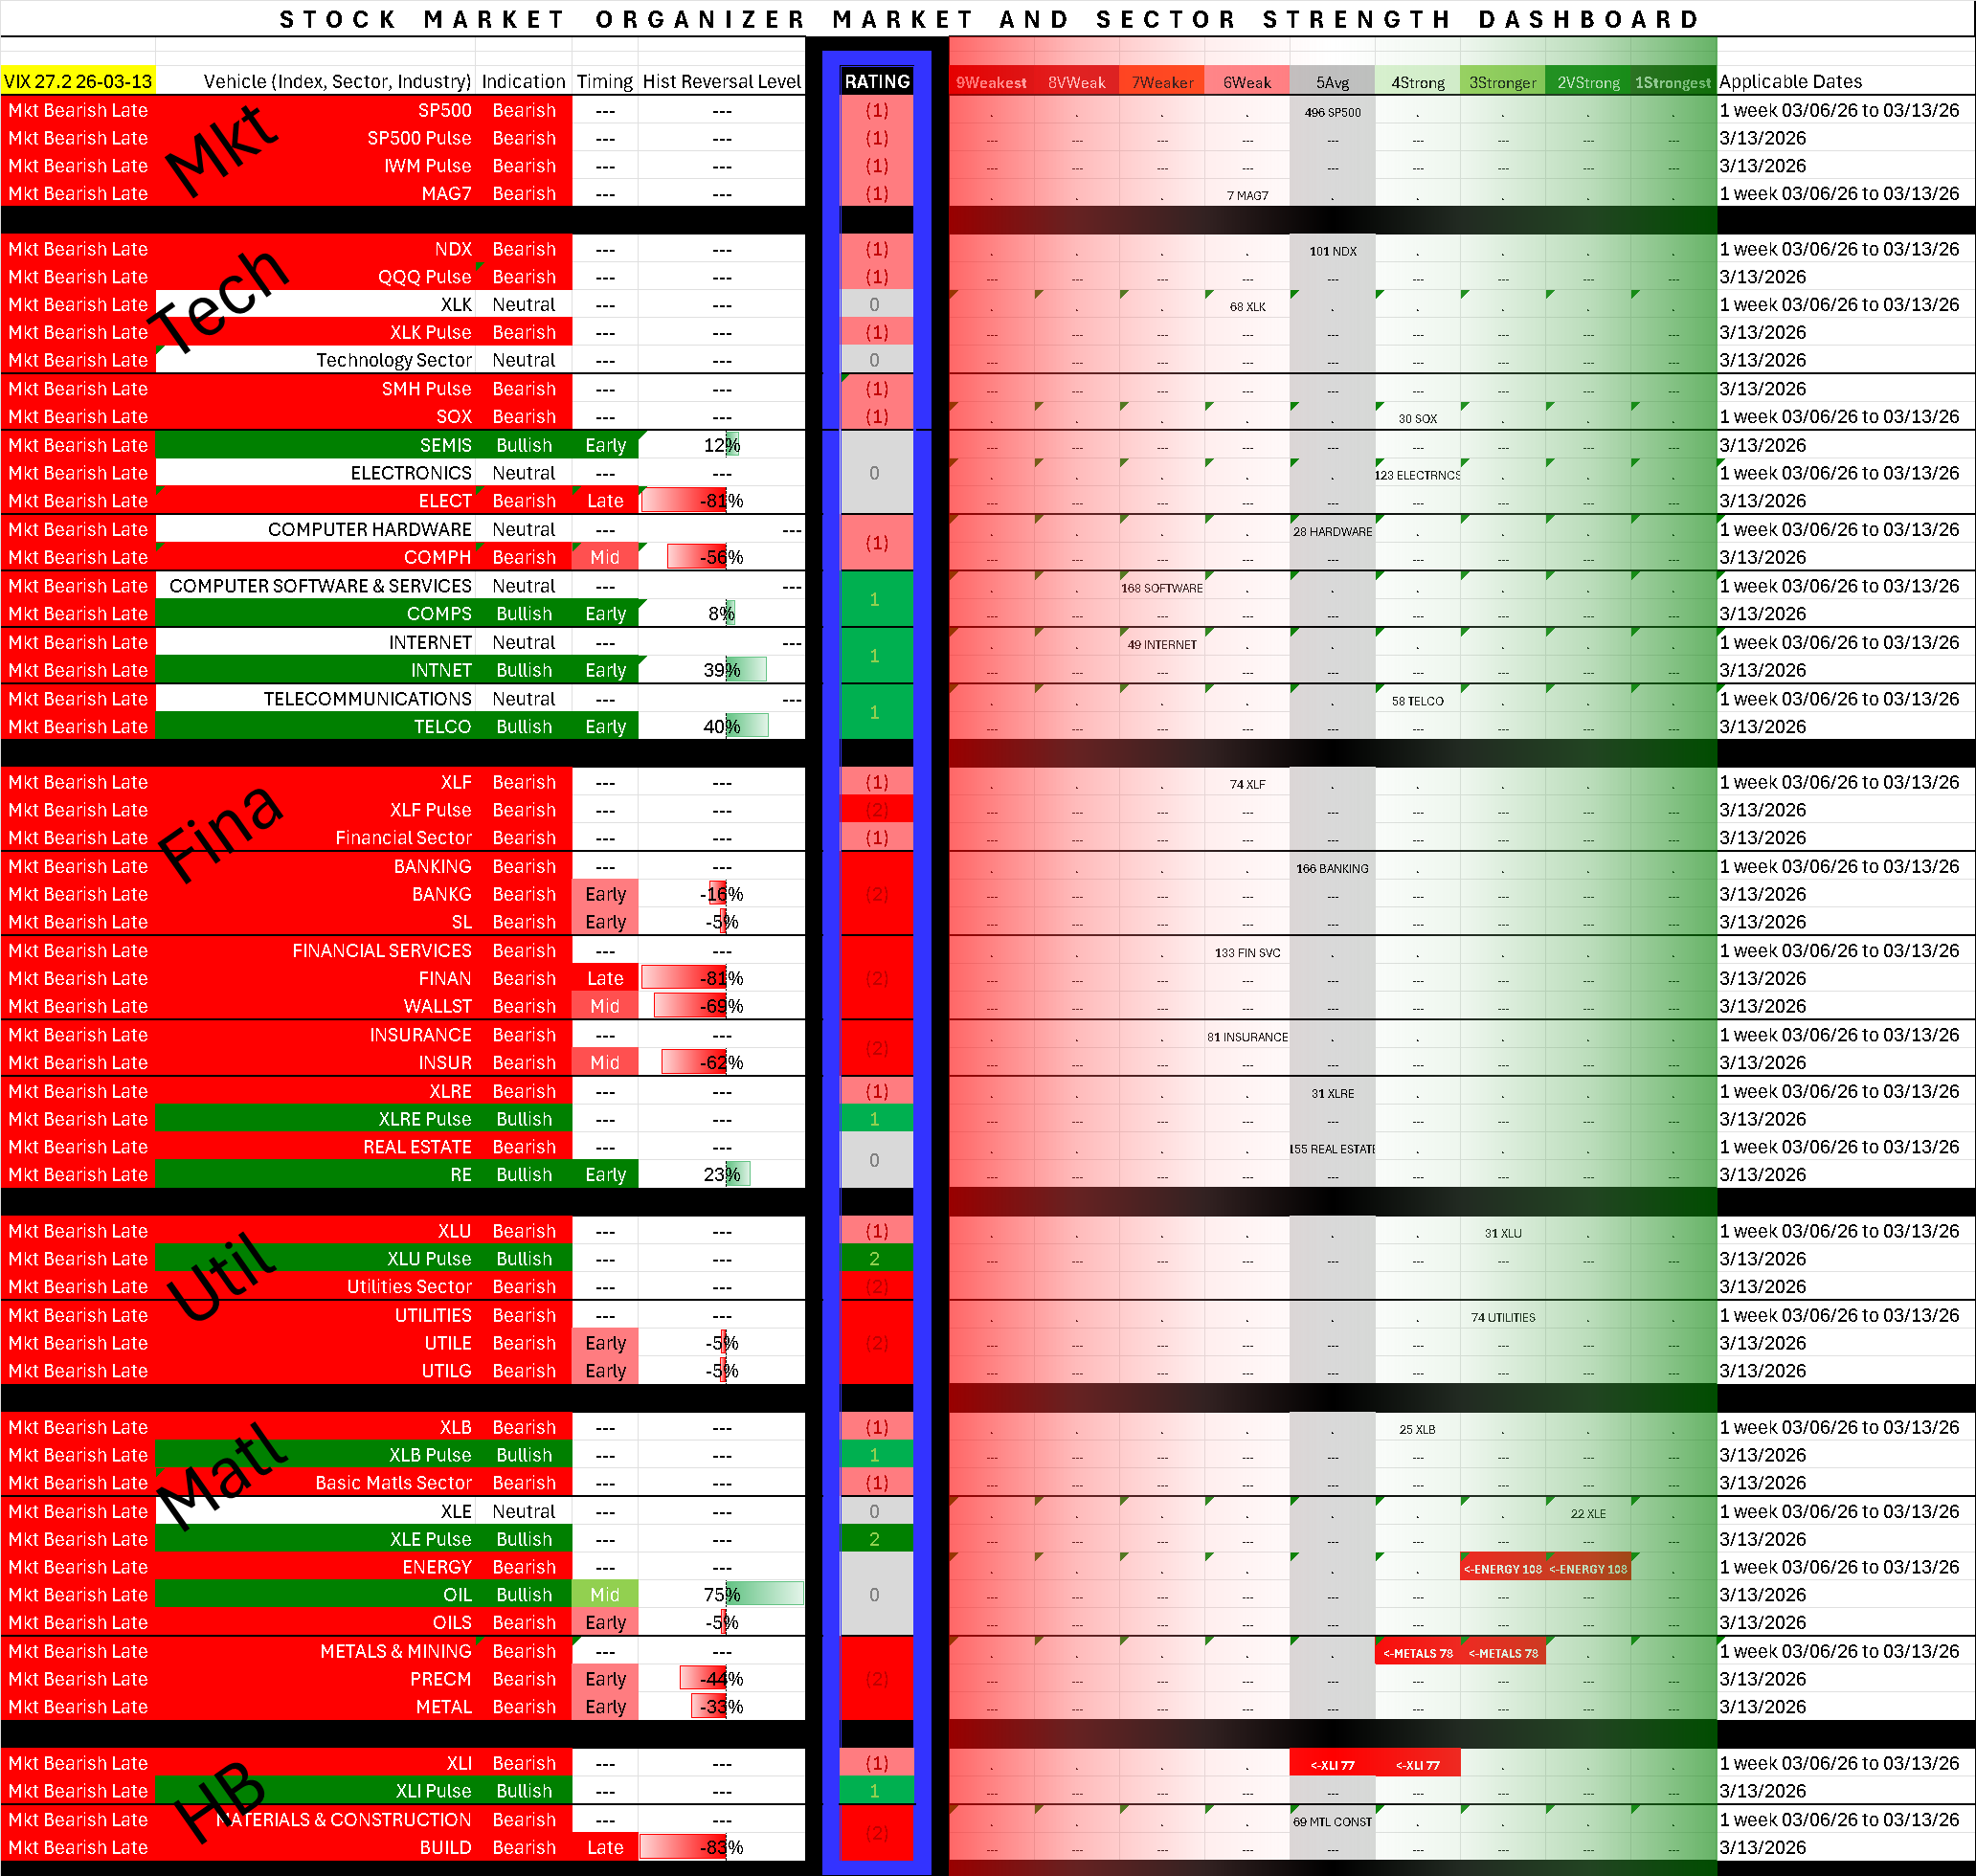
The column labeled "Rating" reflects the strength (based on this system's criteria) of the individual 92%, Phase -3 Bearish Advanced. Expect volatility with the possibility of a cascading decline, though be ready to turn positive even if the headlines seem dismal (see this post for an example of this concept).
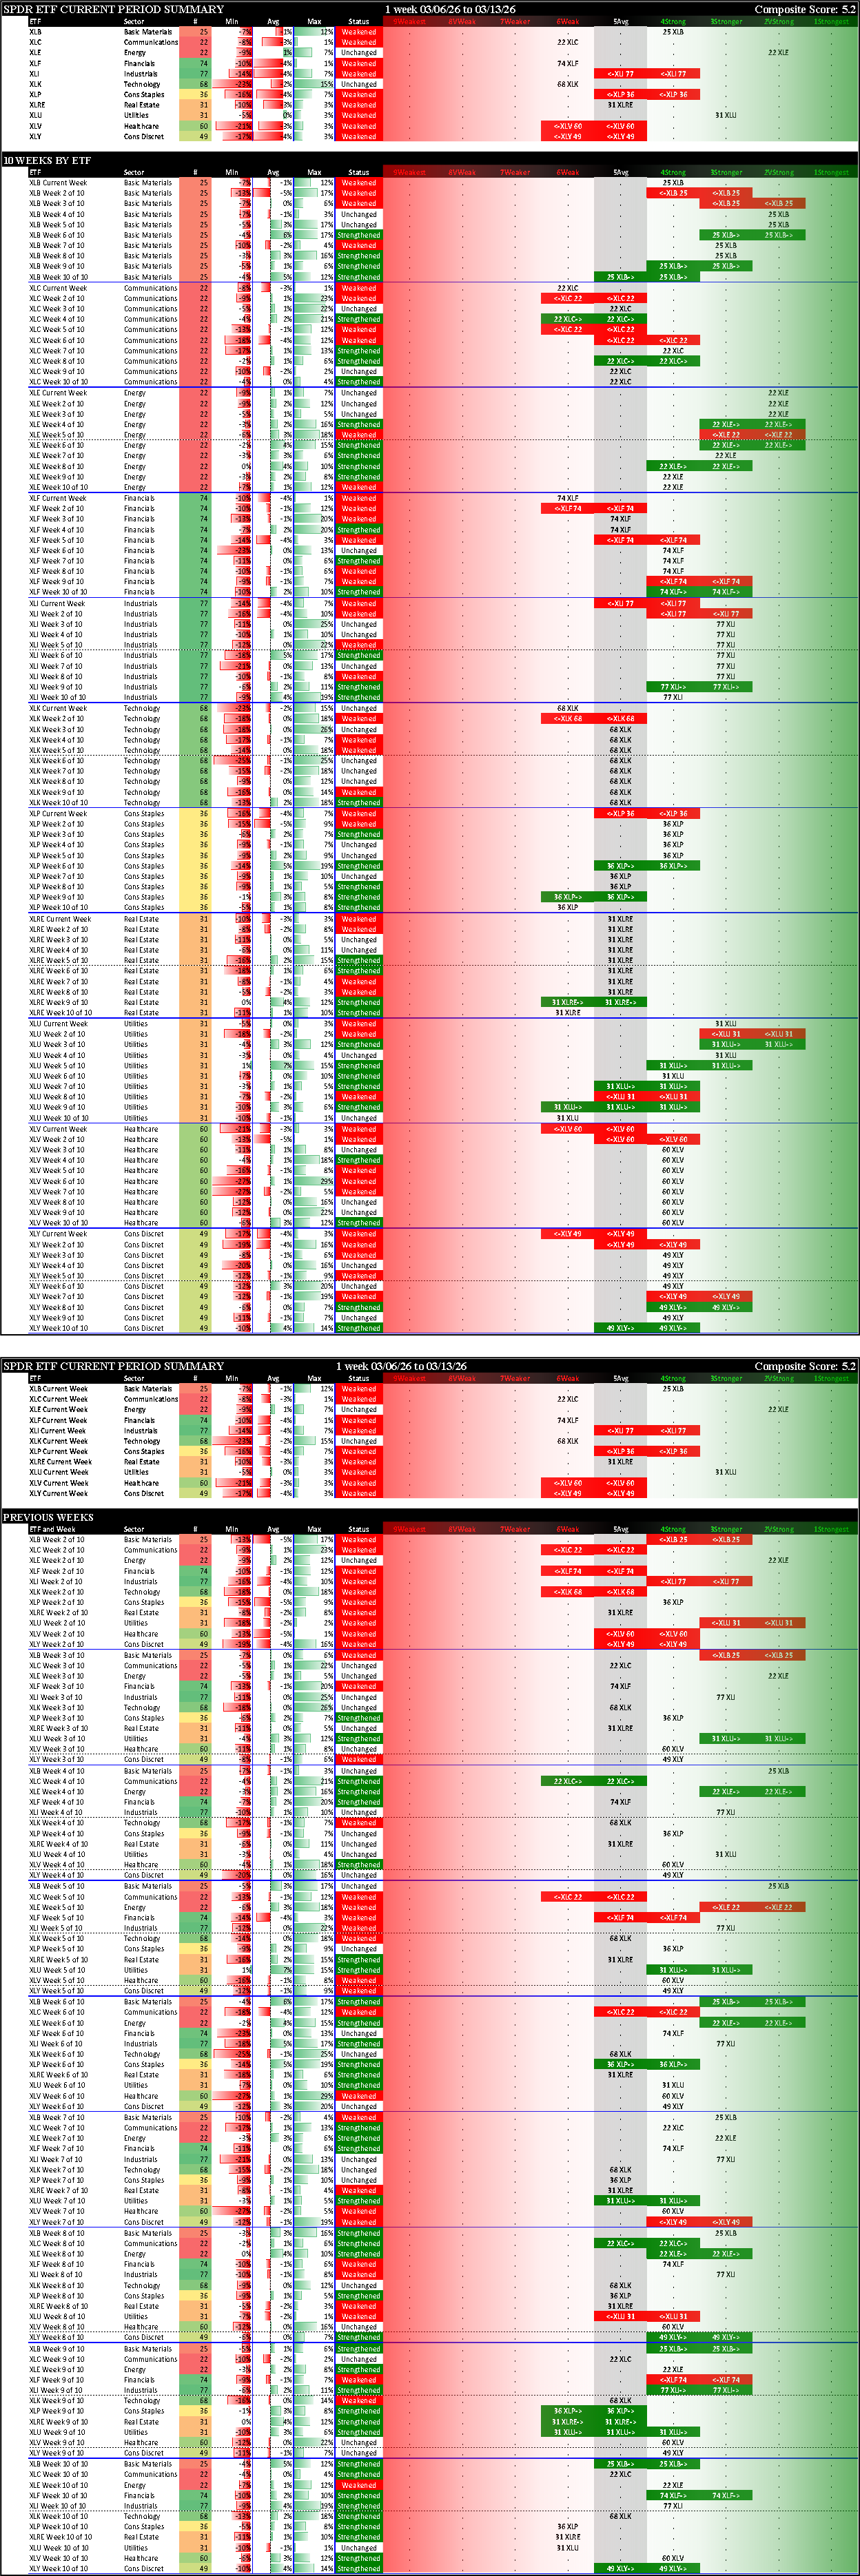
SPDR Sector ETFs Detail
Only XLE Energy was on the green side this week, XLB Materials and XLU Utilities are neutral.

Context - 10 Week Lookbacks, by ETF and by Week
XLE Energy is the only ETF that did not weaken and is the leader at 2Very Strong. XLC Communications, XLF Financials, and XLK Technology all weakened rating and are the weakest at 6Weak.
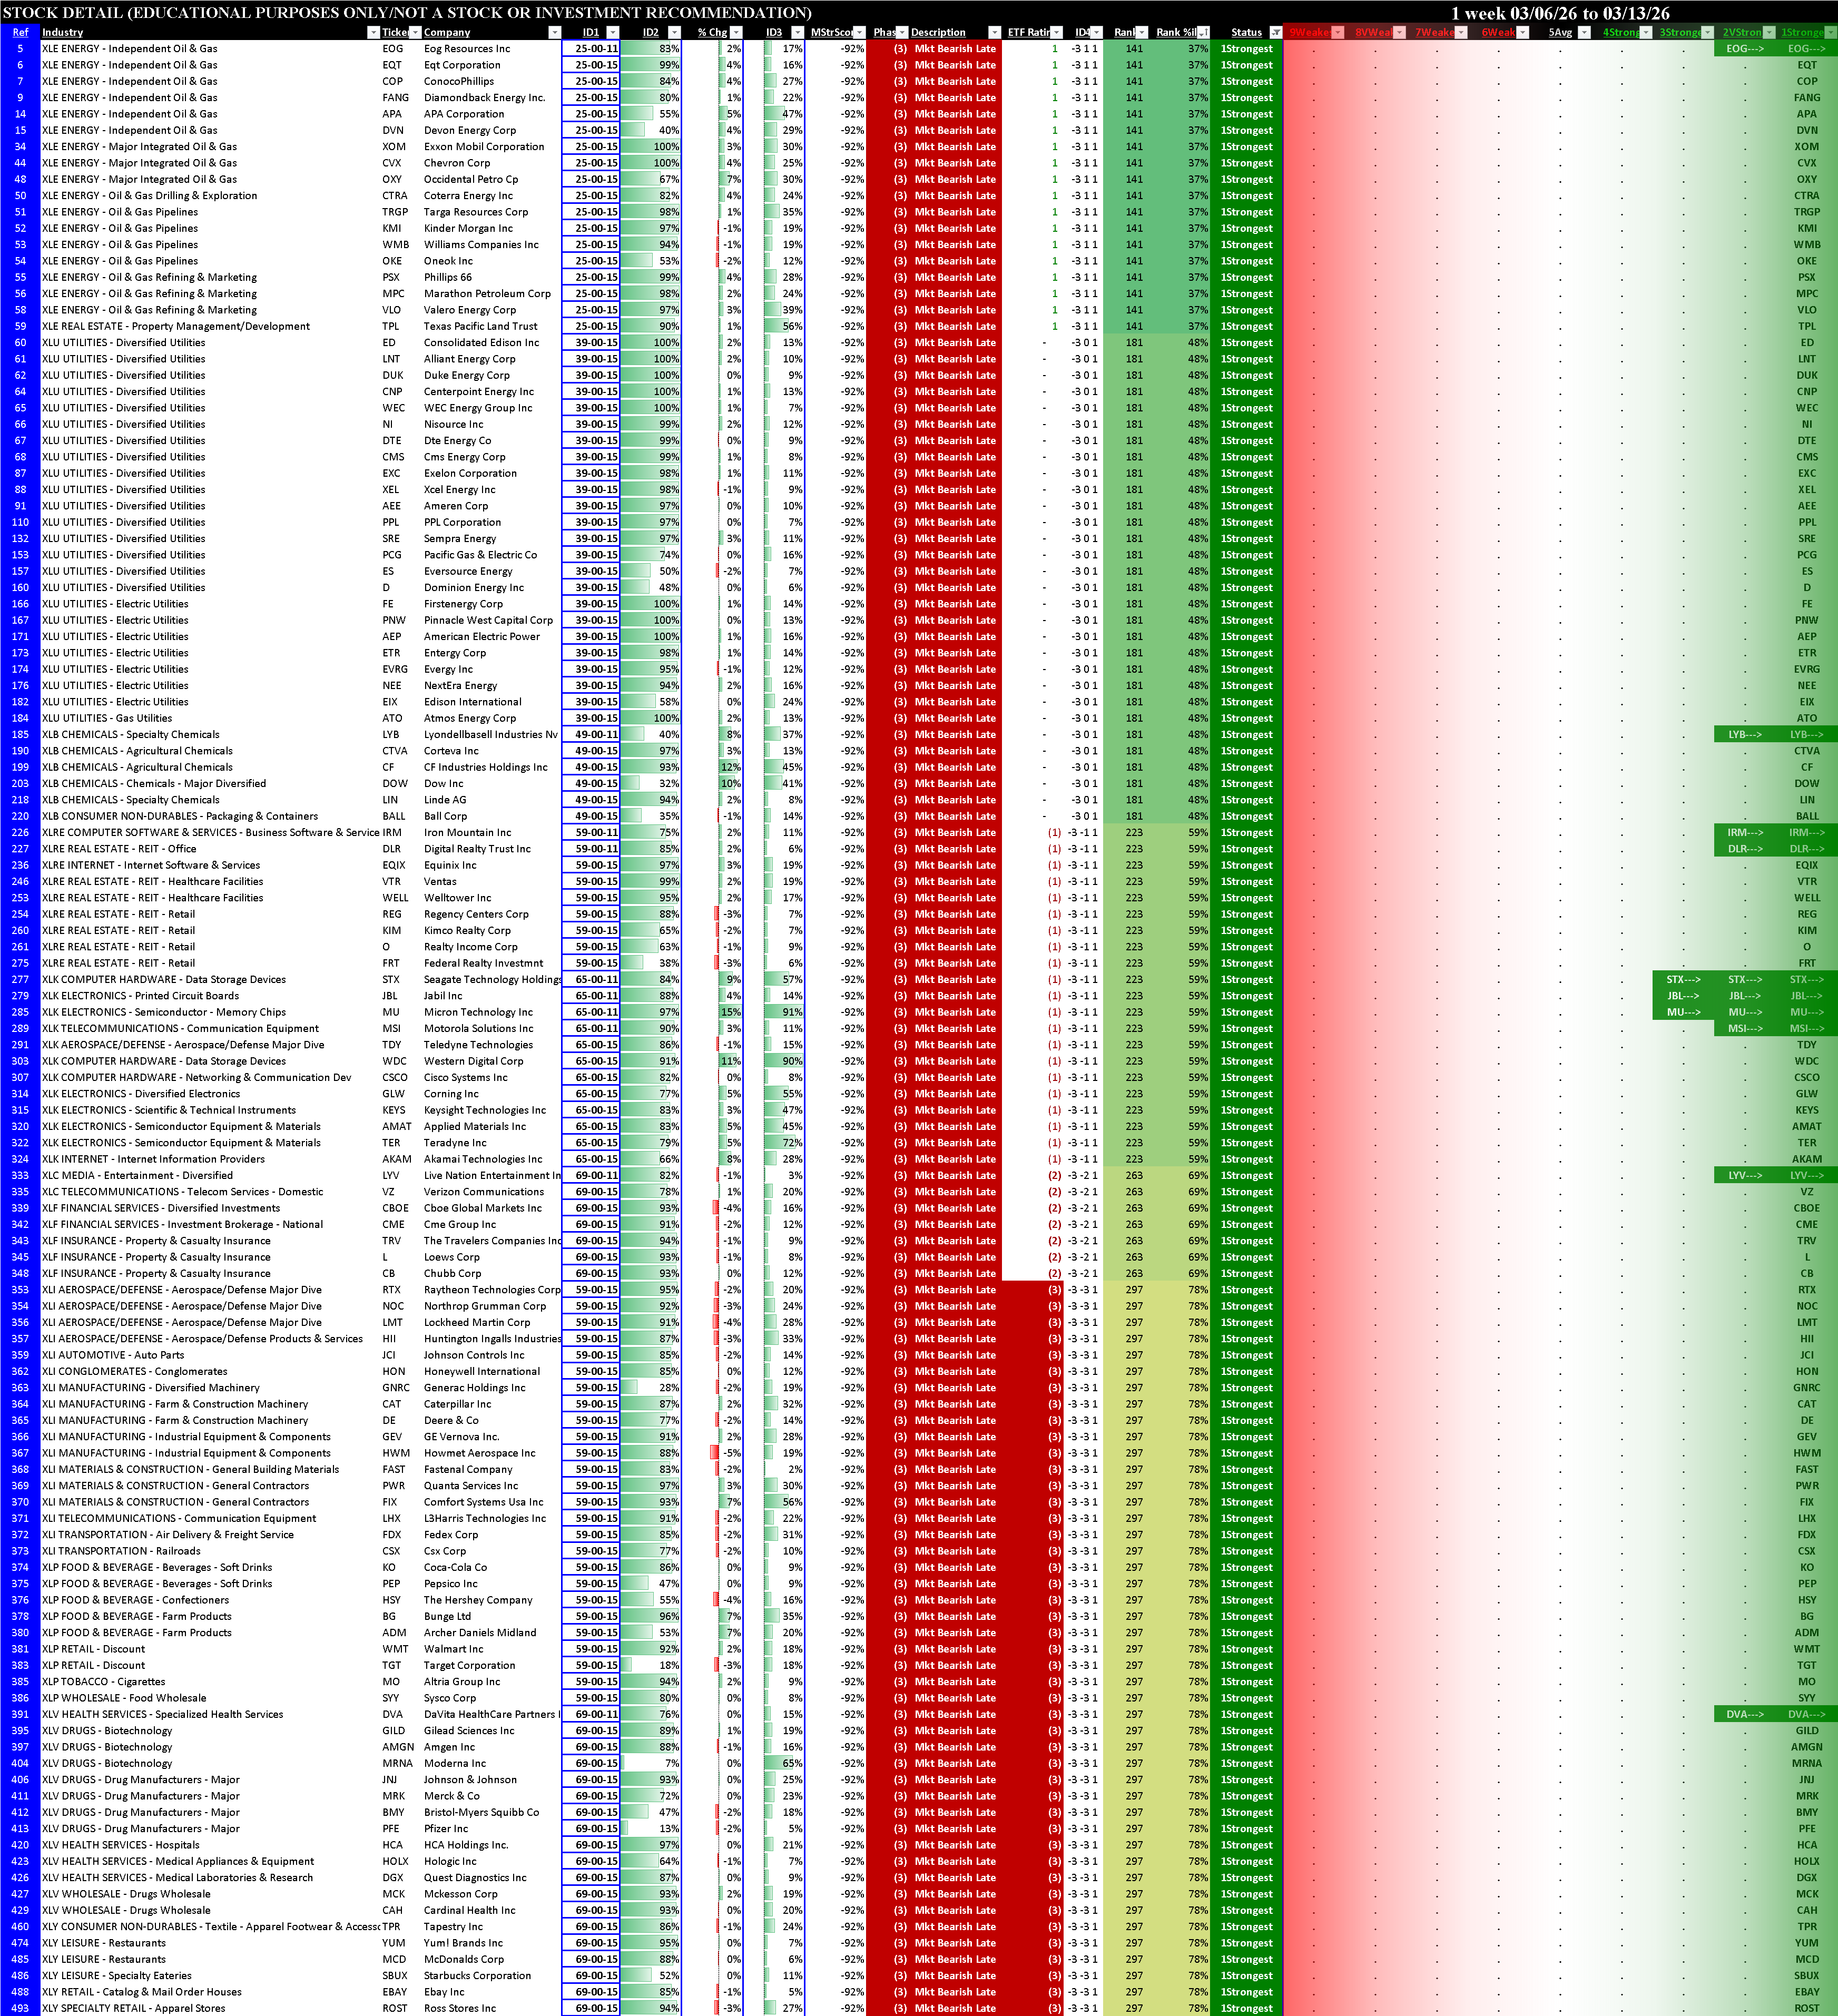
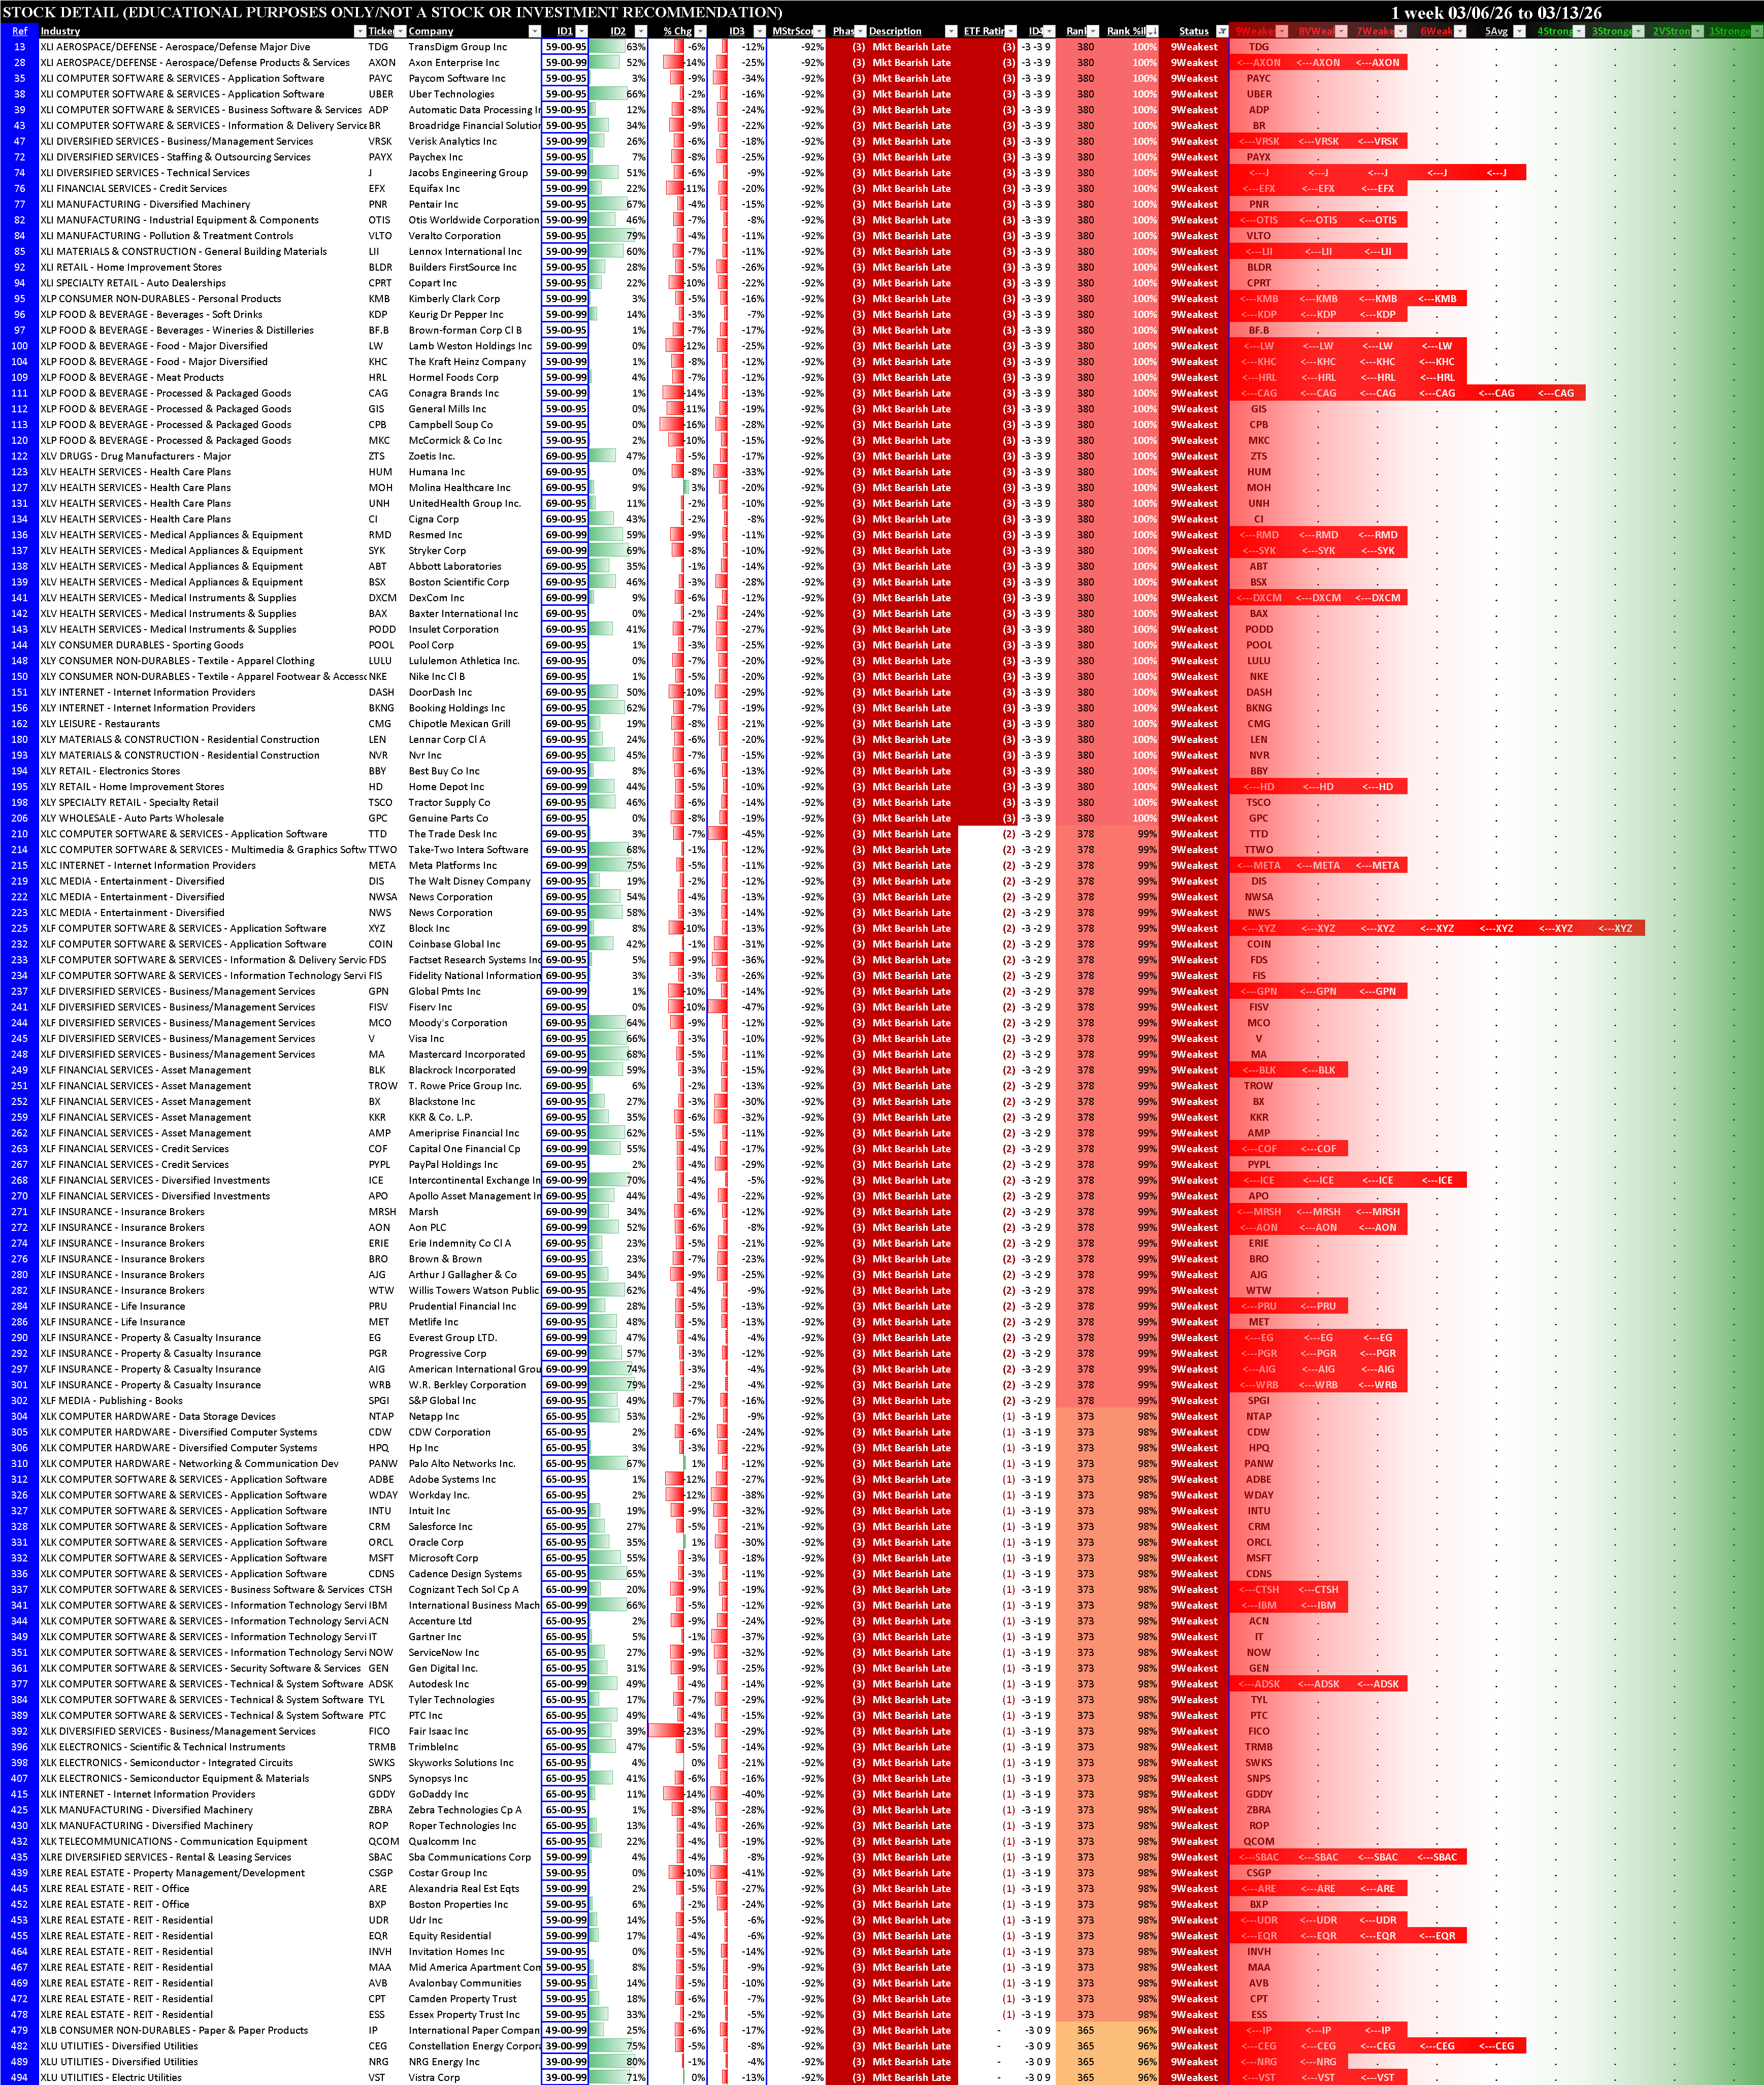
Sector ETFs Stocks Rated 1Strongest and 9Weakest
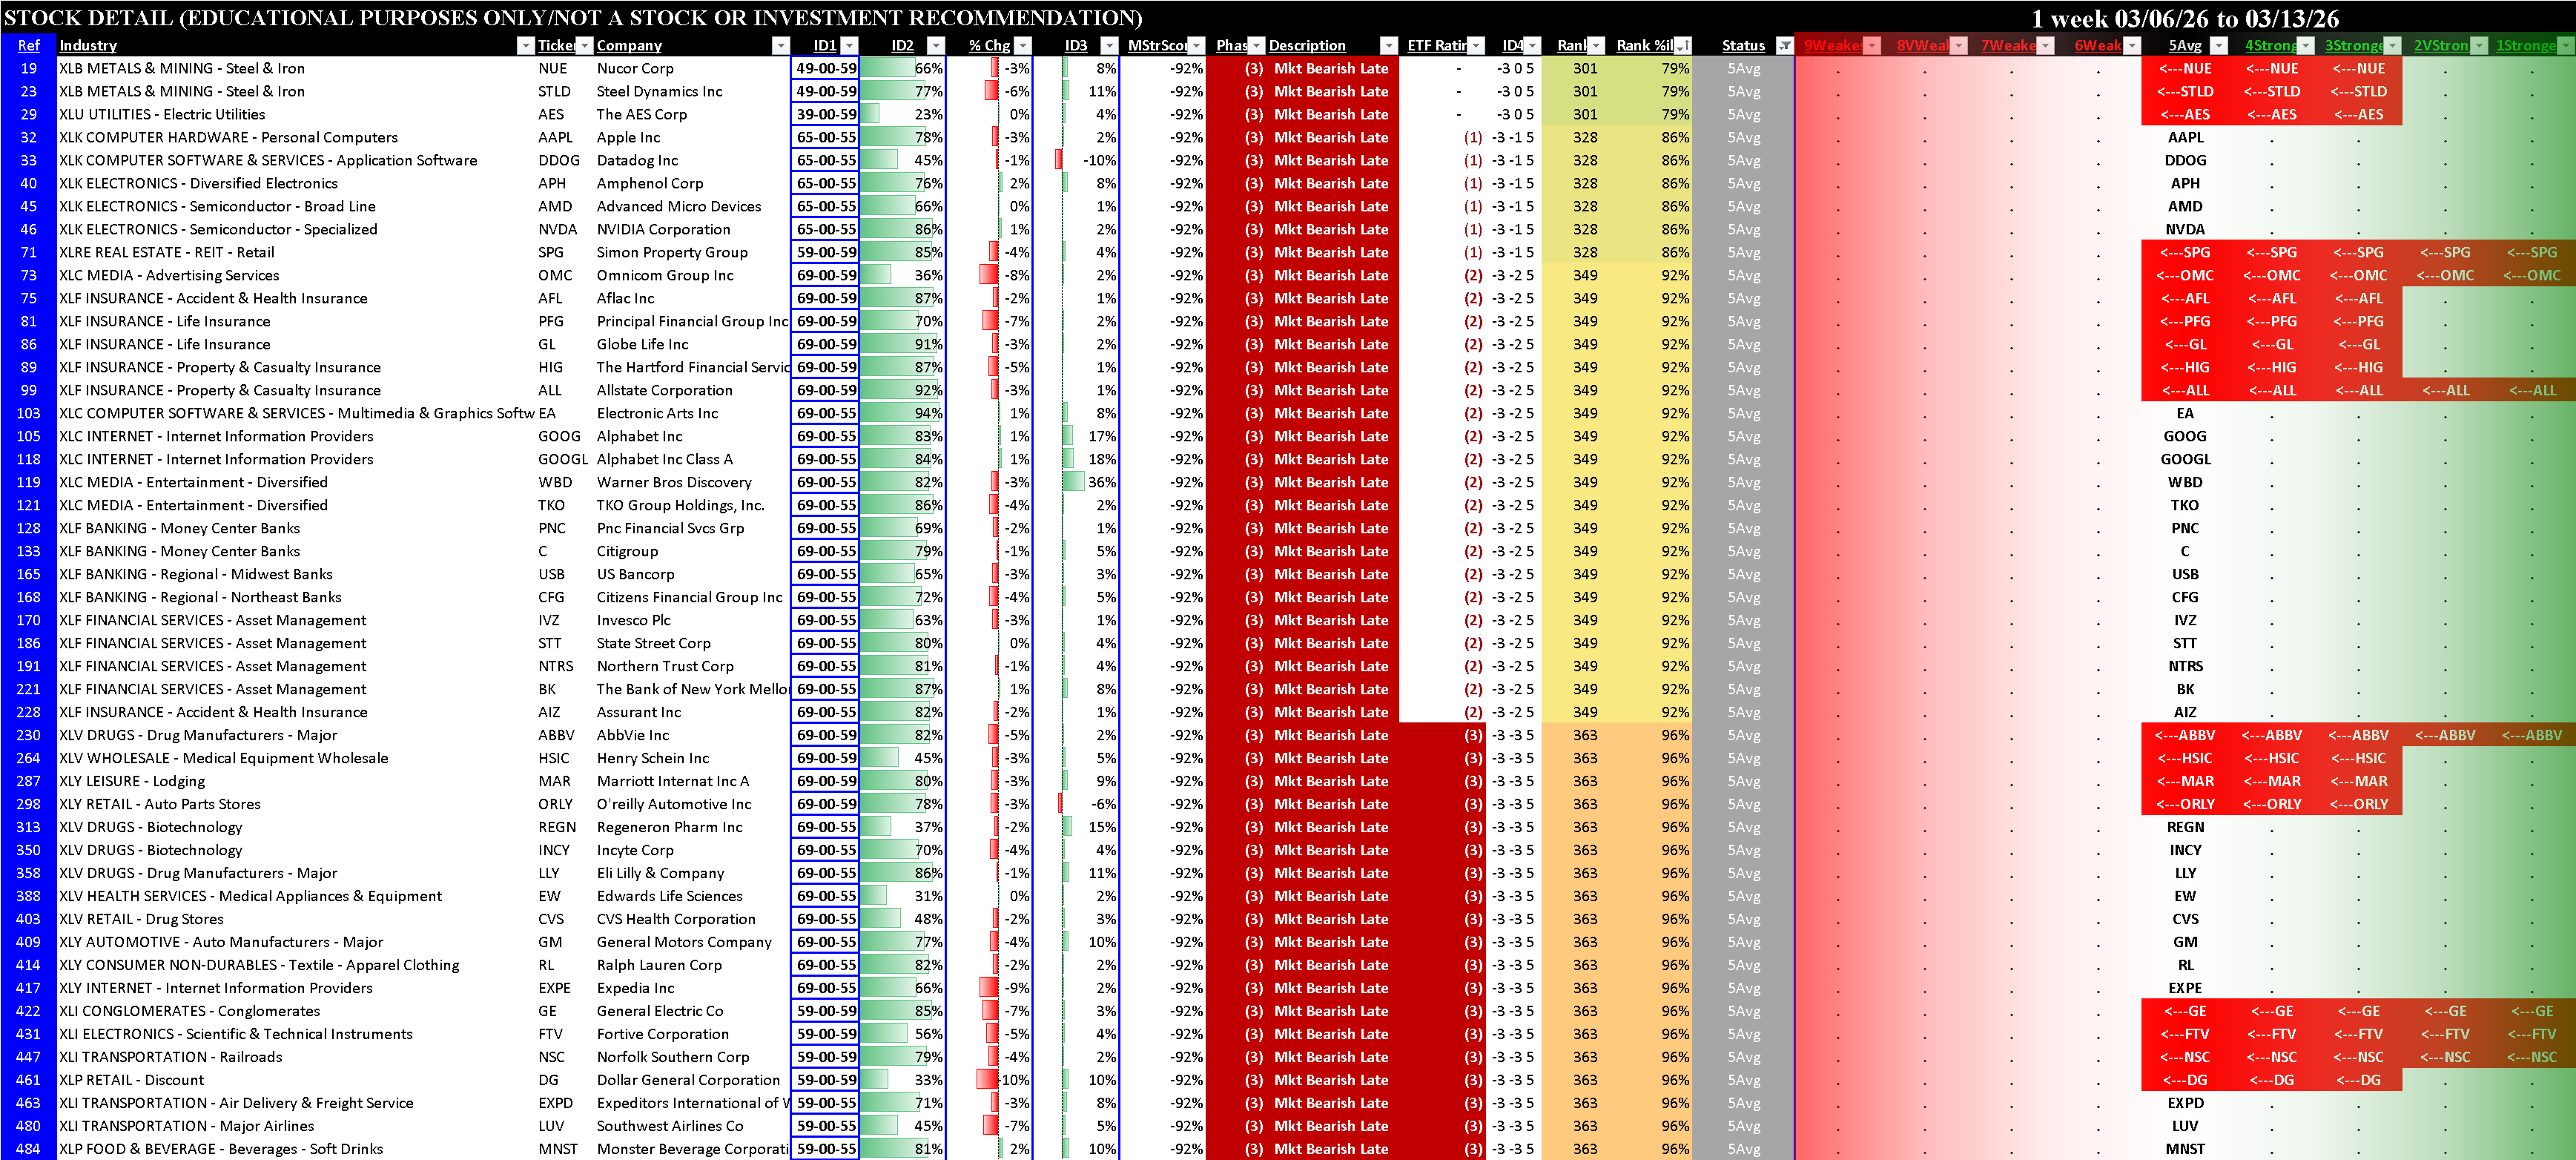
Long and short candidates are listed below, ranked based on market, sector, and stock strength characteristics. As a bonus, the bottom table shows 5Average stocks, for possible volatility-related strategies.