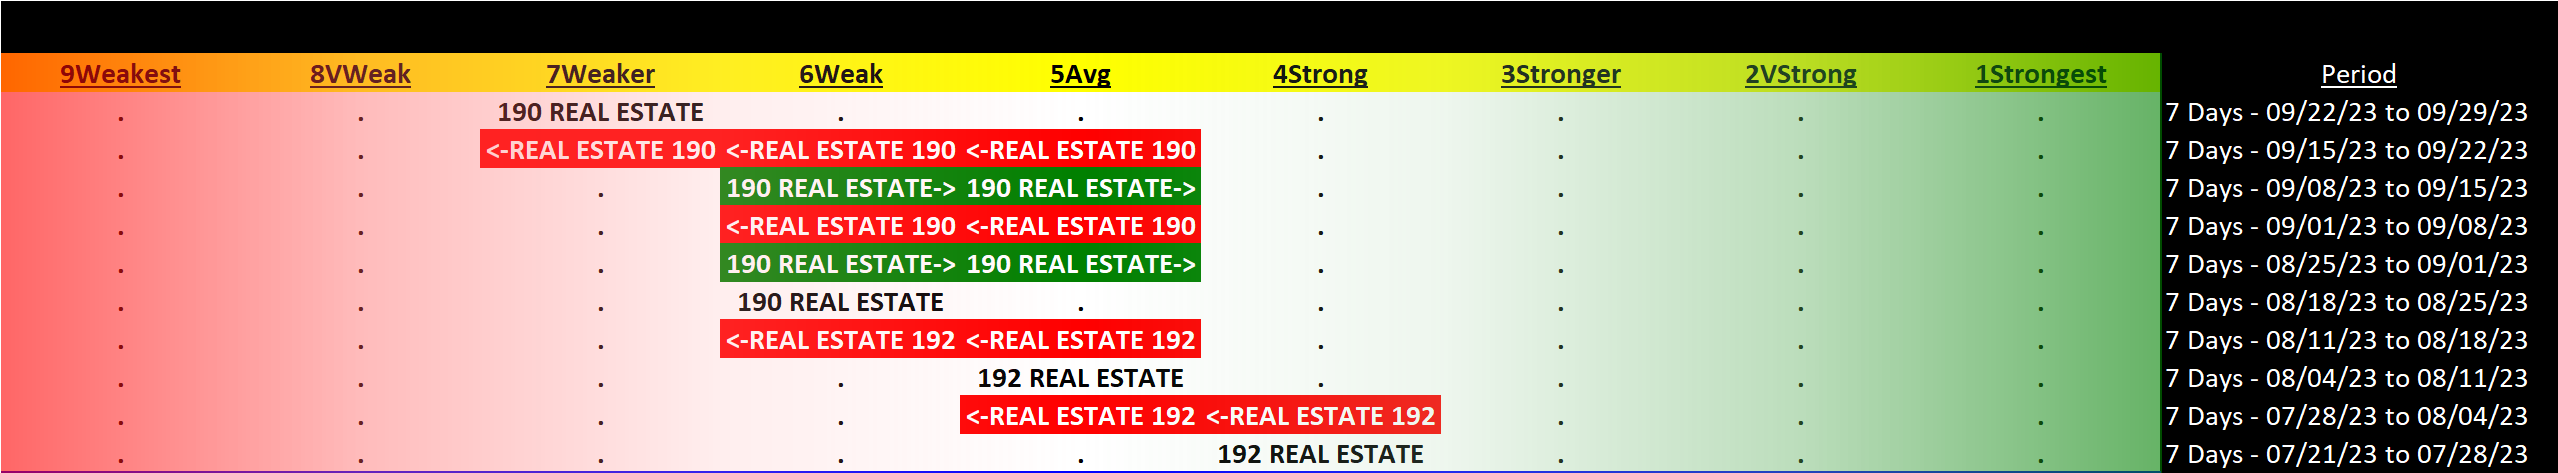
Real Estate 2023-09-29: Unchanged at WEAKER strength rating (7th strongest of 9 levels), previous move was DOWN
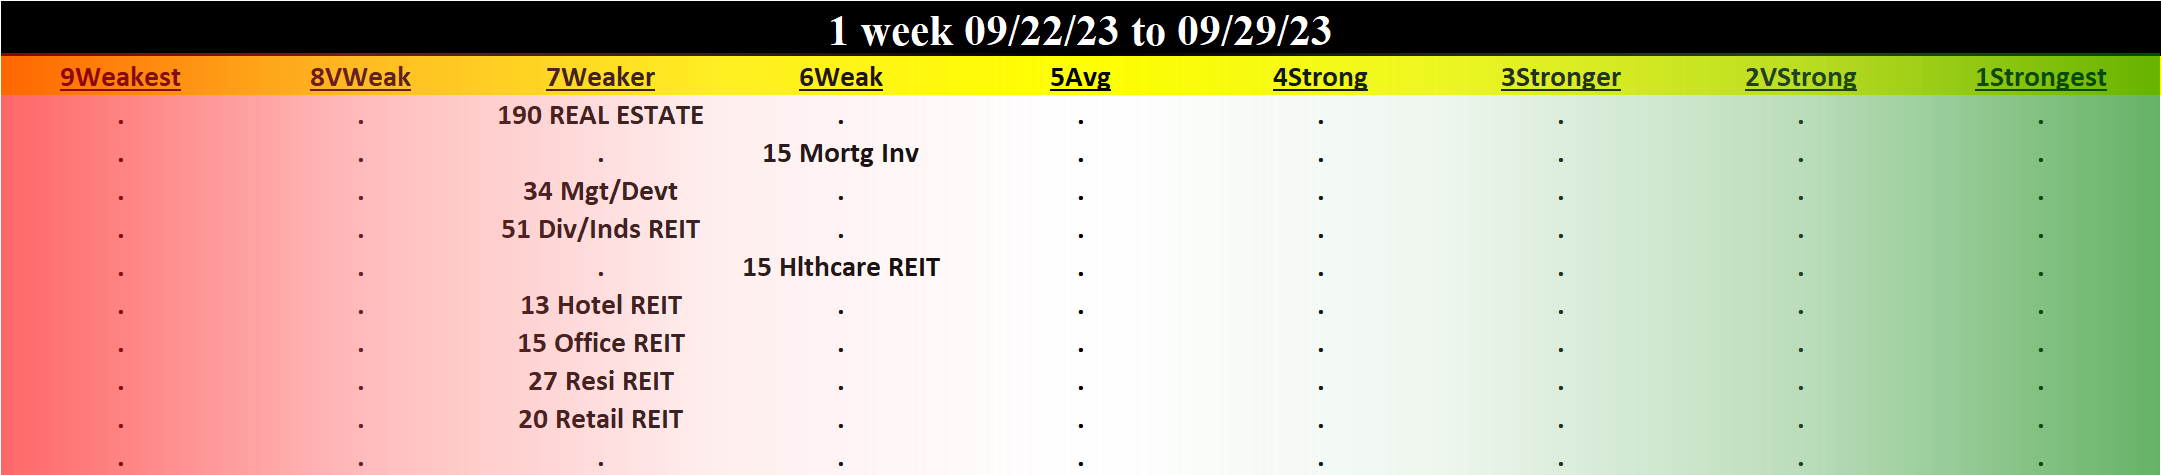
TABLE OF CONTENTS
- INDUSTRY OVERVIEW
1A. Performance
1B. Background - SUB-INDUSTRIES AND STOCKS DETAIL
2A. Sub-Industries Overview
2B. Sub-Industries 10-Week Strengthening Analysis
2C. Stocks 1 Week Strongest and Weakest - STRENGTH BY LOOKBACK PERIOD (with Best/Worst stocks)
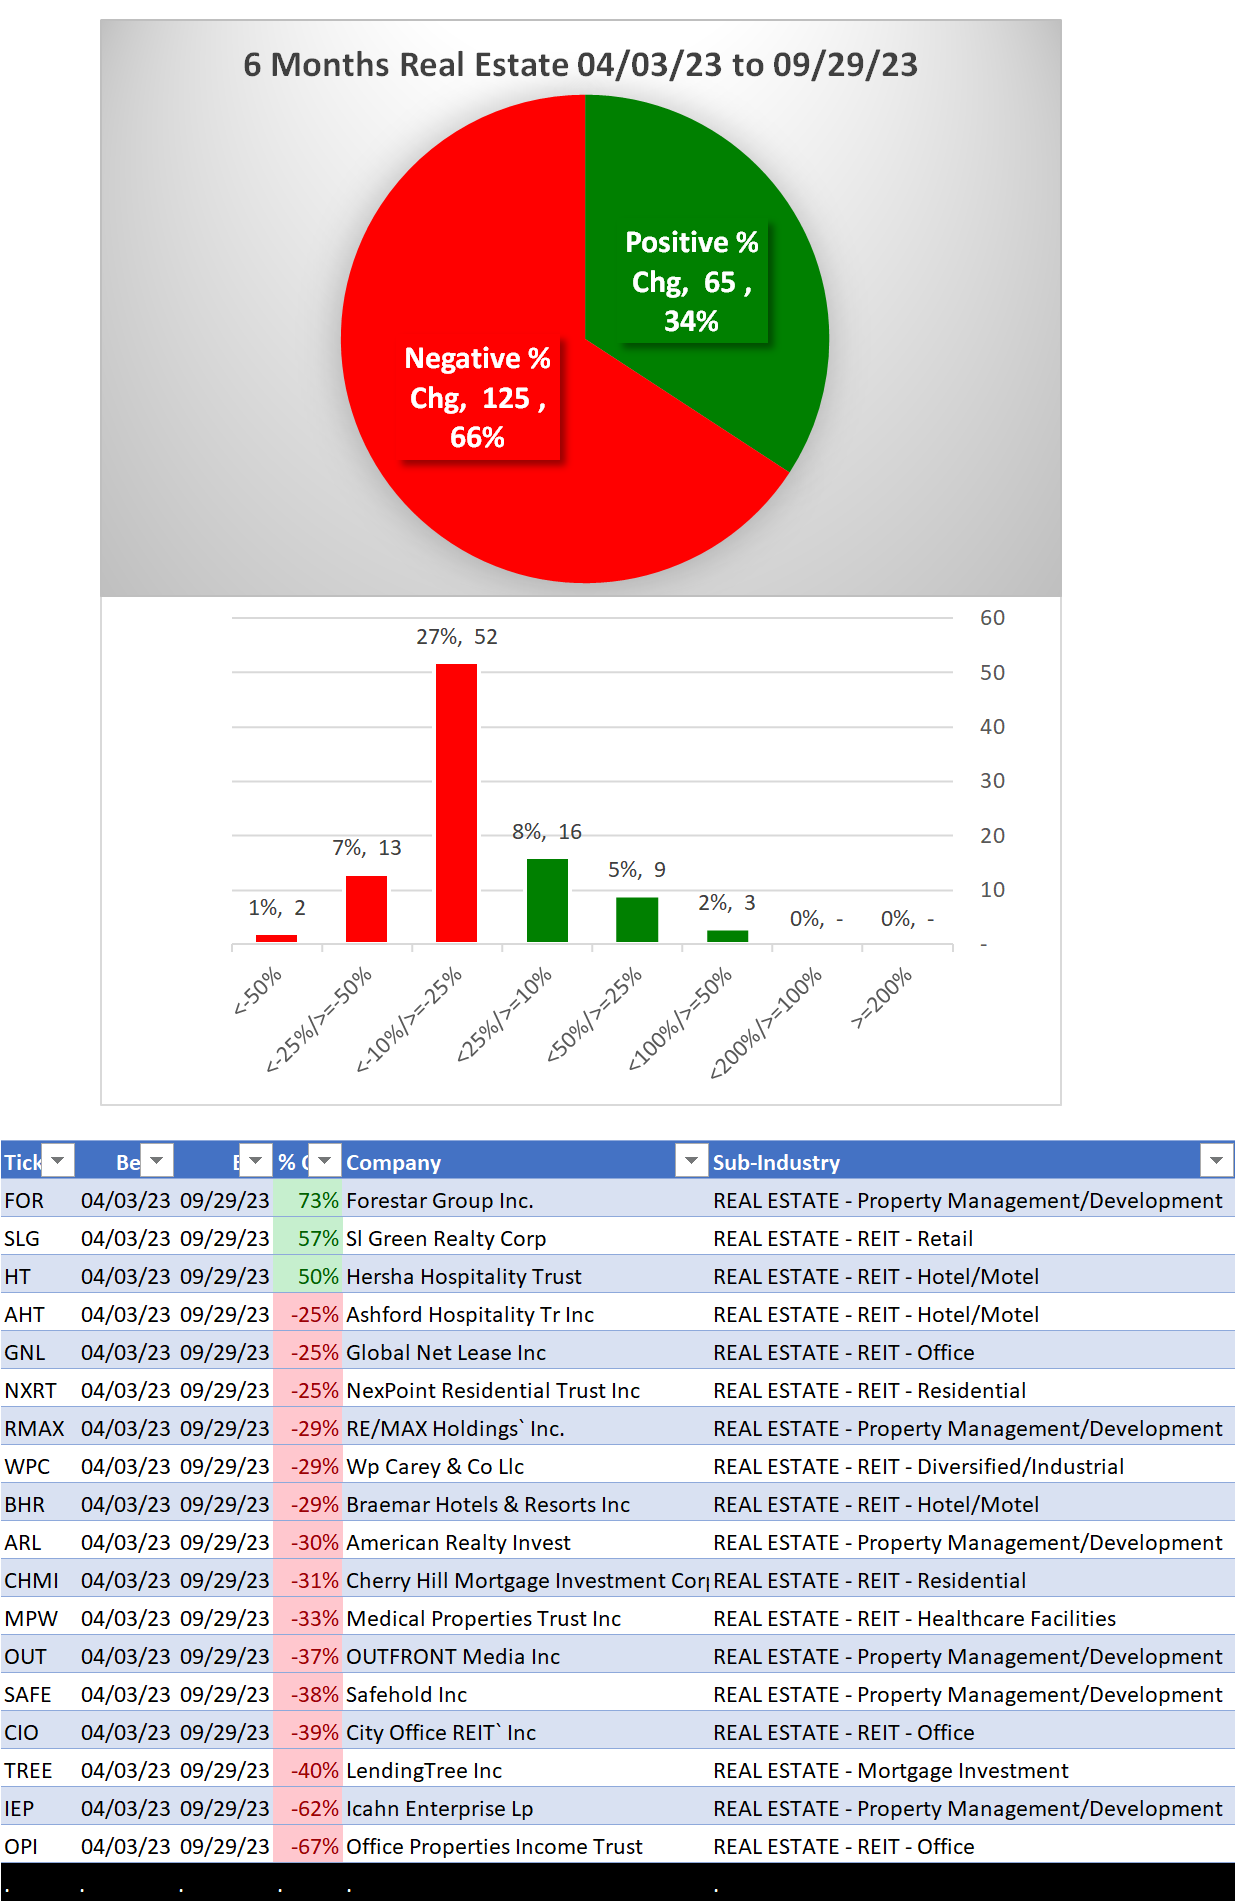
3A. Lookback 6 Months
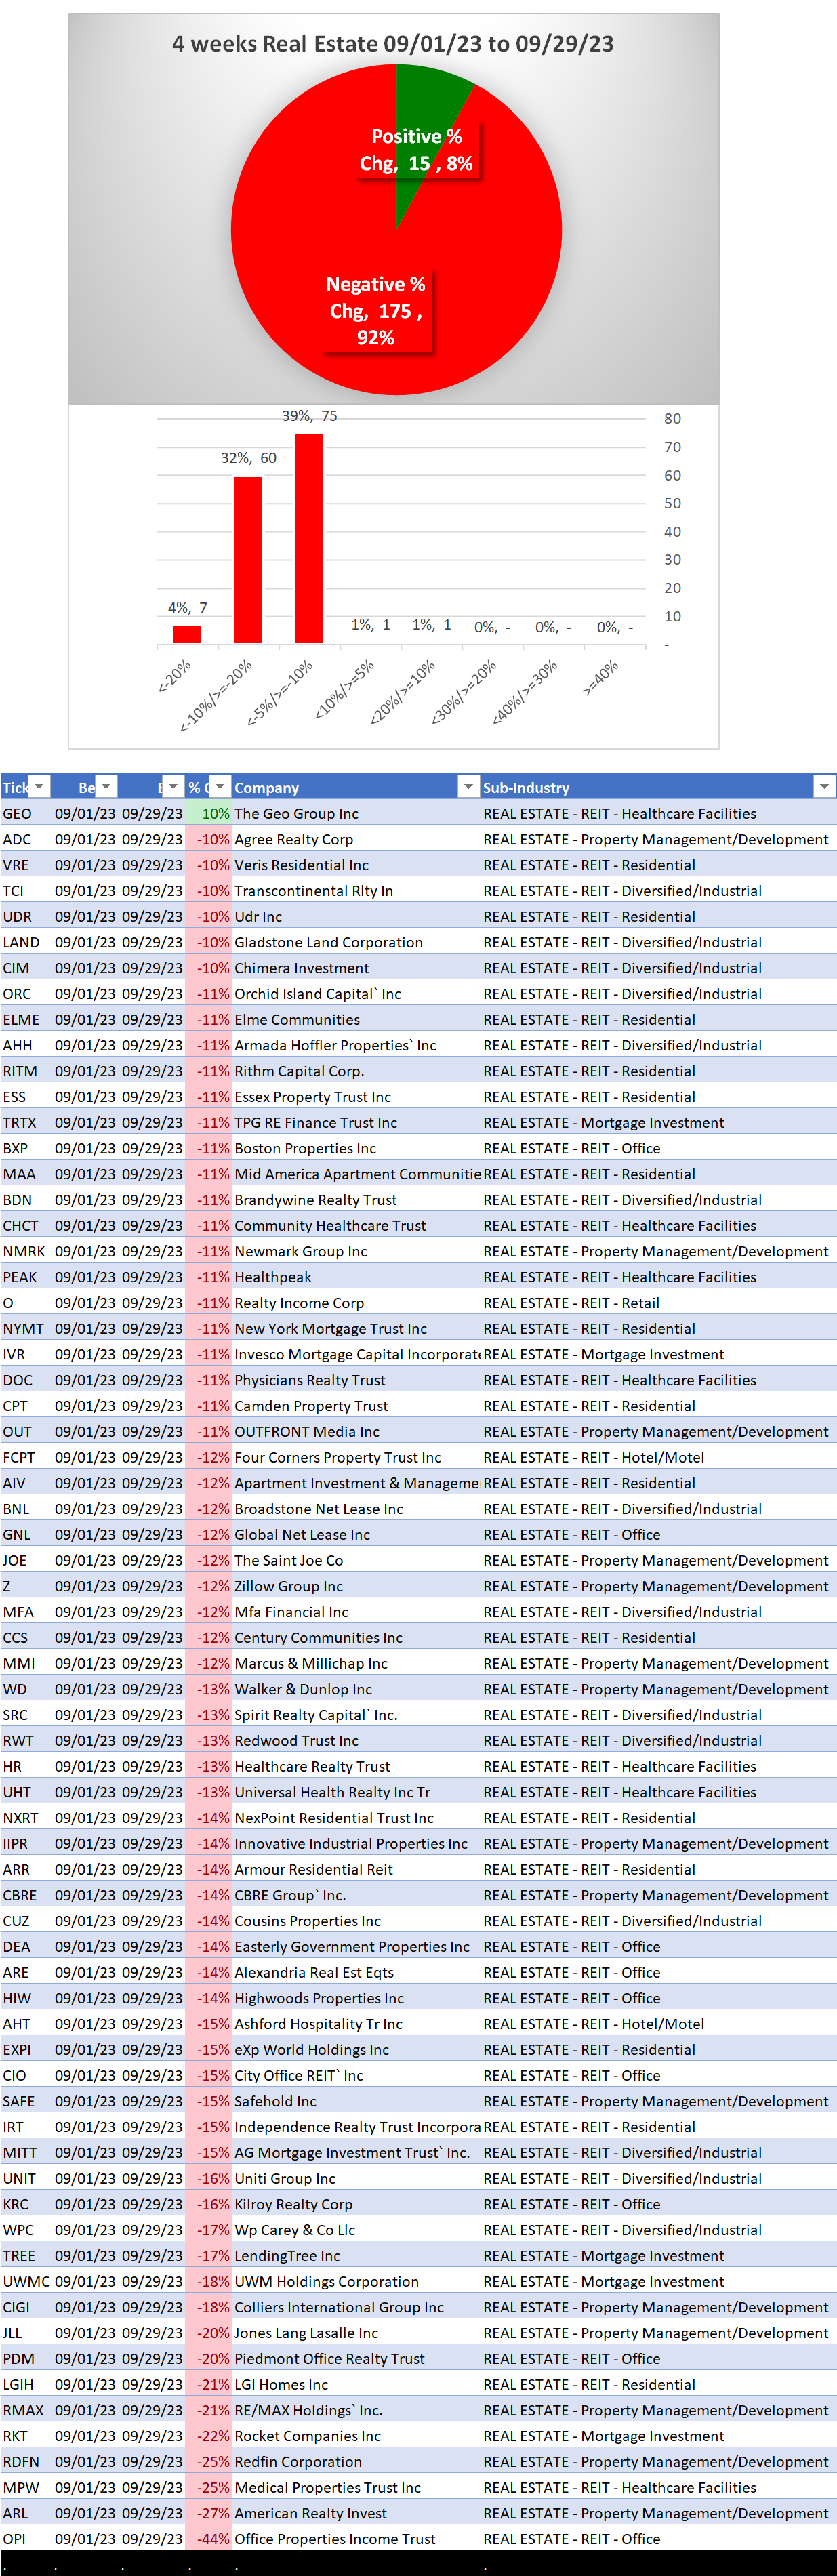
3B. Lookback 4 weeks
3C. Lookback 1 Week
1. INDUSTRY OVERVIEW
1A. Performance
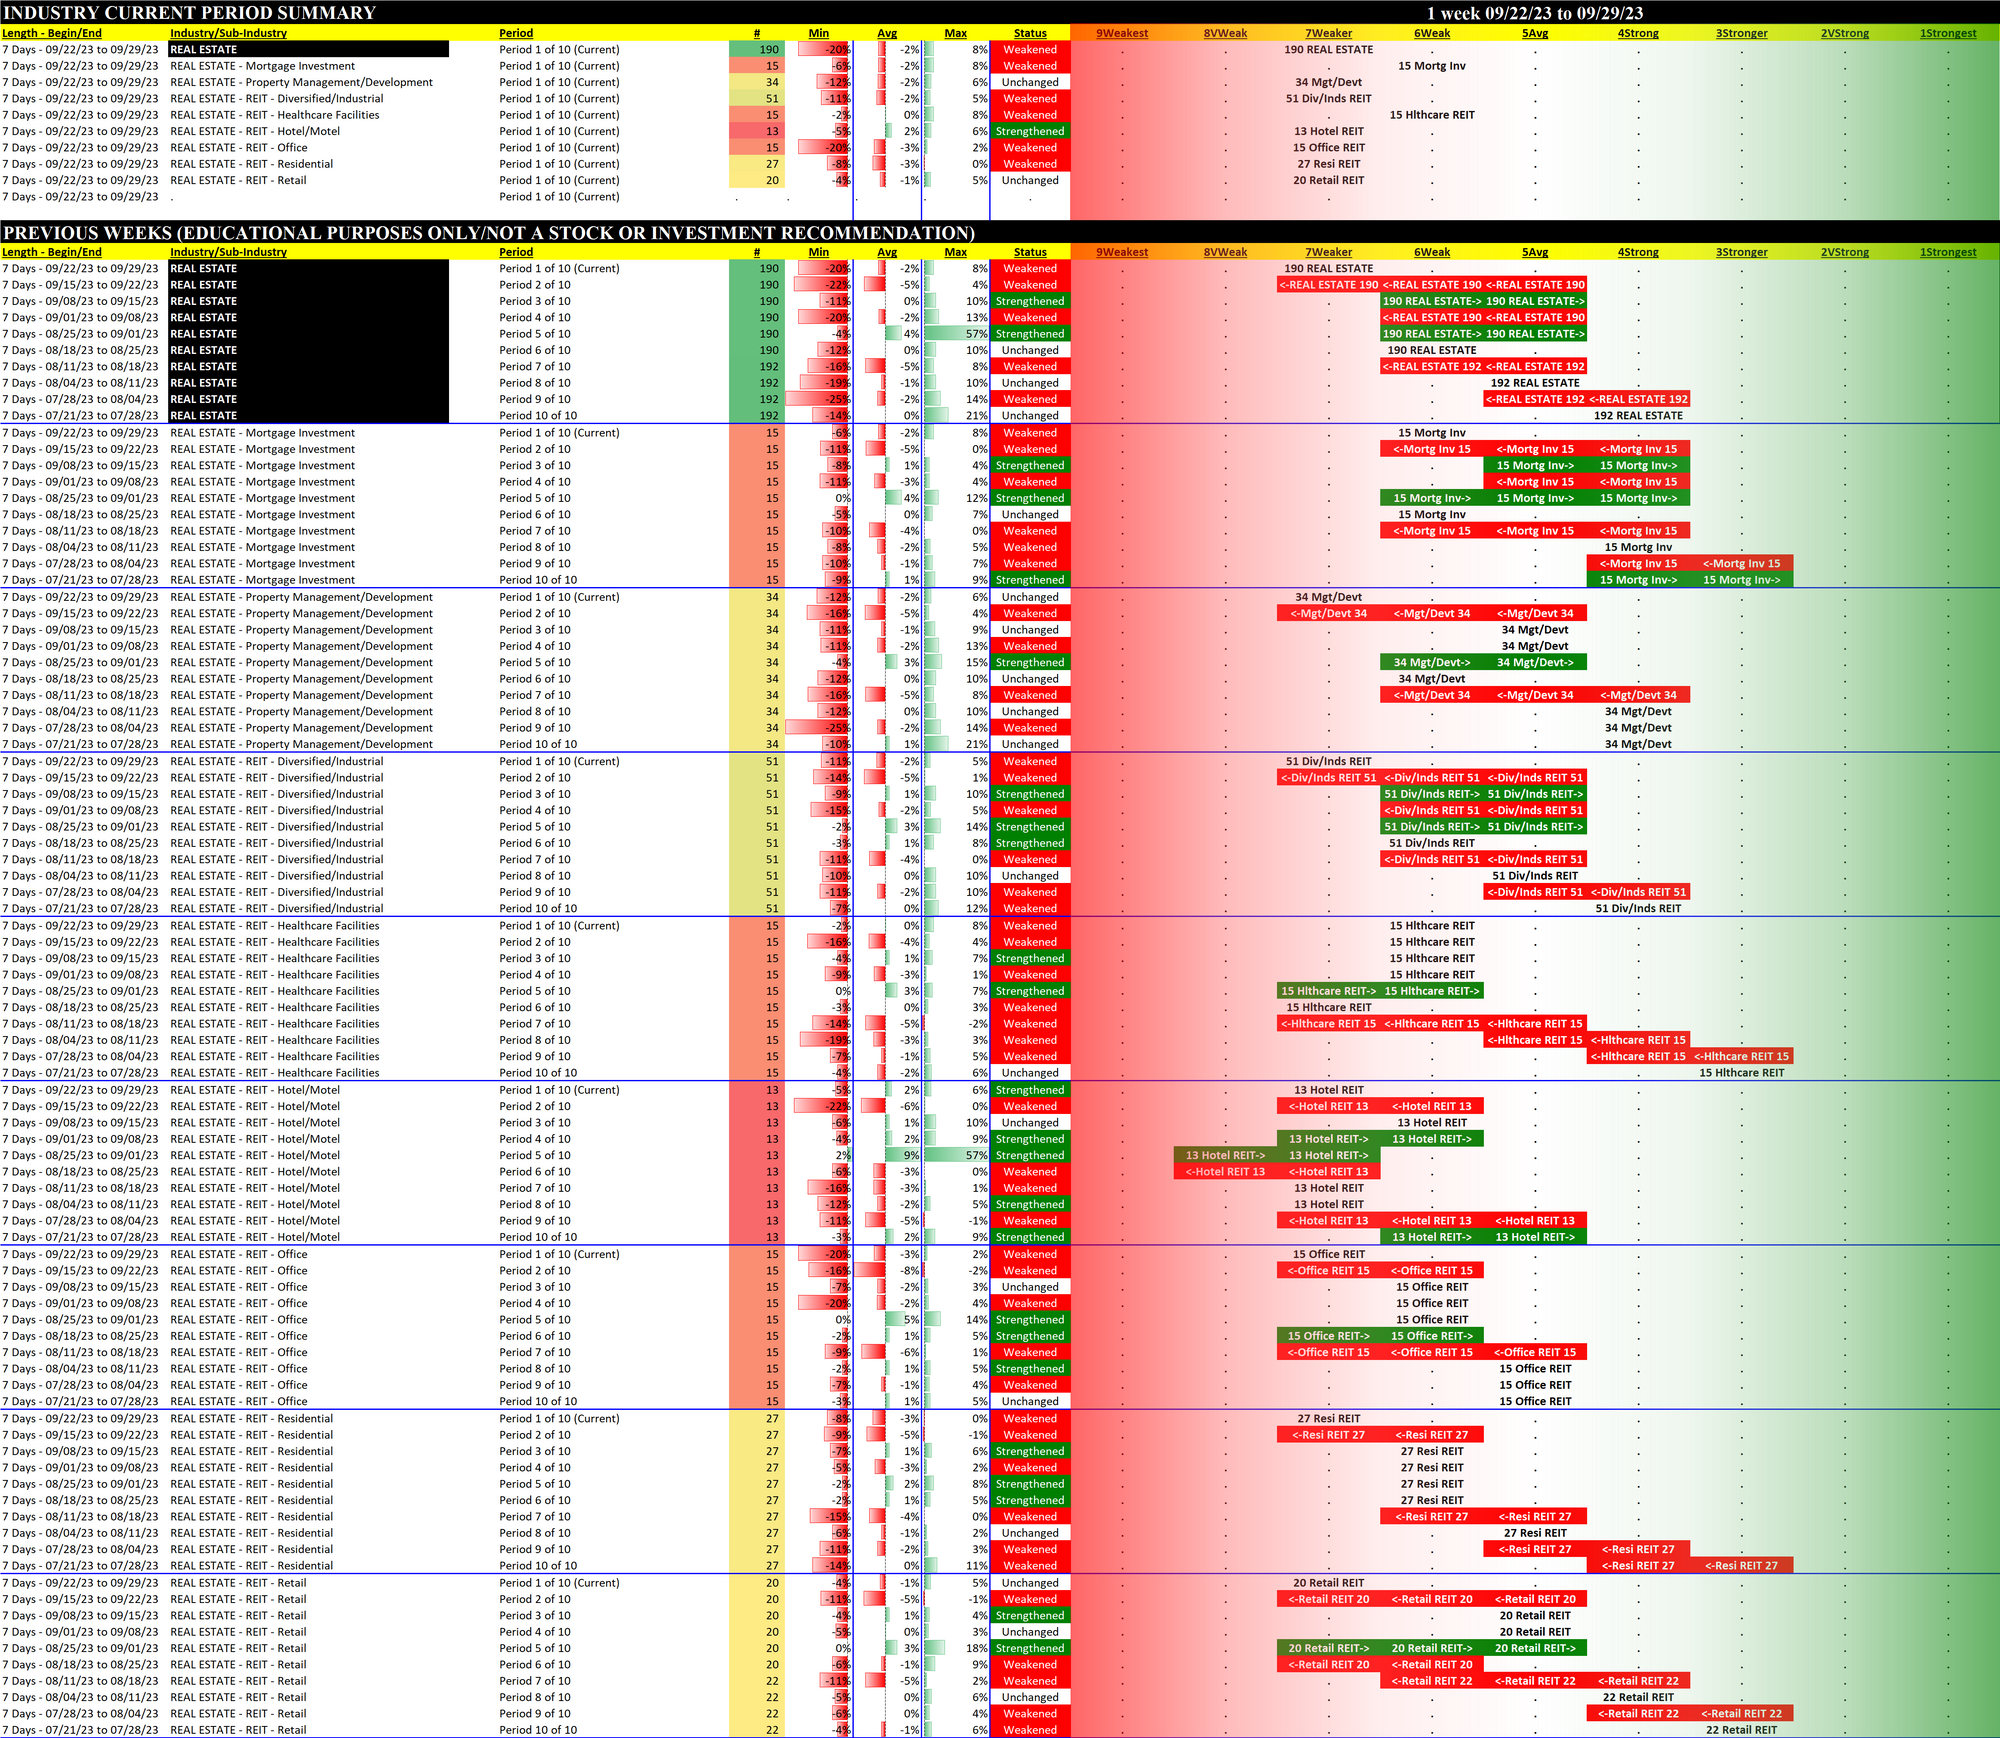
Past 10 Weeks Strengthening/Weakening week-by-week, per the following chart:
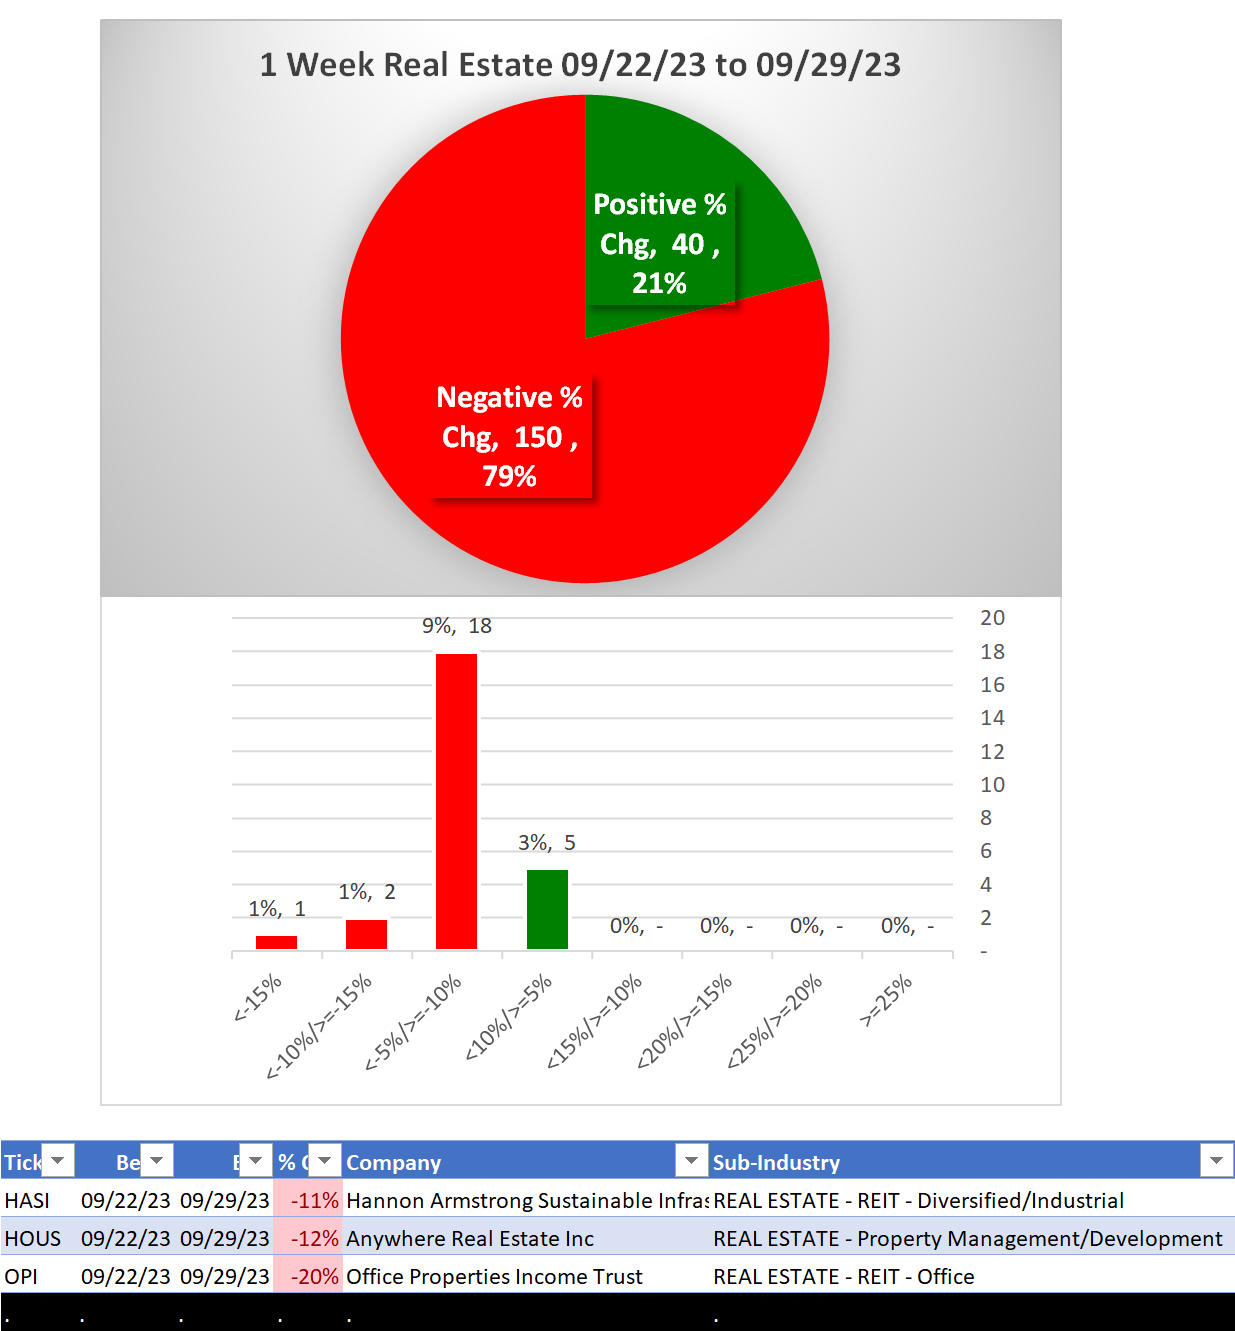
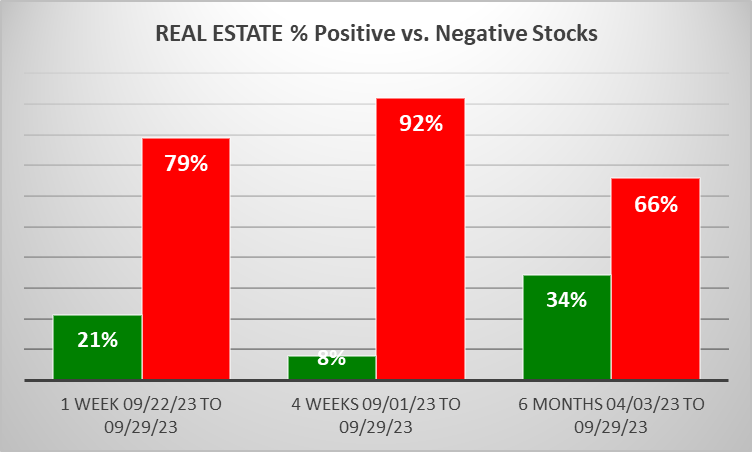
Mixed/STRENGTHENING 1 Week vs. Mid- and Longer-Term // 1 week positive/negative stocks ratio is HIGHER than 4 weeks but LOWER than 6 Months, per the following chart:
Comments:
- 21% positive stocks this week vs. 5% last week.
- 4 weeks, 35% of stocks lost more than -10%.
- Stocks rated Weakest are 55% of total (vs. 49% last week). 2% are Strongest both weeks.
- In numbers - only 3 RE stocks rated Strongest, 104 rated Weakest.
1B. Background
Largest of 8 sub-industries (190 stocks, average 24):
- REIT - Diversified/Industrial (51 stocks)
- Property Management/Development (34 stocks)
- REIT - Residential (27 stocks)
- REIT - Retail (20 stocks)
Top 10 by Market Capitalization:
PLD/ProLogis Inc, AMT/American Tower Corp, BN/Brookfield Corporation, PSA/Public Storage , WELL/Welltower Inc, SPG/Simon Property Group, DLR/Digital Realty Trust Inc, O/Realty Income Corp, CSGP/Costar Group Inc, AVB/Avalonbay Communities
2. SUB-INDUSTRIES AND STOCKS DETAIL
2A. Sub-Industries Overview
Strengthened: 0/8 sub-industries
Weakened: 0/8 sub-industries
STRONGEST at Weak rating/6th strongest of 9 levels:
- Mortgage Investment (15 stocks)
- REIT - Healthcare Facilities (15 stocks)
WEAKEST at Weaker rating/7th strongest of 9 levels:
- Property Management/Development (34 stocks)
- REIT - Diversified/Industrial (51 stocks)
- REIT - Hotel/Motel (13 stocks)
- REIT - Office (15 stocks)
- REIT - Residential (27 stocks)
- REIT - Retail (20 stocks)
2B. Sub-Industries 10-Week Strengthening Analysis
What: recent week-by-week strength changes for the industry and each underlying sub-industry
Why: objective measurement of strengthening and weakening enabling comparison within and across industries and sub-industries
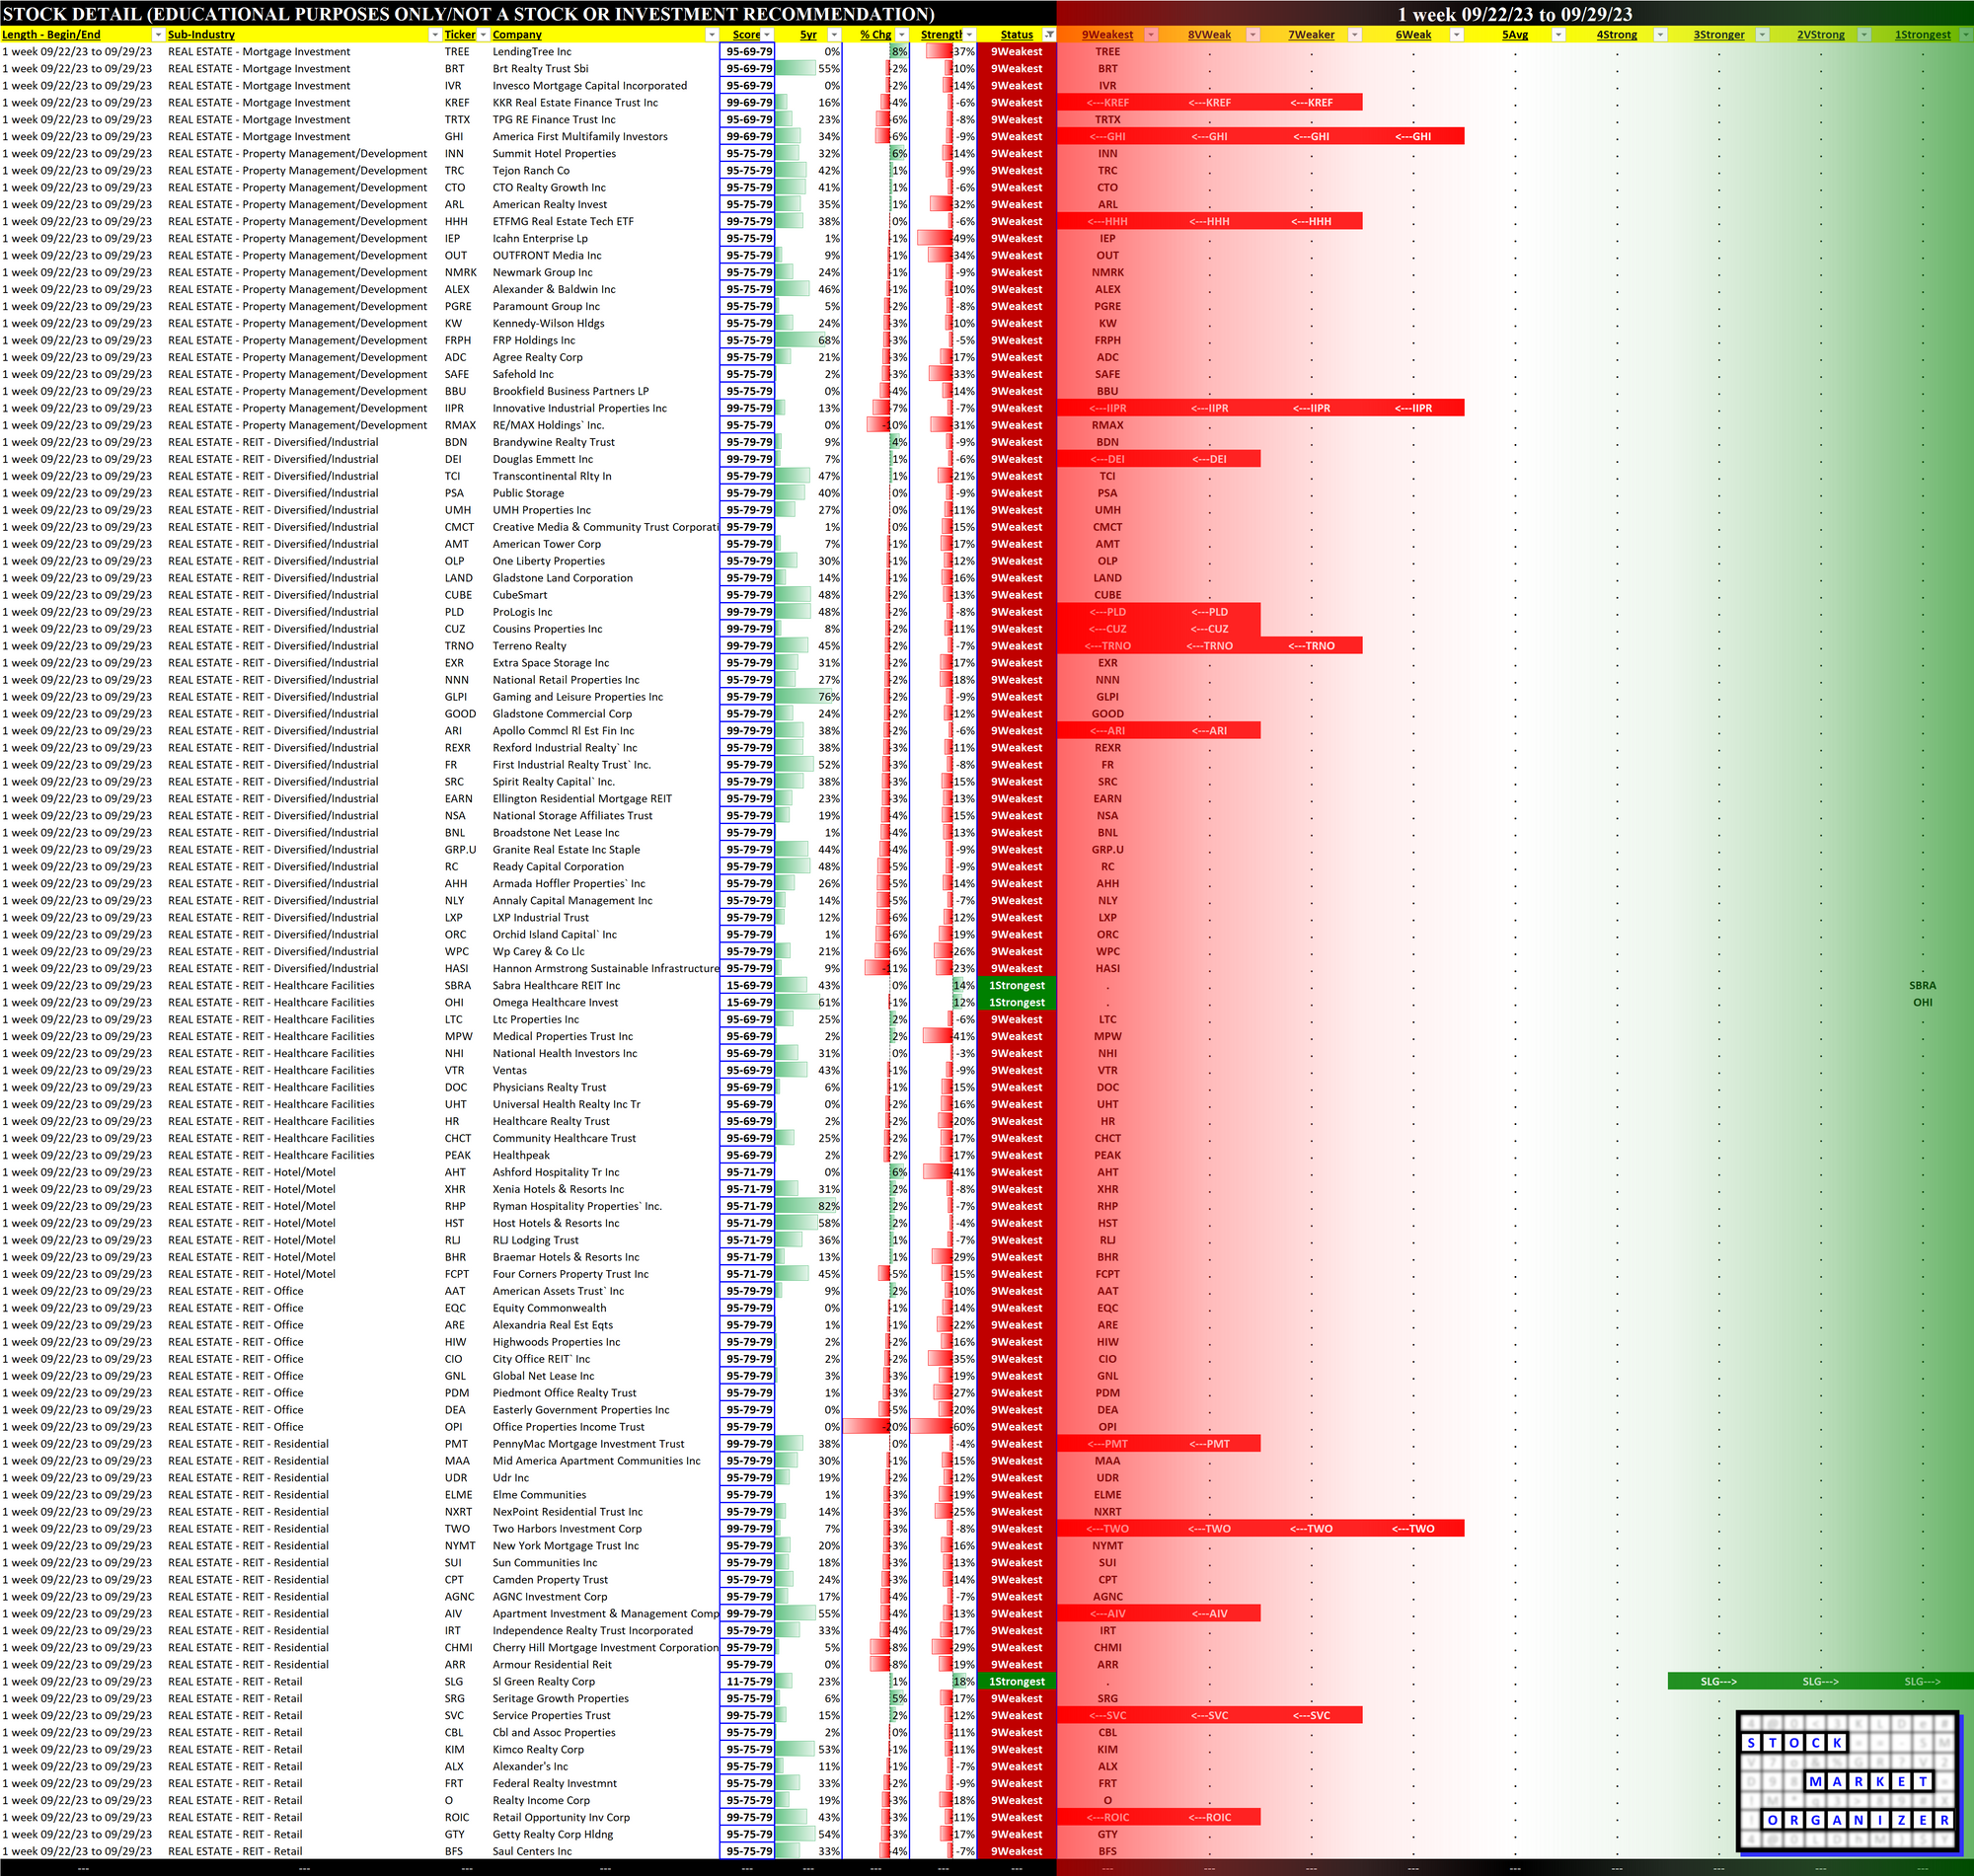
2C. Stocks 1 Week Strongest and Weakest
What: stocks currently rated Strongest/Weakest (highest/lowest of 9 strength ratings)
Why: most interesting stocks for available capital because
- the Strongest have the least amount of overhead supply to dampen breakouts while
- the Weakest may be prone to volatility, subject to big pops from bottom-fishing and short-covering BUT ALSO to bigger and faster falls.
(Not guaranteed and not a recommendation - weak stocks in weakening sub-industries may be better shorts than high-flyers.)
3. STRENGTH BY LOOKBACK PERIOD (with Best/Worst stocks)
3A. Lookback 6 Months
3B. Lookback 4 weeks
3C. Lookback 1 Week