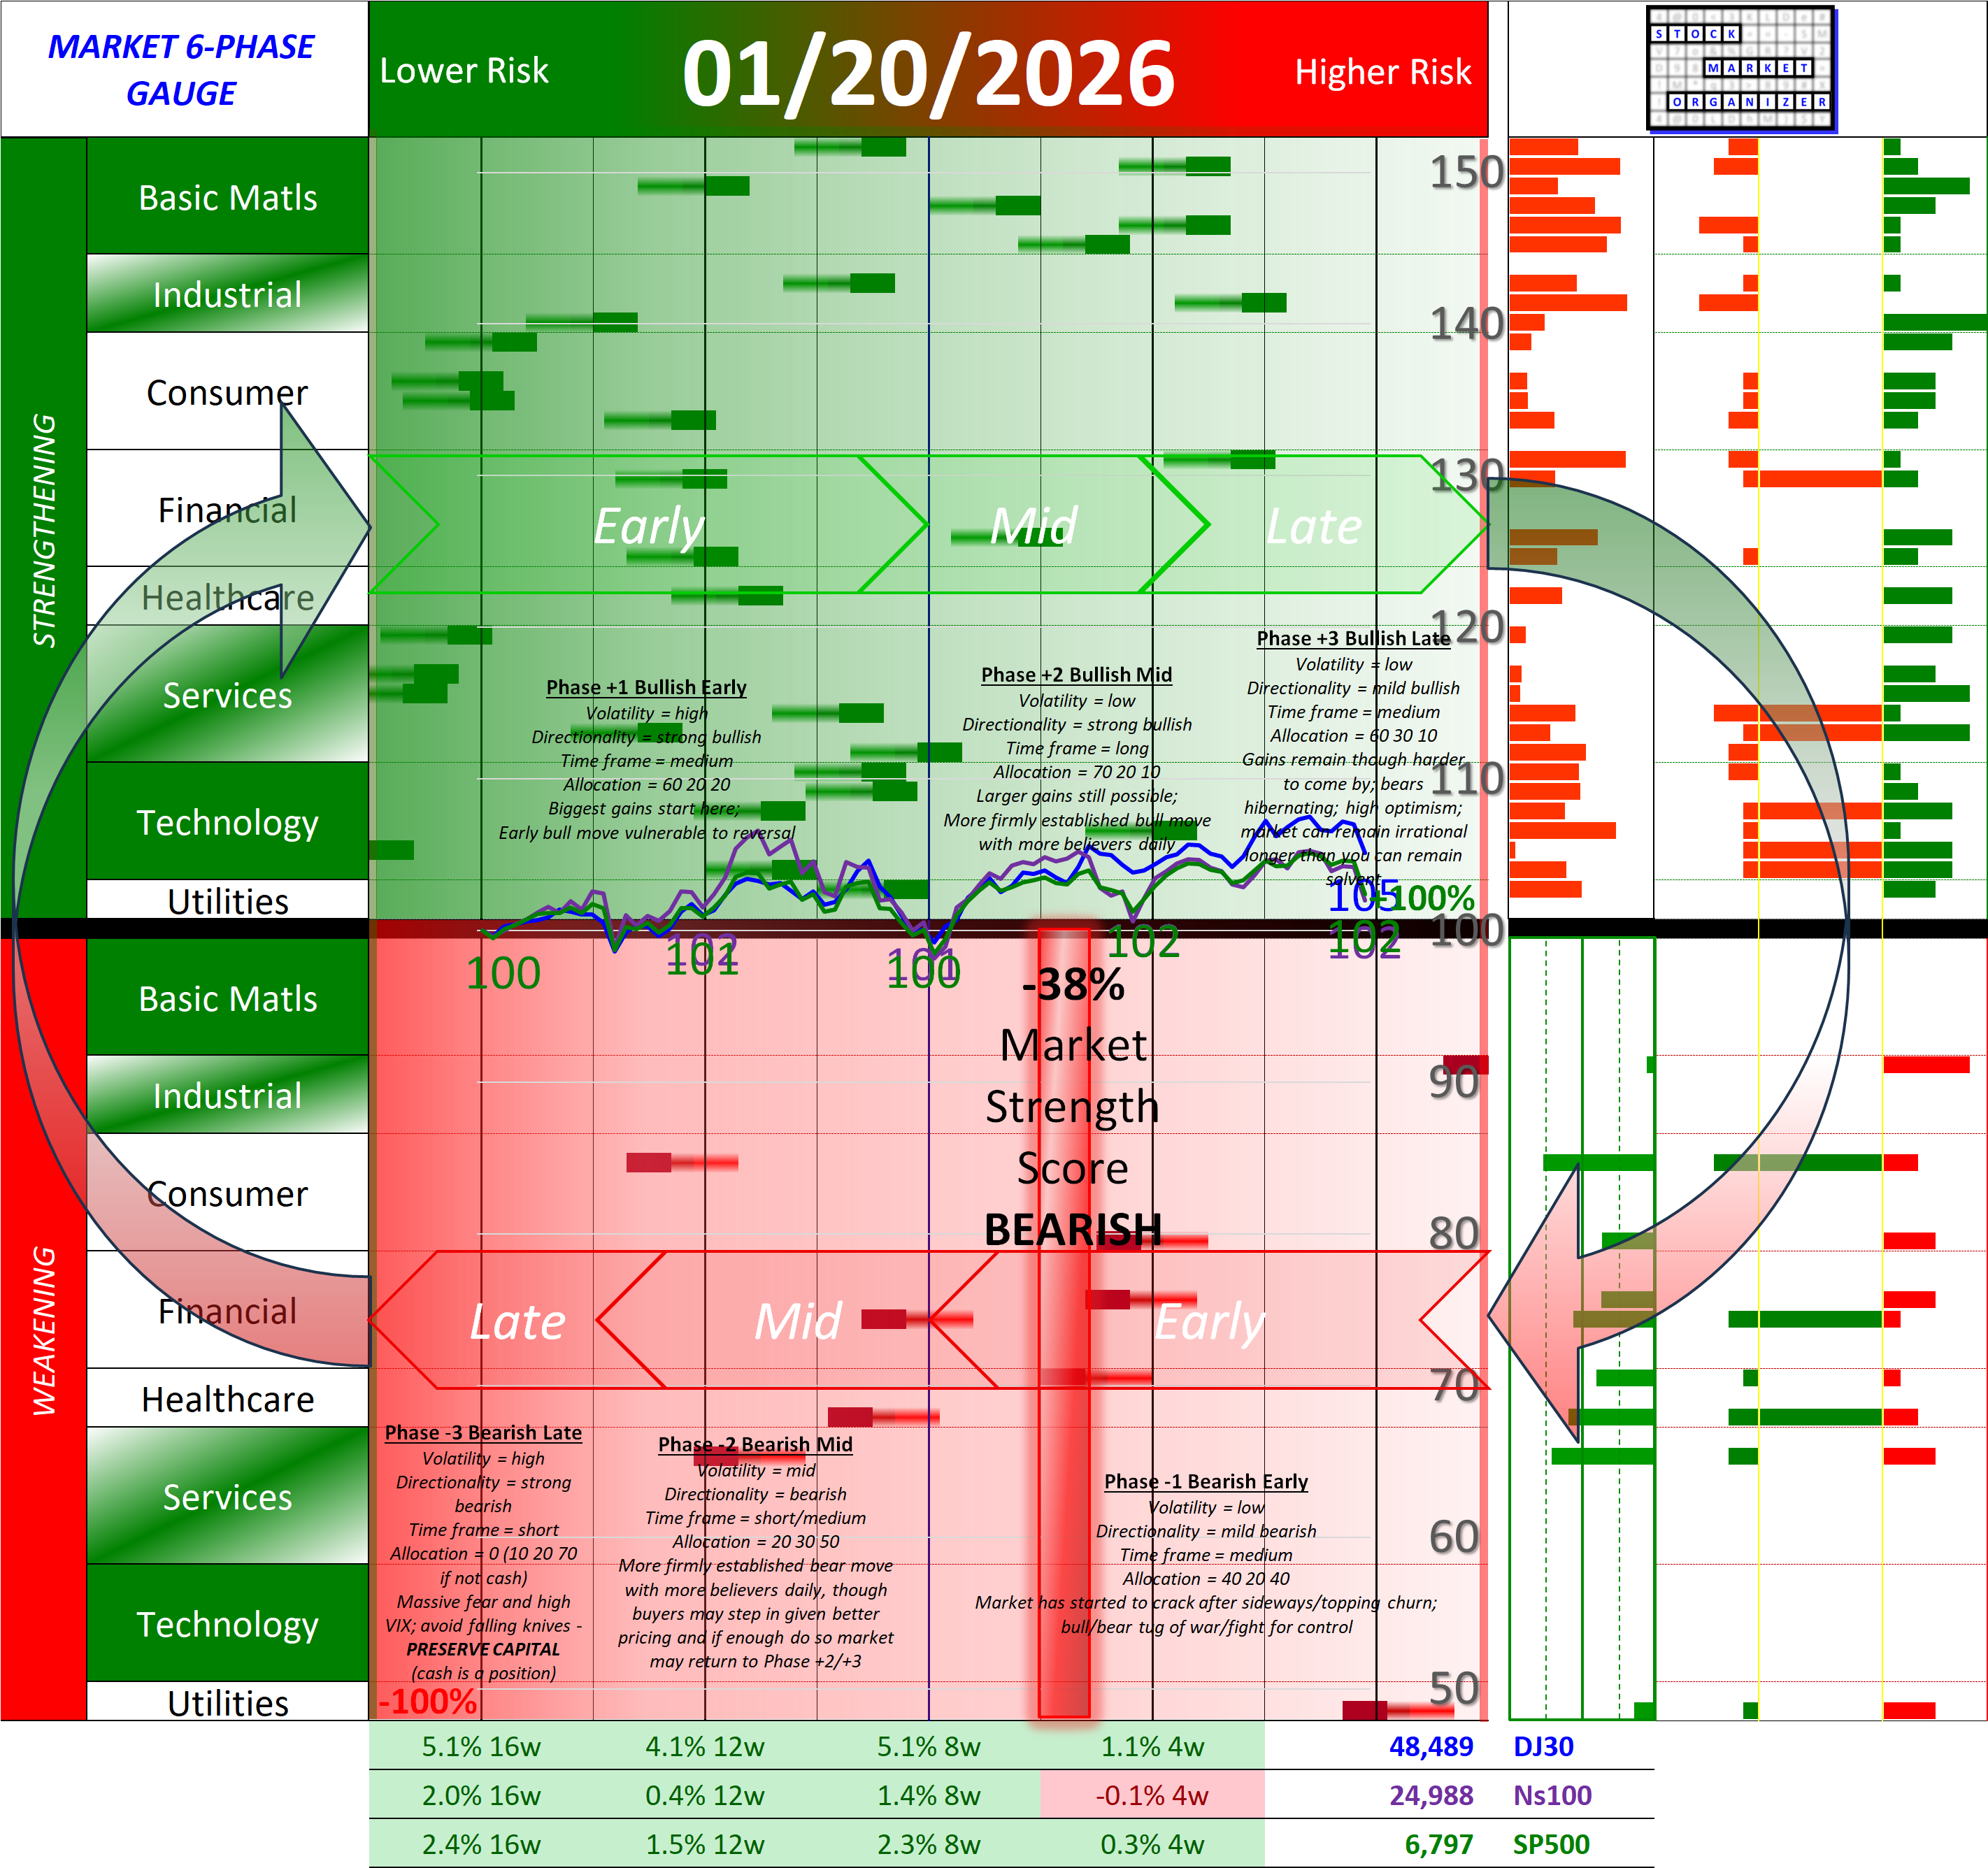
NEW - NEGATIVE Market Strength Score Tue 2026-01-20 (Phase -1 Bearish Early -38%)
Bad day on the market was enough to change the Market Strength Score from positive to negative today.
TLDR:
The lowest negative reading is -100% with no guarantees of continuation or reaching that level. Unless and until this reading does turn positive, act as if the market is not supportive of long positions.
Background:
This objective measurement is based upon the strengthening and weakening of component industries and sectors. Note on the above graphic the typical characteristics of this and the other five phases.
A positive reading means the market is rising = Risk On:
- Lower in the range of +0.1% to +100% means earlier in the uptrend, hence the more room to potentially run in the positive/bullish direction.
- The closer to +100% the less room there is to run, but a high positive reading still means Risk On. ("The market can remain irrational longer than you can remain solvent." Quoting either John Maynard Keynes or A. Gary Schilling)
A negative reading is Risk Off:
- Higher in the range of -0.1% to -100% means earlier in the downtrend, hence more room to potentially run in the negative/bearish direction.
- The closer to -100%, the closer to a market bottom BUT beware of catching falling knives.
How much more can this potentially run?
This system cannot reliably answer this question, in either up or down trends, and in terms of either time or index points. It provides only a measurement of what is, not what will be. From there, all we can do is understand the current "lay of the land" and allocate funds appropriately according to our worldview and risk tolerance for the relevant time frame.
Anything can happen in the market at any time for any reason (aka a turnaround to a positive reading) but for context the lowest level is -100%. That level has in the past marked washout bottoms (here are examples).
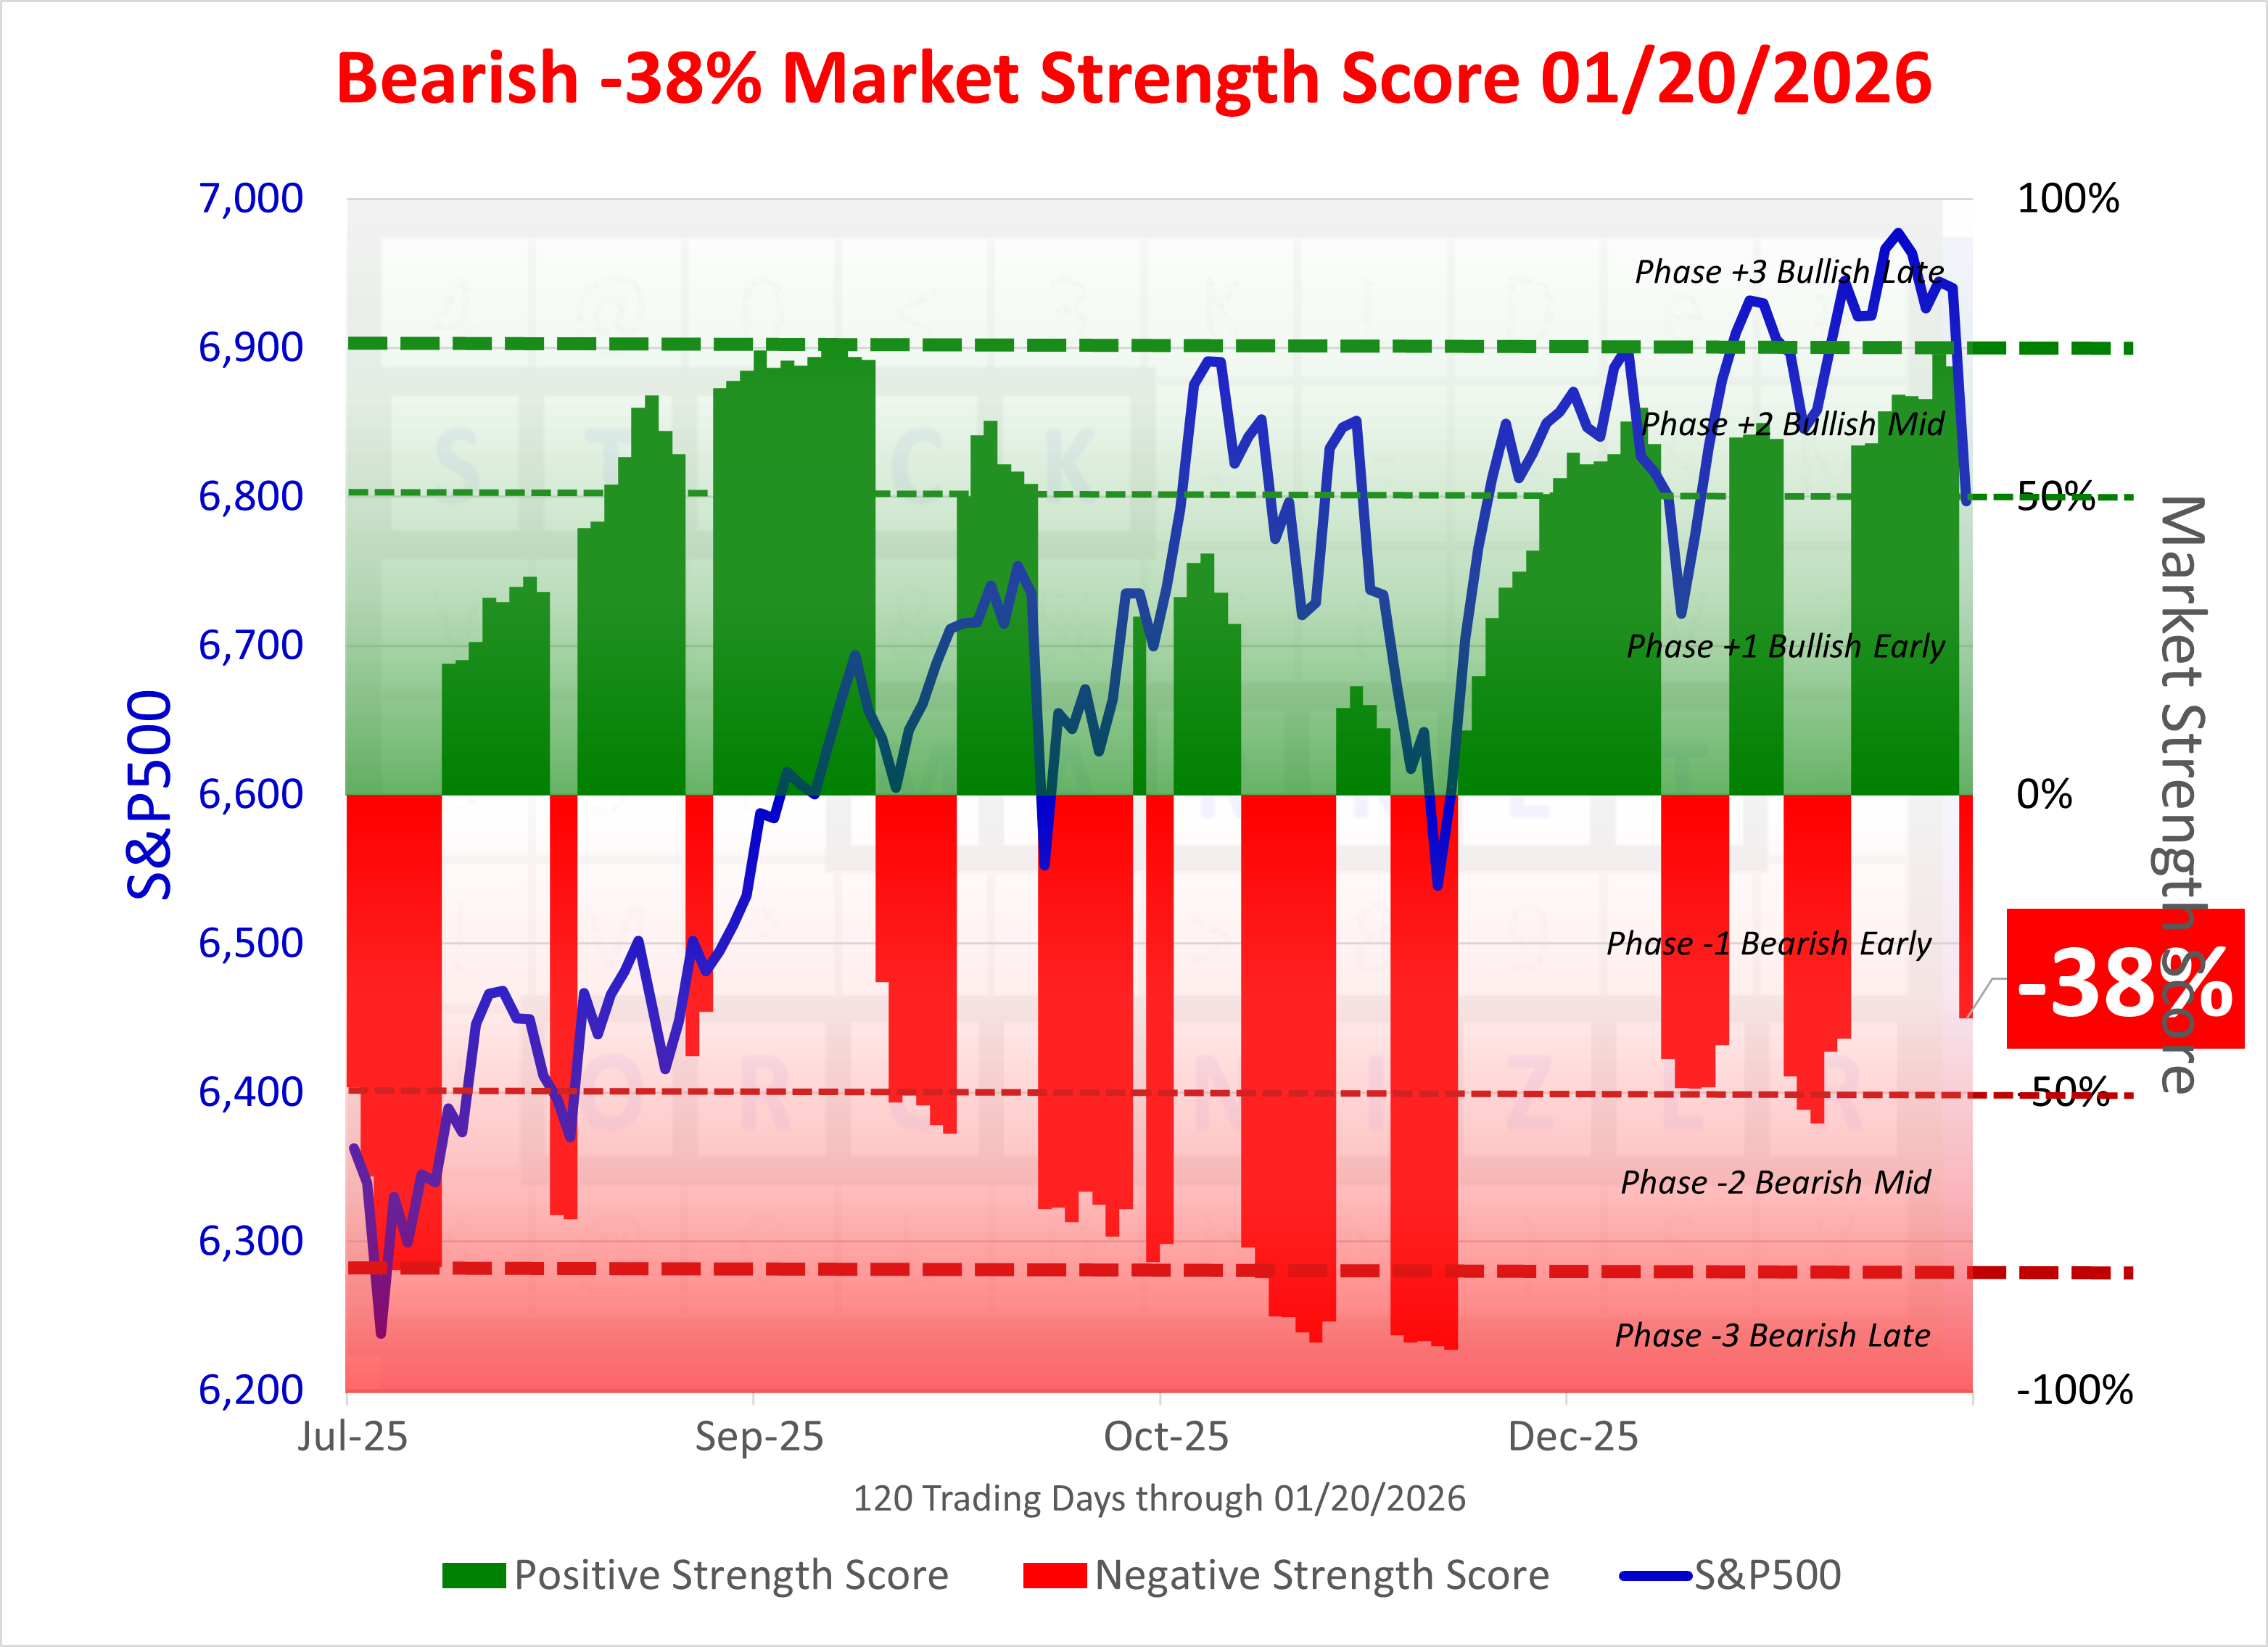
Comparison with S&P 500:
The following graphic shows the Market Strength Score overlaid on +/-6 months of S&P 500 index action:
Underlying Key Concepts
🔹 Signal duration depends solely on objective market action measurement.
🔹 It conveys what “is” – not “why,” or for how long.
🔹 It is an objective, repeatable, and reliable tool to
- enforce discipline,
- prevent unforced errors,
- eliminate emotion and confusion, and
- make sound decisions in all market environments.
This enforced discipline ensures new positions are opened only in the direction of market strengthening or weakening.
If strengthening, only new long positions can be opened.
If weakening, only new short positions can be opened.
Why? Trend respect.
Market weakening does not mean “exit existing long positions.” Only potential new positions are impacted by the critical question of “what is the market doing now?”
Existing open positions are closed when their behavior negates the entry thesis.