Food & Beverage 2023-09-22: Unchanged at WEAK strength rating (6th strongest of 9 levels), previous move was DOWN
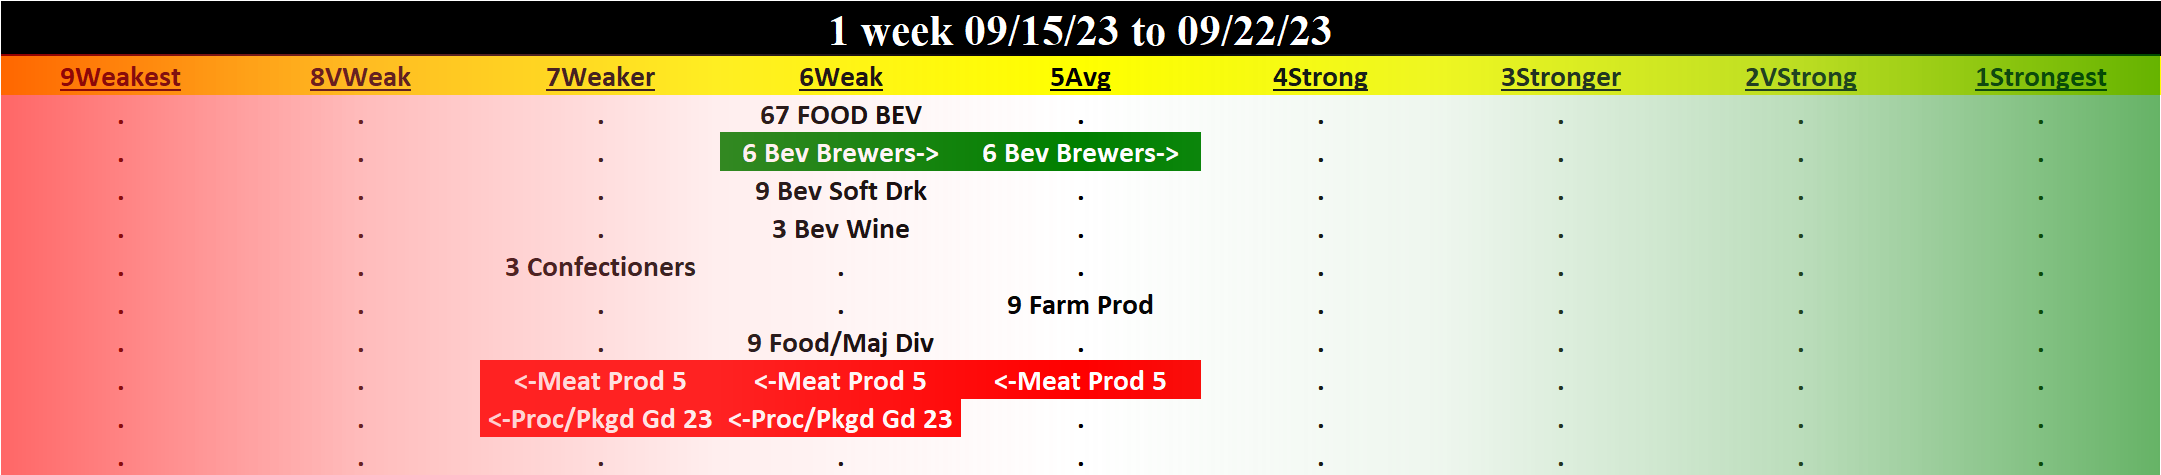
TABLE OF CONTENTS
- INDUSTRY OVERVIEW
1A. Performance
1B. Background - SUB-INDUSTRIES AND STOCKS DETAIL
2A. Sub-Industries Overview
2B. Sub-Industries 10-Week Strengthening Analysis
2C. Stocks 1 Week Strongest and Weakest - STRENGTH BY LOOKBACK PERIOD (with Best/Worst stocks)
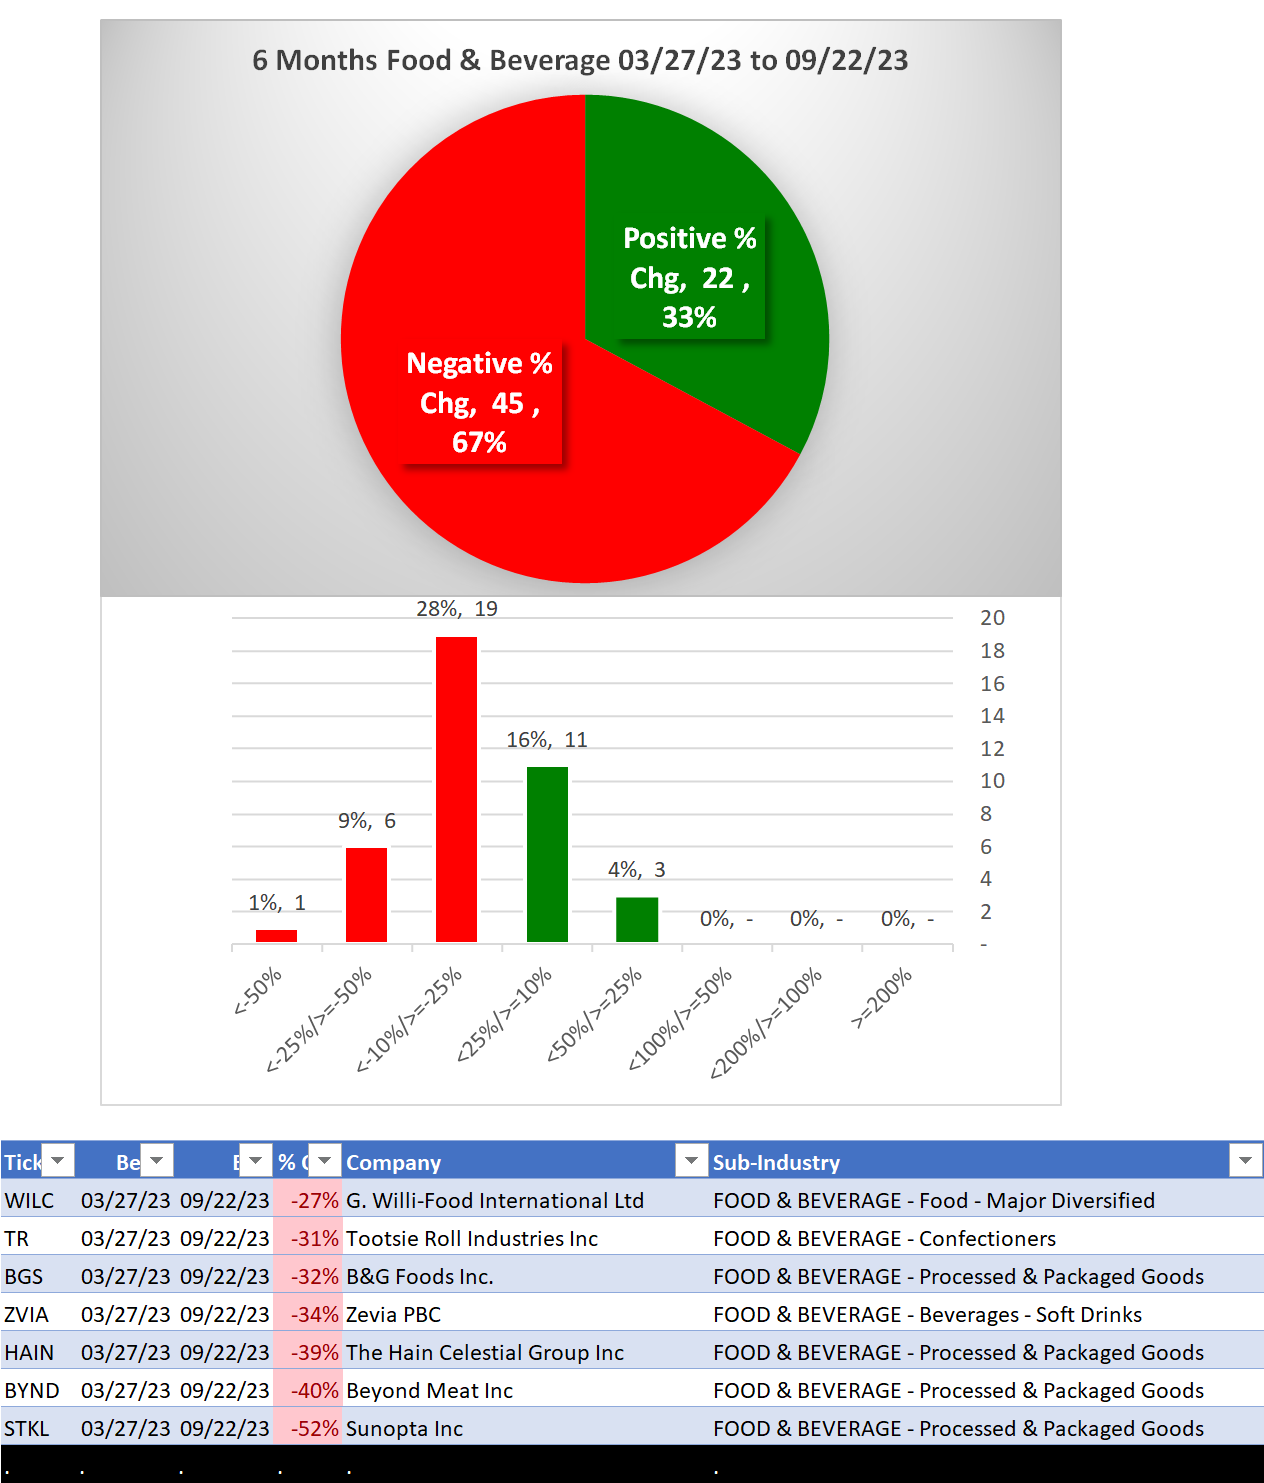
3A. Lookback 6 Months
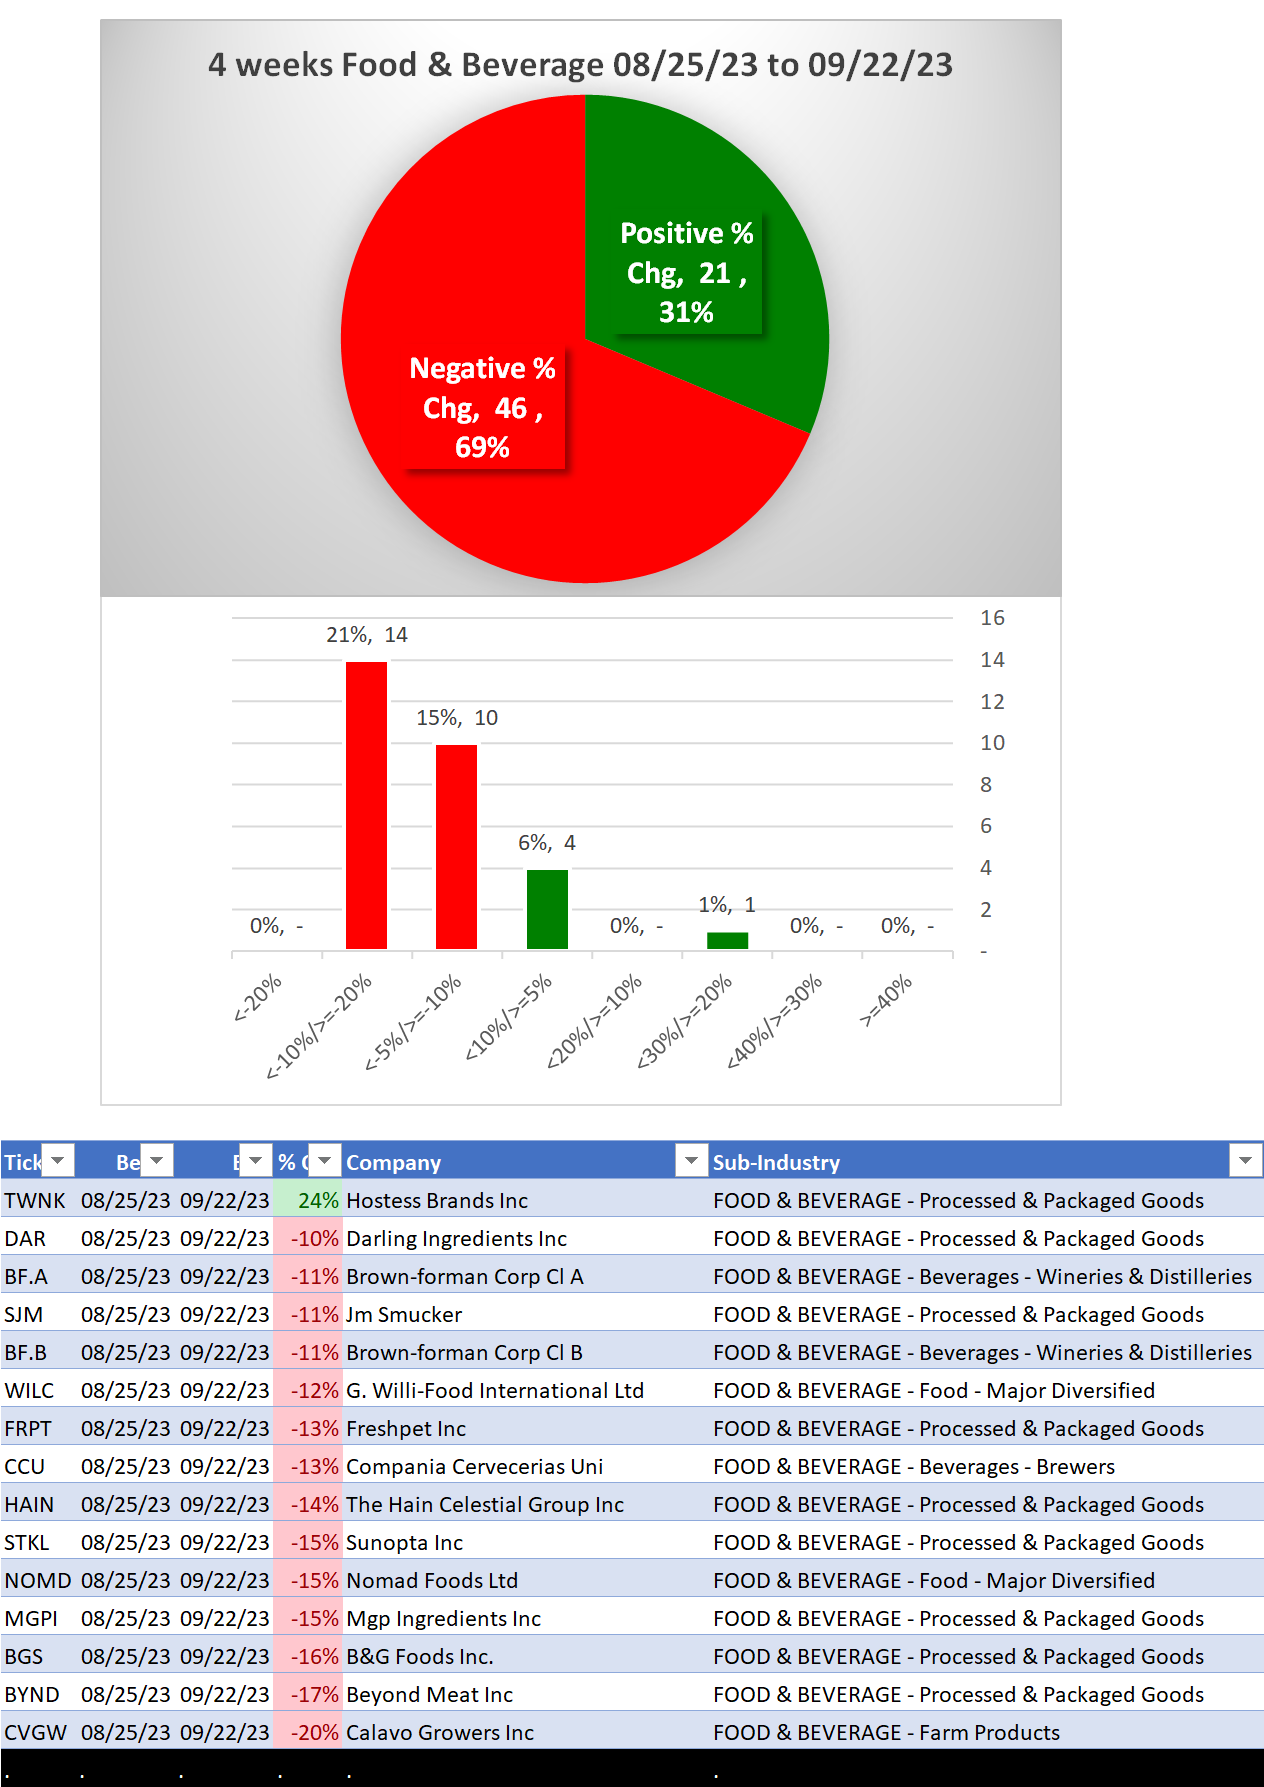
3B. Lookback 4 weeks
3C. Lookback 1 Week
1. INDUSTRY OVERVIEW
1A. Performance
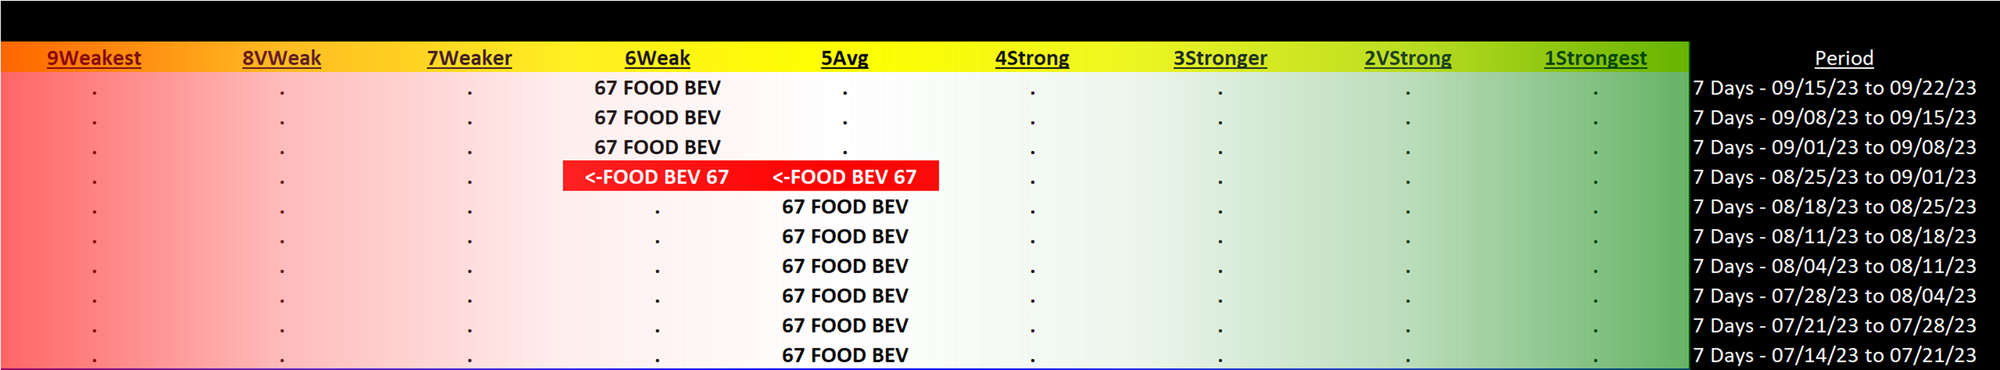
Past 10 Weeks Strengthening/Weakening week-by-week, per the following chart:
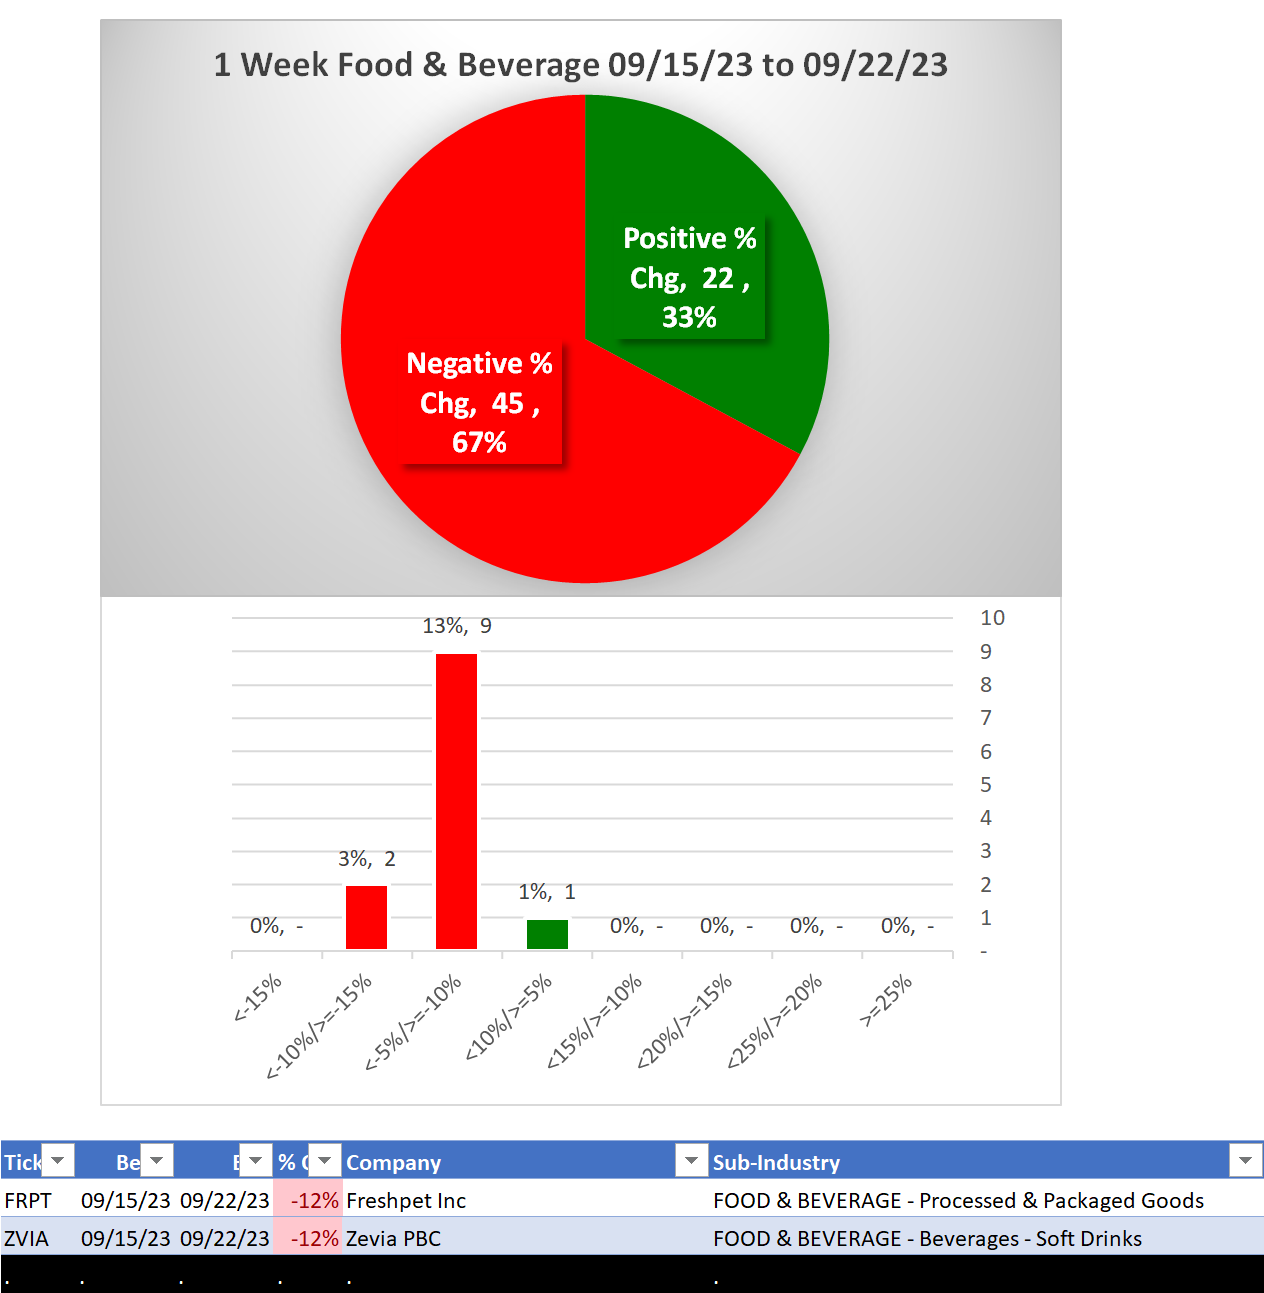
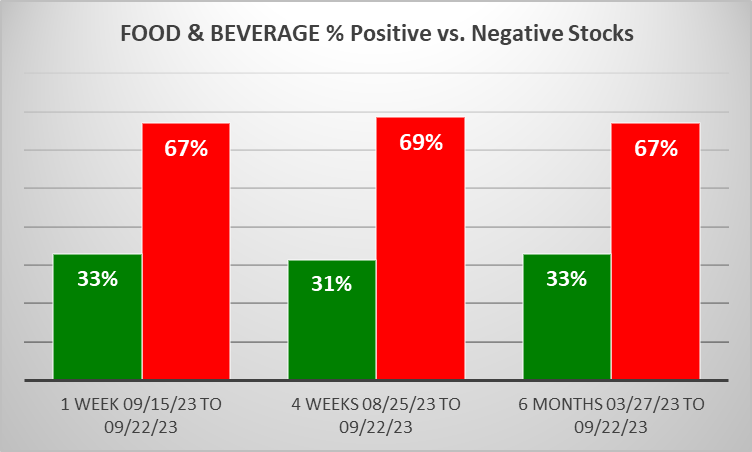
STRENGTHENING 1 Week vs. Mid- and Longer-Term // 1 week positive/negative stocks ratio is HIGHER than both 4 weeks and 6 Months, per the following chart:
1B. Background
Largest of 8 sub-industries (67 stocks, average 8):
- Processed & Packaged Goods (23 stocks)
- Beverages - Soft Drinks (9 stocks)
- Farm Products (9 stocks)
- Food - Major Diversified (9 stocks)
Top 10 by Market Capitalization:
KO/Coca-Cola Co, PEP/Pepsico Inc, FMX/Fomento Economico Mexicano Sab, BUD/Anheuser-Busch InBev, MDLZ/Mondelez International Inc, ABEV/Ambev S.A., MNST/Monster Beverage Corporation, STZ/Constellation Brands Inc, KDP/Keurig Dr Pepper Inc, ADM/Archer Daniels Midland
2. SUB-INDUSTRIES AND STOCKS DETAIL
2A. Sub-Industries Overview
Strengthened: 1/8 sub-industries
Weakened: 2/8 sub-industries
STRONGEST at Average rating/5th strongest of 9 levels:
- Beverages - Brewers (6 stocks)
- Farm Products (9 stocks)
WEAKEST at Weaker rating/7th strongest of 9 levels:
- Confectioners (3 stocks)
- Meat Products (5 stocks)
- Processed & Packaged Goods (23 stocks)
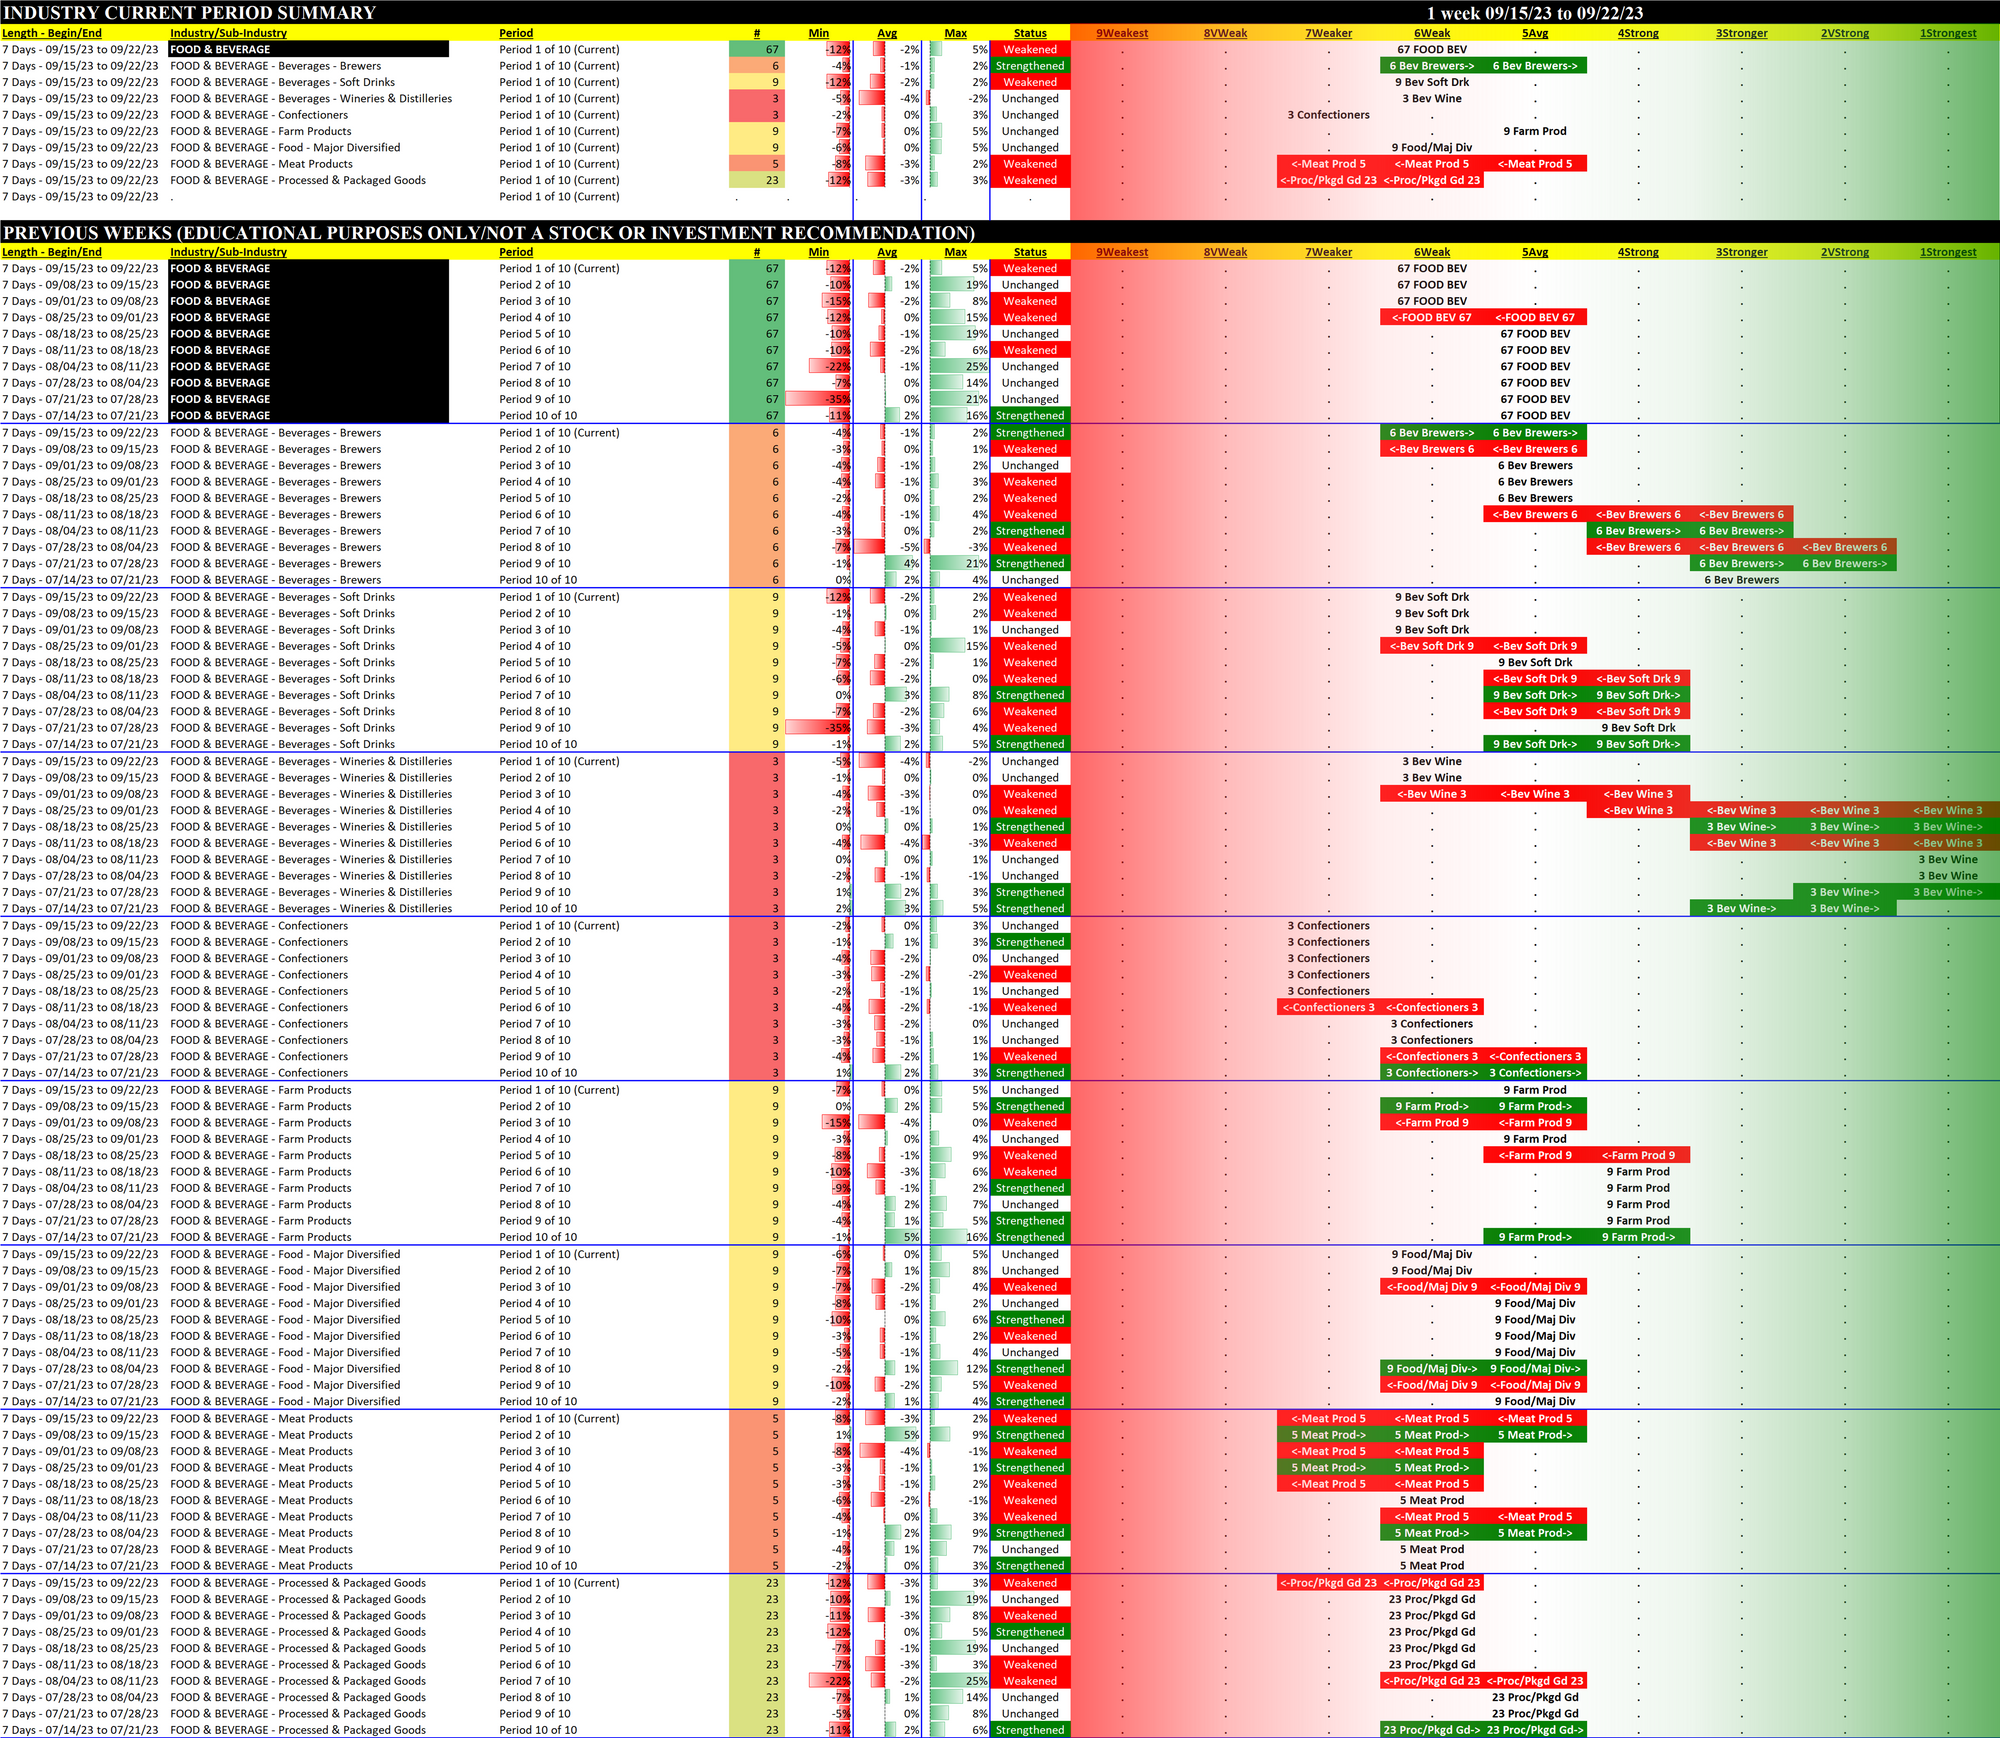
2B. Sub-Industries 10-Week Strengthening Analysis
What: recent week-by-week strength changes for the industry and each underlying sub-industry
Why: objective measurement of strengthening and weakening enabling comparison within and across industries and sub-industries
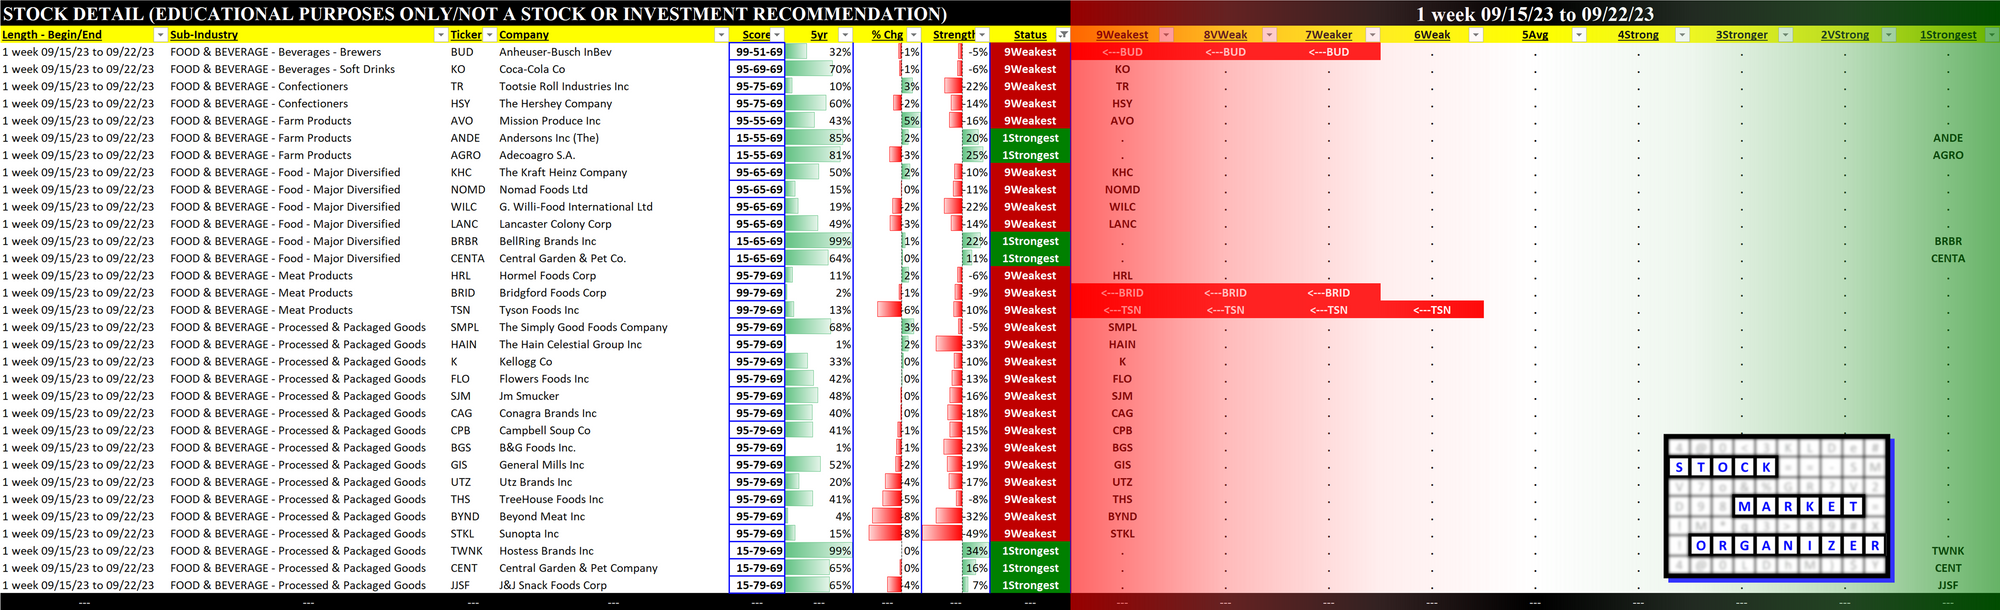
2C. Stocks 1 Week Strongest and Weakest
What: stocks currently rated Strongest/Weakest (highest/lowest of 9 strength ratings)
Why: most interesting stocks for available capital because
- the Strongest have the least amount of overhead supply to dampen breakouts while
- the Weakest may be prone to volatility, subject to big pops from bottom-fishing and short-covering BUT ALSO to bigger and faster falls.
(Not guaranteed and not a recommendation - weak stocks in weakening sub-industries may be better shorts than high-flyers.)
3. STRENGTH BY LOOKBACK PERIOD (with Best/Worst stocks)
3A. Lookback 6 Months
3B. Lookback 4 weeks
3C. Lookback 1 Week